Atrophy Characterized by Purkinje Cell Loss and Glial
Cell Activation
Zhengshan Zhao1, Jing Wang2, Chunying Zhao1, Weina Bi1, Zhenyu Yue2, Zhongmin Alex Ma1*
1Division of Experimental Diabetes and Aging, Department of Geriatrics and Palliative Medicine, Mount Sinai School of Medicine, New York, New York, United States of America,2Department of Neurology, Mount Sinai School of Medicine, New York, New York, United States of America
Abstract
Infantile neuroaxonal dystrophy (INAD) is a progressive, autosomal recessive neurodegenerative disease characterized by axonal dystrophy, abnormal iron deposition and cerebellar atrophy. This disease was recently mapped toPLA2G6, which
encodes group VI Ca2+-independent phospholipase A
2(iPLA2or iPLA2b). Here we show that genetic ablation of PLA2G6 in
mice (iPLA2b-/-) leads to the development of cerebellar atrophy by the age of 13 months. Atrophied cerebella exhibited
significant loss of Purkinje cells, as well as reactive astrogliosis, the activation of microglial cells, and the pronounced up-regulation of the pro-inflammatory cytokines tumor necrosis factor-a(TNF-a) and interleukin-1b(IL-1b). Moreover, glial cell activation and the elevation in TNF-a and IL-1b expression occurred before apparent cerebellar atrophy. Our findings indicate that the absence of PLA2G6 causes neuroinflammation and Purkinje cell loss and ultimately leads to cerebellar atrophy. Our study suggests that iPLA2b-/-mice are a valuable model for cerebellar atrophy in INAD and that early
anti-inflammatory therapy may help slow the progression of cerebellar atrophy in this deadly neurodegenerative disease.
Citation:Zhao Z, Wang J, Zhao C, Bi W, Yue Z, et al. (2011) Genetic Ablation of PLA2G6 in Mice Leads to Cerebellar Atrophy Characterized by Purkinje Cell Loss and Glial Cell Activation. PLoS ONE 6(10): e26991. doi:10.1371/journal.pone.0026991
Editor:Lin Mei, Medical College of Georgia, United States of America
ReceivedJuly 22, 2011;AcceptedOctober 7, 2011;PublishedOctober 28, 2011
Copyright:ß2011 Zhao et al. This is an open-access article distributed under the terms of the Creative Commons Attribution License, which permits unrestricted use, distribution, and reproduction in any medium, provided the original author and source are credited.
Funding:NIH/NINDS,R01 NS063962, R01NS060809 The funders had no role in study design, data collection and analysis, decision to publish, or preparation of the manuscript.
Competing Interests:The authors have declared that no competing interests exist. * E-mail: zhongmin.ma@mssm.edu
Introduction
The phospholipase A2 (PLA2) family is a diverse group of
enzymes that catalyzes the hydrolysis of thesn-2 fatty acyl bond of phospholipids to liberate free fatty acids and lysophospholipids [1]. Among the family members, group VIA PLA2 (iPLA2b) has
unique structural features, including eight N-terminal ankyrin repeats, caspase-3 cleavage sites, an ATP-binding domain, a serine lipase consensus sequence (GXSXG), a bipartite nuclear localiza-tion sequence, and a C-terminal calmodulin-binding domain [1]. The human iPLA2bgene,PLA2G6, maps to chromosome 22q13.1
and encodes several isoforms [2].
Morgan et al. [3] reported that mutations inPLA2G6underlie human neurodegenerative disorders, infantile neuroaxonal dys-trophy (INAD) and neurodegeneration with brain iron accumu-lation (NBIA). INAD is a neurodegenerative disease with infantile onset and death as a teenager or in early adulthood. It is characterized by pathologic axonal swelling and spheroid bodies in the peripheral and central nervous systems (CNS) [4,5,6]. Mutations in PLA2G6 have recently been identified in many INAD patients, suggesting that iPLA2bplays an essential role in
the CNS and the development of the disorder.
We used homologous recombination to generate iPLA2b-knockout
mice (iPLA2b-/-) [7]. These mice developed severe motor dysfunction
associated with the prominent formation of spheroids with tubulove-sicular membranes remarkably similar to those seen in human INAD [8,9]. Consistent with the recessive nature of INAD, mutagenesis
analysis demonstrated that the catalytic function of the INAD-associated mutated PLA2G6 is impaired [10]. Thus, iPLA2b-/-mouse
is a useful animal model of the pathogenesis of INAD.
The neuroradiological hallmark of INAD is the cerebellar atrophy. Marked cerebellar atrophy is the most characteristic MRI feature of INAD patients [11,12,13,14] and observed in almost all INAD patients with mutations in PLA2G6[3,4,5,6,15,16,17,18], suggesting a neuropathologic role of dysfunctional iPLA2bin the
cerebellar atrophy in the INAD patients. Here, we report that iPLA2b-/-mice develop severe cerebellar atrophy — characterized
by the loss of Purkinje neurons, the activation of glial cells, and the elevation of pro-inflammation cytokines — by the age of 13 months. Our findings provide insight into the pathological mechanisms of cerebellar atrophy in human INAD.
Results
Cerebellar atrophy and Purkinje cell loss in iPLA2b-/-mice Cerebellar ataxia is an early symptom of INAD patients with PLA2G6 mutations [6]. We found that iPLA2b
-/-mice exhibited ataxia and irregular strides by the age of 13 months, and that these conditions became more severe with age (Fig 1A). Furthermore, the cerebella of the iPLA2b-/-mice were noticeably smaller than
that of the age-matched WT littermates (Fig. 1B) and they weighed nearly 25 percent less (Fig 1C). These findings indicated that iPLA2b-/- mice develop cerebellar atrophy by the age of 13
We next analyzed cerebellar sections from the iPLA2b-/-mice to
determine the mechanism of cerebellar atrophy. In agreement with a previous report [8], parasagittal views of nissl-stained mouse cerebella revealed no apparent anatomical differences between the iPLA2b
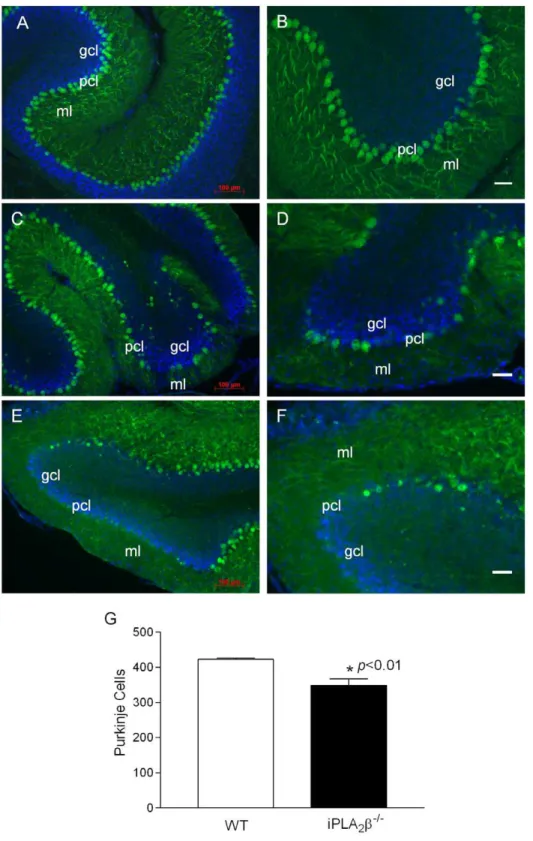
-/-mice and their WT littermates (Figure S1). However, when we examined the expression of calbindin, a widely used immunohistochemical marker of Purkinje neurons in the cerebel-lum [19], we found that, in comparison to the WT controls (Fig. 2A–B), the Purkinje cell layer and the molecular layer in the iPLA2b-/- mice are disrupted (Fig. 2C–F). By stereological
counting of calbindin-positive cells (Figure S2), we found that iPLA2b-/-mice have significantly fewer Purkinje cells that the WT
controls (Fig. 2J). Our data suggest that Purkinje cell loss is a pathologic characteristic of cerebellar atrophy in iPLA2b-/-mice.
Glial cell activation in the cerebella of iPLA2b-/-mice Cerebellar atrophy observed in INAD patients is often associated with cerebellar gliosis, which is characterized by signal hyperintensity in the cerebellar cortex on T2-wighted images of MRI [6]. Since reactive astrogliosis has long been recognized as a ubiquitous feature of CNS pathologies [20], we determined whether reactive astrogliosis occurs in the cerebella of the iPLA2b-/- mice by examining the expression of glial fibrillary
acidic protein (GFAP), of which up-regulation is the best known hallmark of reactive astrogliosis in CNS [20]. We found that, with the exception of the white matter, GFAP levels were very low in the cerebella of the WT mice (Fig. 3A). However, GFAP levels were markedly increased in the molecular and granule cell layers of the cerebella of the iPLA2b-/- mice (Fig. 3B and 3C). In
consistent with the immunostaining, Western blot analysis (Fig 3D) and real time quantitative RT-PCR (Fig. 3E) also showed the significant increase in GFAP expression in the cerebella of the iPLA2b-/- mice. This pronounced increase of GFAP in the
molecular and granule cell layers of the cerebella of the iPLA2b
-/-mice indicate that reactive astrogliosis is a characteristic feature of cerebellar atrophy in iPLA2b-/-mice.
Microglial activation plays a central role in reactive astrogliosis [21]. To determine whether microglial activation also occurs in the cerebella in the iPLA2b-/-mice, we examined the expression of
ionized calcium binding adaptor molecule 1 (Iba-1) – a 17-kDa EF hand protein that is specifically expressed in brain microglia and is up-regulated during their activation [22]. Iba-1 immunostaining revealed ramified microglia with small cellular bodies in the molecular layer and granule cell layer (Fig. 4A, 4C) of the WT cerebella. In contrast, microglia in the molecular layer and granule cell layer of the iPLA2b
-/-cerebella displayed features of activation, including an amoeboid morphology with larger cellular bodies, thick branches (Fig. 4B, 4D), increased cell numbers (Fig. 4F), and up-regulated of Iba-1 expression (Fig. 4E, G) [23].
Elevation of proinflammatory cytokines
Activation of microglia often results in the release of pro-inflammatory cytokines such as TNF-a and IL-1b [24,25]. We found that although the levels of TNF-aand IL-1bin the serum of iPLA2b-/-and WT mice do not differ (Fig. 5A–B), the cerebella of
iPLA2-/- mice expressed significantly higher levels of these
cytokines (Fig. 5C–D) and their mRNA transcripts (Fig. 5E–F). Our findings demonstrate that Purkinje cell degeneration is tightly associated with inflammation in the cerebella of the iPLA2b
-/-mice.
Glial cell activation and TNF-a and IL-1b production without apparent cerebellar atrophy
Cerebellar atrophy in the iPLA2b-/- mice does not become
apparent until the age of 13 months. However, we found that microglia (Fig. 6B) and astrocytes (Fig. 6D) are activated in the cerebella of iPLA2b-/-mice as young as 10 months (Fig. 6A, 6C).
These mice also exhibit significantly increased levels of IL-1b
(Fig. 6E) and TNF-a (Fig. 6F) in their cerebella, which further increase with age. These elevated cytokine levels can be attributed to local protein production, as demonstrated by elevated mRNA levels of IL-1b (Fig. 6G) and TNF-a (Fig. 6H) in the iPLA2b
-/-mice. Since we observed no significantly difference in the Purkinje cell layer between the WT and iPLA2b-/-mice at this age, our
findings suggest that inflammation in the cerebella of iPLA2b
-/-Figure 1. Ataxia and cerebellar atrophy in the iPLA2b-/-mouse.
A. Representative footprint patterns in gait stride tests of WT and iPLA2b-/- mice. B. Representative cerebellum of iPLA2b-/- mouse. C. Cerebella from the iPLA2b-/-mice (13–18 months) and the age-matched WT mice (n = 15/group) were weighted and statistically analyzed.* p,0.0001.
doi:10.1371/journal.pone.0026991.g001
Figure 2. Purkinje cell loss in the iPLA2b-/-mouse.A, B. Representative calbindin staining in the cerebella of the WT mice (18 months). C, D. Representative calbindin staining in the cerebella of the iPLA2b-/-mice (13 months), and E, F. (18 months). G. Purkinje cell counting in WT (n = 6) and
iPLA2b-/-mice (n = 8) at the age of 13–18 months. p,0.01. Blue color, DAPI staining; pcl, Purkinje cell layer; ml, molecular layer; gcl, granule cell layer;
wm, white matter. White scale bar, 50mm.
mice may be one contributing factor leading to Purkinje cell loss and subsequent cerebellar atrophy.
Discussion
In this study, we used a mouse model of INAD [8,9] to investigate potential mechanisms of cerebellar atrophy — a hallmark of INAD patients with PLA2G6 mutations [3,4,5,6,15,16,17,18]. We found that, by the age of 13 months, iPLA2b-/-mice exhibited a loss of Purkinje cells and their dendrites
in the molecular layer of the cerebella. Our results indicate that Purkinje cell loss is a pathologic characteristic of cerebellar atrophy in iPLA2b
-/-mice.
An important finding in our study is that the cerebellar atrophy observed in iPLA2b
-/-mice is associated with reactive astrogliosis, overactivation of microglial cells, and pronounced upregulation of pro-inflammatory cytokines including IL-1b and TNFa — all features of neuroinflammation associated with a vast array of CNS pathologies [26]. Importantly, these features were observed not only in the cerebella of 13-month-old iPLA2b-/- mice with
apparent neurological abnormality, but also in younger mice
prior to the onset of overt disease. Our findings suggest that inflammation may play a pathological role in the development of cerebellar atrophy in INAD.
Microglia typically exist in a resting state characterized by ramified morphology (Fig. 3C) monitoring the brain environment and they are usually the first cells to be activated by pro-inflammatory stimuli, such as lipopolysaccharide (LPS), or in response to neuronal damage [24]. In their activated state, they can serve diverse beneficial functions essential to neuron survival including cellular maintenance, innate immunity, and regulating brain development by enforcing the programmed elimination of neural cells [24]. Indeed, activation of microglia has been reported to promote the death of developing Purkinje cells during brain development [27]. However, under certain circumstances, mi-croglia become overactivated and release excess TNF-a and IL-1b, which further activate astrocytes and spark a perpetuating cycle of neuron death [21].
What could cause the overactivation of microglia in the cerebella of iPLA2b
-/-mice? It is known that the oxidation of mitochondrial phospholipids, particularly cardiolipin, sets cyto-chrome c free and release to trigger apoptosis [28]. Mitochon-Figure 3. Immunofluorescent analyses of GFAP in the cerebella.(A) Representative GFAP/calbindin double-staining in the cerebella of the WT mice at the age of 13–18 months (n = 12). (B, C) GFAP/calbindin double-staining in the cerebella of the iPLA2b-/-mice at the age of 13–18 months
(n = 14). D. Western blot analysis of GFAP in the cerebellum of iPLA2b-/-. E. qRT-PCR analysis of the cerebellar GFAP mRNA (n = 6 each). pcl, Purkinje cell
layer; ml, molecular layer; gcl, granule cell layer; wm, white matter. Scale bar, 50mm.
doi:10.1371/journal.pone.0026991.g003
dria are the primary source of ROS in the CNS [29] and the inner mitochondrial membranes are particularly susceptible to ROS attack because they contain a high proportion of cardiolipin, which is very rich in polyunsaturated fatty acids [30,31]. Accumulating evidence suggests that iPLA2b-mediated
deacylation of phospholipid is a critical step in maintaining optimal mitochondrial membrane composition by participating in cardiolipin remodeling and in repairing of oxidative modifications caused by mitochondrial ROS production [32,33,34,35,36,37,38,39]. When iPLA2b is dysfunctional or
missing, Purkinje cells in the cerebellum may be sensitized to apoptotic induction.
Microglia are phagocytes of myeloid origin that function as the principal immune effectors in the CNS [40]. They work to promptly clear apoptotic neuronal cells and prevent the secondary necrosis and inflammation that can further damage neighboring neural cells [41]. Previous studies suggest iPLA2b can be
irreversibly activated by caspase-3 activation during apoptosis [1,42,43] and this activation produces the chemoattractant lysophosphatidylcholine to recruit professional phagocytes to engulf the apoptotic cells [43]. Effective clearance of apoptotic cells is an important physiologic homeostatic mechanism that is required to prevent secondary necrosis and inflammation [44,45]. In the absence of iPLA2b, apoptotic Purkinje cells may not be
promptly cleared, which can cause overactivation of microglia [24]. These overactive microglia can produce highly neurotoxic factors, including superoxide, TNF-a, and IL-1b, which are likely to perpetuate neuronal death and lead to overt cerebellar atrophy in iPLA2b-/-mice.
In summary, Purkinje cell loss is a pathological characteristic of cerebellar atrophy of the iPLA2b-/-mice. The loss of functional
iPLA2b in vivo may result in the increase in apoptosis and the
decrease in apoptotic cell clearance, which instigate inflammation. The presence of reactive astrogliosis, the activation of microglial Figure 4. Immunofluorescent analyses of Iba-1 in the cerebella.A. Representative Iba-1/calbindin double-staining in the cerebella of the 13– 18 month-old WT mice. B. Representative Iba-1/calbindin double-staining in the cerebella of the iPLA2b-/-mice at the age of 13–18 months. Confocal
microscopy analysis revealed ramified microglia with small cellular bodies and thin branches in the cerebella of the WT (C) and activated microglia with amoeboid morphology, larger cellular bodies, and thick branches in the cerebella of the iPLA2b-/-mice (D). E. Western blot analysis of GFAP in
the cerebellum of iPLA2b-/-. F. Quantitation of microglial cells in the molecular layer of the mouse cerebellum at the age of 13–18 months. G. qRT-PCR
analysis of the cerebellar Iba-1 mRNA (n = 6 each) at the age of 13–18 months. ml, molecular layer; gcl, granule cell layer. Scale bar, 20mm.
cells, and the up-regulation of the proinflammatory cytokines TNF-a and IL-1bin the cerebella of the iPLA2b-/-mice suggest
that inflammation occurs and inflammation-mediated neurotoxic-ity may play a role in the pathogenesis of cerebellar atrophy in INAD. These findings suggest that in vivo microglial imaging by positron emission tomography (PET) may allow the assessment of disease progression [24] and that early intervention with anti-inflammatory therapy may help slow, if not prevent or reverse, the cerebellar atrophy in INAD.
Materials and Methods
Animals
iPLA2b-/- mice (C57/BL6 background) and their wild type
(WT) littermates were obtained by mating heterozygote iPLA2b+
/-mice. Mice were housed in a temperature- and humidity-controlled facility with a 12-hour light/dark cycle with standard chow diet and water ad libitum. All animal care and experimental procedures were approved by the Institutional Animal Care and Use Committee (IACUC) at the Mount Sinai School of Medicine.
Gait stride test
Gait stride test was performed as described previously [46]. Briefly, mice in each group were given three training runs each day for three days, assisted by the home cage on the first day and unassisted on the next two days. On the fourth day (test), the mouse’s paws were coated with ink (red ink on the hindpaws and blue on the forepaws), and paw prints were recorded on two consecutive runs. Records that displayed the clearest prints and the most consistent gait for five consecutive strides were chosen for analysis.
Cerebellar measurements iPLA2b
-/-mice and their age-matched WT littermates (n = 15/ group) were deeply anesthetized by intraperitoneal injection of a mixture of 100 mg/kg of Ketamine and 20 mg/kg of Xylazine. Cerebella were carefully collected and weighted.
Cerebellum preparation and immunohistochemistry Mice were anesthetized by intraperitoneal injection of a mixture of 100 mg/kg of Ketamine and 20 mg/kg of Xylazine and Figure 5. Upregulation of IL-1band TNF-ain the cerebella of the iPLA2b-/-mice.A. Serum IL-1blevels (WT, n = 8; iPLA2b-/-, n = 10). B. Serum
TNF-alevels (WT, n = 8; iPLA2b-/-, n = 10). C. Cerebella IL-1blevels (WT, n = 6; iPLA2b-/-, n = 6). D. Cerebella TNF-alevels (WT, n = 6; iPLA2b-/-, n = 6). E.
Cerebella IL-1bmRNA levels (WT, n = 3; iPLA2b-/-, n = 3). F. Cerebella TNF-amRNA levels (WT, n = 3; iPLA2b-/-, n = 3).
doi:10.1371/journal.pone.0026991.g005
Figure 6. Glial cell activation and elevation of IL-1band TNF-ain the cerebella of the iPLA2b-/-mice before apparent cerebellar atrophy.A. Representative Iba-1 staining in the cerebella of the WT mice (10-month, n = 3) and (B) in the cerebella of the iPLA2b-/-mice (10-month,
n = 6). C. Representative GFAP staining in the cerebella of the WT mice (10-month, n = 3) and (D) in the cerebella of the iPLA2b-/-mice (10-month,
n = 6). Scale bar, 100mm. E. Cerebella IL-1blevels (n = 4 in each group). F. Cerebellar TNF-alevels (n = 4 in each group). G. Cerebella IL-1bmRNA
levels (n = 3 in each group). H. Cerebella TNF-amRNA levels (n = 3 in each group). * vs. the WT, p,0.01;#vs. the 10-month iPLA2b-/-mice, p,0.01.
perfused with 4% paraformaldehyde via puncture of the left ventricle. The cerebella were removed and further fixed in 4% paraformaldehyde at 4uC overnight, and then cryopreserved in 30% sucrose.
The cerebellum was cut into 20mm sections by Leica Cryomicrotome (Wetzlar, Germany) and standard immunostain-ing was performed usimmunostain-ing followimmunostain-ing primary antibodies: rat GFAP ( 1:1000; Invitrogen, Carlsbad, CA), rabbit polyclonal anti-calbindin (1:100; Abcam, Cambridge, MA), and rabbit polyclonal anti-Iba-1 (1:1000; Biocompare, Richmond, VA). Goat anti-rat/ rabbit IgG with the Alexa FluorH dyes (Alexa FluorH 488, Invitrogen, Carlsbad, CA) and DyLightH 594 (red) (Vector Laboratories, Burlingame, CA) were used for the secondary antibodies. The sections were mounted with VECTASHIELDH
Hard SetTM Mounting Medium with DAPI (VECTOR
Labora-tories, Burlingame, CA) and coverslipped. All images were captured by a Zeiss Axioplan 2 microscope and a confocal microscope (Zeiss LSM 510 META).
Purkinje cell and microglia counts
Purkinje cells in the cerebella were analyzed as described previously [47]. Briefly, Purkinje cells were quantified by stereologically counting calbindin positive-cell bodies in 106 images from six entire cerebellar sections of each animal (30mm thick and 180mm apart) were analyzed (control,n= 6; iPLA2b
-/-, n= 8). Microglial cells in the molecular layer of the cerebellum were quantified by counting Iba-1-positive cells.
Western Blot Analysis
Mice were decapitated and cerebella were dissected on ice and quickly immersed in the buffer (20 mM HEPES, pH 7.4/1 mM MgCl2/0.25 mM CaCl2/protease inhibitor
cocktail/PMSF-pep-statin/phosphatase inhibitor/DNase 80 U/ml) and homogenized by Dounce Tissue Homogenizer (Eberbach). Protein was deter-mined by the BCA method (Pierce), and aliquots of protein per sample were separated by SDS-PAGE, transferred to nitrocellu-lose, blotted with corresponding antibodies, and detected by ECL WESTERN blotting detection system (Amersham Biosciences). Anti- GFAP antibody (1:1000, Invitrogen), anti-Iba-1 antibody (1:1000, Biocompare), and anti-actin antibodies (Santa Cruz) were used for protein detection.
Quantitative Real-time RT-PCR analysis
Total RNA was extracted from the cerebella collected from the iPLA2b-/-and age-matched WT mice using an RNeasy Mini Kit.
Primers and probes used in quantitative real-time RT-PCR (qRT-PCR) were designed by PrimerQuestSM(IDT SciTools, Coralville, IA) as follows: GFAP, 59-TCT GAA CCC TCT GAG CAA ATG CCT-39and 59-ATT CAC TAC AAG AGC AGC CGT CCA-39, 56-FAM/TG TGG GCA G/Zen/G CTC TGT GTT TGA TTC A/3IABkFQ; Iba-1, 59-ATG AGC CAA AGC AGG GAT TTG CAG-39and 59-AGT TTG GAC GGC AGA TCC TCA TCA-39, 56-FAM/TT TGG ACT G/Zen/C TGA AGG CCC AGC AGG AA/3IABkFQ; TNF-a, 59-TCTCATGCACCAC CATCAA-GACT-39 and 59-ACCACTCTCCCTTTGCAGAACTCA-39, 56-FAM/AATGGGCTT/Zen/TCCGAATTCA CTGGACC-T/3IABkFQ; IL-1b, 59-AAGGGCTGCTTCC AAACCTTT-GAC-39 and 59-ATACTGCCTGCCTGAAGCTCTTGT-39, 56-FAM/ATC CAGCT T/Zen/CAAATCTCG CAGCAGCA/ 3IABkFQ; GAPDH, 59-TCAACAGCAAC TCCCACTCTT-CCA-39 and 59-ACCCTGTTGCTGTAGCCGTATTCA, 56-FAM/GGCT GGCAT/Zen/TGCTCTCAATGAC AACT/ 3IABkFQ. qRT-PCR was performed using an EXPRESS One-Step SuperScript qRT-PCR Kit from Invitrogen (Carlsbad, CA)
according to the manufacturer’s instructions on7900HT Real-Time PCR Systems (Applied Biosystems, Foster City, CA). The mRNA levels were calculated by comparative CT methods (XTest/
XGAPDH= 2DDCT) with GAPDH as the endogenous reference
gene.
IL-1b and TNF-ameasurements
The levels of cytokines in cerebellum homogenates were measured as described previously with a modification [48]. Briefly, mouse blood was collected before sacrificing. The mice were anesthetized by intraperitoneal injection of a mixture of 100 mg/ kg of Ketamine and 20 mg/kg of Xylazine. Then cerebella were removed, snap frozen in liquid nitrogen, and stored at 280uC until use. Cerebellar samples were placed in sterile PBS containing protease inhibitor cocktail (300ml solution per 10 mg), homoge-nized using Tissuemiser (Fisher Scientific, Pittsburgh, PA), and centrifuged at 11,000 rpm at 4uC for 20 minutes. The superna-tants or blood were aliquoted and cytokine levels were determined with mouse TNF-aand IL-1bELISA Kits (eBioscience, Inc., San Diago, CA). Cytokine levels were normalized with total proteins and expressed as ng/mg proteins.
Statistics
Data were expressed as means6SEM. Significant differences were evaluated by unpaired two-tailed Student’s t test by using PRISM. Significance levels are described in individual figure legends.
Supporting Information
Figure S1 The nissle staining analysis of mouse cere-bellum. Nissle staining was performed according to standard methods. Briefly, the sagittal sections of cerebella from 13-month-old iPLA2b
-/-mice and the age-matched wild type littermates (WT) were mounted on slides, dehydrated and rehydrated in graded ethanols and xylenes, incubated in 1% cresyl violet for 30 sec, decolorized in acetic acid, and then dehydrated and cover-slipped and analyzed by a a Zeiss Axioplan 2 microscope. The parasagittal views of the mouse cerebella of the nissl staining revealed no apparent anatomical differences between the iPLA2b-/- and their wild type littermates with the exception of
the less intensive staining in the granule cell layer of cerebella in iPLA2b-/-mice. ml, molecular layer; gcl, granule cell layer; DCN,
deep cerebellar nucleus. Scale bar, 100mm. (TIF)
Figure S2 The Calbindin staining analysis of mouse cerebellum. The cerebellum was cut into 20mm sections by Leica Cryomicrotome (Wetzlar, Germany) and standard immu-nostaining was performed by rat anti-GFAP ( 1:1000; Invitrogen, Carlsbad, CA), rabbit polyclonal anti-calbindin-2 (1:100; abcam, Cambridge, MA), Goat anti-rat IgG with the Alexa FluorH dyes (Alexa FluorH 488, Invitrogen, Carlsbad, CA) were used for the secondary antibodies. Calbindin staining (green) showed the Purkinje cell lose and degeneration of PC dendrites in iPLA2b
-/-mice cerebella. ml, molecular layer; gcl, granule cell layer; DCN, deep cerebellar nucleus. Scale bar, 100mm.
(TIF)
Author Contributions
Conceived and designed the experiments: ZZ ZAM. Performed the experiments: ZZ JW CZ WB. Analyzed the data: ZZ ZAM. Contributed reagents/materials/analysis tools: ZY. Wrote the paper: ZAM.
References
1. Ma Z, Turk J (2001) The molecular biology of the group VIA Ca2+
-independent phospholipase A2. Prog Nucleic Acid Res Mol Biol 67: 1–33.
2. Ma Z, Wang X, Nowatzke W, Ramanadham S, Turk J (1999) Human pancreatic islets express mRNA species encoding two distinct catalytically active isoforms of group VI phospholipase A2(iPLA2) that arise from an exon-skipping mechanism of alternative splicing of the transcript from the iPLA2gene on chromosome 22q13.1. J Biol Chem 274: 9607–9616.
3. Morgan NV, Westaway SK, Morton JE, Gregory A, Gissen P, et al. (2006) PLA2G6, encoding a phospholipase A2, is mutated in neurodegenerative disorders with high brain iron. Nat Genet 38: 752–754.
4. Gregory A, Westaway SK, Holm IE, Kotzbauer PT, Hogarth P, et al. (2008) Neurodegeneration associated with genetic defects in phospholipase A2. Neurology 71: 1402–1409.
5. Khateeb S, Flusser H, Ofir R, Shelef I, Narkis G, et al. (2006) PLA2G6 mutation underlies infantile neuroaxonal dystrophy. Am J Hum Genet 79: 942–948. 6. Kurian MA, Morgan NV, MacPherson L, Foster K, Peake D, et al. (2008)
Phenotypic spectrum of neurodegeneration associated with mutations in the PLA2G6 gene (PLAN). Neurology 70: 1623–1629.
7. Bao S, Miller DJ, Ma Z, Wohltmann M, Eng G, et al. (2004) Male mice that do not express group VIA phospholipase A2produce spermatozoa with impaired motility and have greatly reduced fertility. J Biol Chem 279: 38194–38200. 8. Malik I, Turk J, Mancuso DJ, Montier L, Wohltmann M, et al. (2008) Disrupted
Membrane Homeostasis and Accumulation of Ubiquitinated Proteins in a Mouse Model of Infantile Neuroaxonal Dystrophy Caused by PLA2G6 Mutations. Am J Pathol 172: 406–416.
9. Shinzawa K, Sumi H, Ikawa M, Matsuoka Y, Okabe M, et al. (2008) Neuroaxonal Dystrophy Caused by Group VIA Phospholipase A2Deficiency in Mice: A Model of Human Neurodegenerative Disease. J Neurosci 28: 2212–2220.
10. Engel LA, Jing Z, O’Brien DE, Sun M, Kotzbauer PT (2010) Catalytic function of PLA2G6 is impaired by mutations associated with infantile neuroaxonal dystrophy but not dystonia-parkinsonism. PLoS One 5: e12897.
11. Barlow JK, Sims KB, Kolodny EH (1989) Early cerebellar degeneration in twins with infantile neuroaxonal dystrophy. Ann Neurol 25: 413–415.
12. Tanabe Y, Iai M, Ishii M, Tamai K, Maemoto T, et al. (1993) The use of magnetic resonance imaging in diagnosing infantile neuroaxonal dystrophy. Neurology 43: 110–113.
13. Farina L, Nardocci N, Bruzzone MG, D’Incerti L, Zorzi G, et al. (1999) Infantile neuroaxonal dystrophy: neuroradiological studies in 11 patients. Neuroradiology 41: 376–380.
14. Nardocci N, Zorzi G, Farina L, Binelli S, Scaioli W, et al. (1999) Infantile neuroaxonal dystrophy: clinical spectrum and diagnostic criteria. Neurology 52: 1472–1478.
15. Biancheri R, Rossi A, Alpigiani G, Filocamo M, Gandolfo C, et al. (2007) Cerebellar atrophy without cerebellar cortex hyperintensity in infantile neuroaxonal dystrophy (INAD) due to PLA2G6 mutation. Eur J Paediatr Neurol 11: 175–177.
16. Carrilho I, Santos M, Guimaraes A, Teixeira J, Chorao R, et al. (2008) Infantile neuroaxonal dystrophy: What’s most important for the diagnosis? Eur J Paediatr Neurol.
17. Wu Y, Jiang Y, Gao Z, Wang J, Yuan Y, et al. (2009) Clinical study and PLA2G6 mutation screening analysis in Chinese patients with infantile neuroaxonal dystrophy. Eur J Neurol 16: 240–245.
18. Tonelli A, Romaniello R, Grasso R, Cavallini A, Righini A, et al. (2010) Novel splice-site mutations and a large intragenic deletion in PLA2G6 associated with a severe and rapidly progressive form of infantile neuroaxonal dystrophy. Clinical Genetics 78: 432–440.
19. Ge Y, Belcher SM, Pierce DR, Light KE (2004) Detection of Purkinje cell loss following drug exposures to developing rat pups using reverse transcriptase-polymerase chain reaction (RT-PCR) analysis for calbindin-D28k mRNA expression. Toxicology Letters 150: 325–334.
20. Sofroniew MV, Vinters HV (2010) Astrocytes: biology and pathology. Acta Neuropathol 119: 7–35.
21. Zhang D, Hu X, Qian L, O’Callaghan J, Hong JS (2010) Astrogliosis in CNS Pathologies: Is There A Role for Microglia? Molecular Neurobiology 41: 232–241.
22. Imai Y, Kohsaka S (2002) Intracellular signaling in M-CSF-induced microglia activation: role of Iba1. Glia 40: 164–174.
23. Ransohoff RM, Perry VH (2009) Microglial physiology: unique stimuli, specialized responses. Annu Rev Immunol 27: 119–145.
24. Block ML, Zecca L, Hong JS (2007) Microglia-mediated neurotoxicity: uncovering the molecular mechanisms. Nat Rev Neurosci 8: 57–69. 25. Glass CK, Saijo K, Winner B, Marchetto MC, Gage FH (2010) Mechanisms
underlying inflammation in neurodegeneration. Cell 140: 918–934.
26. Block ML, Hong JS (2005) Microglia and inflammation-mediated neurodegen-eration: multiple triggers with a common mechanism. Prog Neurobiol 76: 77–98.
27. Marin-Teva JL, Dusart I, Colin C, Gervais A, van Rooijen N, et al. (2004) Microglia promote the death of developing Purkinje cells. Neuron 41: 535–547. 28. Kagan VE, Tyurin VA, Jiang J, Tyurina YY, Ritov VB, et al. (2005) Cytochrome c acts as a cardiolipin oxygenase required for release of proapoptotic factors. Nat Chem Biol 1: 223–232.
29. Trushina E, McMurray CT (2007) Oxidative stress and mitochondrial dysfunction in neurodegenerative diseases. Neuroscience 145: 1233–1248. 30. Orrenius S, Gogvadze V, Zhivotovsky B (2007) Mitochondrial Oxidative Stress:
Implications for Cell Death. Annual Review of Pharmacology and Toxicology 47: 143–183.
31. Pope S, Land JM, Heales SJ (2008) Oxidative stress and mitochondrial dysfunction in neurodegeneration; cardiolipin a critical target? Biochim Biophys Acta 1777: 794–799.
32. Bao S, Song H, Wohltmann M, Ramanadham S, Jin W, et al. (2006) Insulin Secretory Responses and Phospholipid Composition of Pancreatic Islets from Mice That Do Not Express Group VIA Phospholipase A2 and Effects of Metabolic Stress on Glucose Homeostasis. J Biol Chem 281: 20958–20973. 33. Seleznev K, Zhao C, Zhang XH, Song K, Ma ZA (2006) Calcium-independent
Phospholipase A2Localizes in and Protects Mitochondria during Apoptotic Induction by Staurosporine. J Biol Chem 281: 22275–22288.
34. Song K, Zhang X, Zhao C, Ang NT, Ma ZA (2005) Inhibition of Ca2+
-Independent Phospholipase A2Results in Insufficient Insulin Secretion and Impaired Glucose Tolerance. Mol Endocrinol 19: 504–515.
35. Bao S, Jacobson DA, Wohltmann M, Bohrer A, Jin W, et al. (2008) Glucose homeostasis, insulin secretion, and islet phospholipids in mice that overexpress iPLA2beta in pancreatic beta-cells and in iPLA2beta-null mice. Am J Physiol Endocrinol Metab 294: E217–229.
36. Zhao Z, Zhang X, Zhao C, Choi J, Shi J, et al. (2010) Protection of Pancreatic beta-cells by Group VIA Phospholipase A2-Mediated Repair of Mitochondrial Membrane Peroxidation. Endocrinology 151: 3038–3048.
37. Subramanian S, Kalyanaraman B, Migrino RQ (2010) Mitochondrially targeted antioxidants for the treatment of cardiovascular diseases. Recent Pat Cardiovasc Drug Discov 5: 54–65.
38. Zachman DK, Chicco AJ, McCune SA, Murphy RC, Moore RL, et al. (2010) The role of calcium-independent phospholipase A2in cardiolipin remodeling in the spontaneously hypertensive heart failure rat heart. J Lipid Res 51: 525–534. 39. Malhotra A, Edelman-Novemsky I, Xu Y, Plesken H, Ma J, et al. (2009) Role of calcium-independent phospholipase A2in the pathogenesis of Barth syndrome. Proc Natl Acad Sci U S A 106: 2337–2341.
40. Rivest S (2009) Regulation of innate immune responses in the brain. Nat Rev Immunol 9: 429–439.
41. Tanaka T, Ueno M, Yamashita T (2009) Engulfment of axon debris by microglia requires p38 MAPK activity. J Biol Chem 284: 21626–21636. 42. Atsumi GI, Tajima M, Hadano A, Nakatani Y, Murakami M, et al. (1998)
Fas-induced arachidonic acid release is mediated by Ca2+
-independent phospholi-pase A2 but not cytosolic phospholipase A2, which undergoes proteolytic inactivation. J Biol Chem 273: 13870–13877.
43. Lauber K, Bohn E, Krober SM, Xiao YJ, Blumenthal SG, et al. (2003) Apoptotic cells induce migration of phagocytes via caspase-3-mediated release of a lipid attraction signal. Cell 113: 717–730.
44. Lauber K, Blumenthal SG, Waibel M, Wesselborg S (2004) Clearance of apoptotic cells: getting rid of the corpses. Mol Cell 14: 277–287.
45. Michlewska S, McColl A, Rossi AG, Megson IL, Dransfield I (2007) Clearance of dying cells and autoimmunity. Autoimmunity 40: 267–273.
46. Li X, Patel JC, Wang J, Avshalumov MV, Nicholson C, et al. (2010) Enhanced striatal dopamine transmission and motor performance with LRRK2 overex-pression in mice is eliminated by familial Parkinson’s disease mutation G2019S. J Neurosci 30: 1788–1797.
47. MacKenzie-Graham A, Tiwari-Woodruff SK, Sharma G, Aguilar C, Vo KT, et al. (2009) Purkinje cell loss in experimental autoimmune encephalomyelitis. Neuroimage 48: 637–651.