Adductor pollicis muscle thickness as a predictor of handgrip
strength in hemodialysis patients
Authors
Raíssa Antunes Pereira1 Alex Lopes Caetano1 Lilian Cuppari1
Maria Ayako Kamimura1
1 Federal University of São
Paulo/Paulista School of Medicine
Submitted on: 05/22/2012. Approved on: 05/30/2013.
Correspondence to:
Maria Ayako Kamimura. Federal University of São Paulo/ Paulista School of Medicine. Rua Pedro de Toledo, nº 282, Vila Clementino, São Paulo, SP, Brazil. CEP: 04039-000.
E-mail: m.kamimura@uol.com.br
Introduction: Recently, the adductor pollicis muscle thickness (APMT) has been suggested as a new nutri-tional marker in several population.
Objective: In view of the scarce data regarding the use of this marker in CKD patients, we aimed to evaluate APMT and its association with nutritional parameters in patients on hemodialysis. Methods: We evaluated 73 hemodialysis patients (52.3 ± 17 years, without residual renal function). The APMT was assessed in the non vascular access arm by means of skinfold caliper. Body composition (bioelectrical im-pedance), handgrip strength (HGS, dynamometer), nutritional status (subjective global assessment), and laboratory parameters (creatinine, total protein and albumin) were also evaluated. Results: Subjects with APMT values above the median were in greater proportion black/brown, younger and had higher HGS. The APMT correlated positively with HGS, albumin and body cell mass (%), and negatively with age. In the linear regression analysis adjusted for sex, age and length on hemo-dialysis, APMT was independently associated with HGS. Conclusion:
APMT was able to predict HGS in hemodialysis patients, suggesting APMT as a promising nutritional marker in this population.
A
BSTRACTKeywords: kidney failure, chronic; muscle strength dynamometer; nutritional assessment; nutritional status.
I
NTRODUCTIONChronic kidney disease (CKD) is characterized by high incidence and prevalence rates. The latest census produced by the Brazilian Society of Nephrology revealed that approxima-tely 91,000 patients are on dialysis in Brazil, and that 90% of them are on hemodialysis.1 A number of
factors connected to CKD and dialy-sis may contribute to the onset of protein-energy malnutrition (PEM). Among them are conditions related to low food intake, such as anorexia; the presence of symptoms of uremia; use of medication; social and psychological issues; factors related to catabolism resulting from inflammation; secon-dary hyperparathyroidism; metabolic acidosis; and loss of nutrients to the dialysis bath. The high prevalence of PEM in patients on hemodialysis has been established in the literature.2-5
Nutritional assessment is indispensable in the management of hemodialysis pa-tients, as PEM and morbimortality are strongly correlated in this population. Additionally, it may improve patient prognosis.6
In this context, lean body mass is an important marker of the patient’s nutritional status, with well-established associations with the clinical outcomes of hemodialysis patients.5,7-10 The most
frequently used methods to determine lean mass in clinical settings include arm muscle circumference (AMC), arm muscle area (AMA), bioelectrical impe-dance analysis (BIA), and the physical
examination of the Subjective Global Assessment (SGA) tool.11-15 However, given that 73% of the
body’s lean mass is water, these measurements may be affected by water balance disorders of-ten seen in patients on hemodialysis. Therefore, assessment of body lean mass stands as one of the most significant challenges for health care workers in this area.
Hand grip strength has been recently recognized as a good marker for muscle mass in CKD patients.16,17 One of the main advantages of this
marker is that it is not affected by the hydration status of the patient. The correlation between grip strength, reduced appetite,18 and death19 has
be-en established for patibe-ents on dialysis. Recbe-ently, adductor pollicis muscle thickness (APMT) has been suggested as a promising marker of muscle mass for some clinical conditions.20-23 The
adduc-tor pollicis muscle is the only muscle that allows direct thickness assessment as it is anatomically well defined and flat in shape.24 Population studies
have described the use of the APMT in muscle function tests.25-28 However, few have looked into
it as a marker of nutritional status.
Given the promising role the APMT may have as a nutritional marker and the few studies considering this potential marker on populations with CKD, this study aimed to test the APMT as a nutritional marker for patients on hemodialysis.
M
ETHODSThis cross-sectional study included 73 patients on hemodialysis treated at the Oswaldo Ramos Foundation (FOR) at the Paulista School of Medicine of the Federal University of São Paulo between July and November of 2011. Patients on hemodialysis for three months or longer and aged 18 or older were invited to join the study. The following exclusion criteria were adopted: presence of residual renal function (urinary output > 200 mL), amputation of lower or upper limbs, or presence of conditions that precluded APMT measurement.
The study protocol was approved by the Research Ethics Committee of the Federal University of São Paulo. All enrolled patients signed an informed consent term.
In addition to hand grip strength and APMT, the following variables were considered: SGA, BIA, lab workup results, and anthropometric parameters such as the body mass index - BMI (kg/m2), brachial circumference (BC),
tricipital skinfold thickness (TST), arm muscle circumference (AMC) and arm muscle area (AMA). All measurements were made by two trained nutritionists after the patients had under-gone hemodialysis (any session of the week); arm measurements were made on the arm opposite to the vascular access.
SUBJECTIVEGLOBALASSESSMENT
SGA was based on the assessment of patient clinical history and physical examination findings.15
Clinical history covered the evaluation of body weight variation, food intake, gastrointestinal symptoms, and the patient’s physical condition. Physical examination was used to subjectively assess subcutaneous fat reserves and muscle mass in specific sites. Each of the categories was given scores from one to seven, with higher scores attri-buted to better nutritional statuses. In the end, pa-tients were categorized as severely malnourished (scores from one to two), mildly to moderately malnourished (scored from three to five), or normally nourished (scores from six to seven).29
BIOELECTRICALIMPEDANCEANALYSIS
Resistance, reactance, and phase angle values were derived from BIA. Software program Fluids was used to estimate lean mass and body cell mass.
HANDGRIPSTRENGTH
A dynamometer (Baseline®) was used to assess
the hand grip strength of the upper limbs without vascular access in patients fitted with arteriovenous fistulae or of the dominant upper limbs in patients given catheters. Patients were seated with one arm up forming an angle of 90º degrees with the forearm. Measurements were repeated three times and the highest strength reading was chosen. Hand grip strength was not considered for patients affected by tendinitis or other hand conditions that could limit their performance in the test.
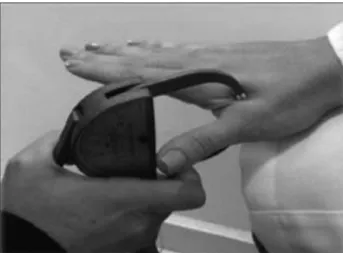
ADDUCTOR POLLICISMUSCLETHICKNESS (APMT) APMT measurements were made with patients in a seated position. Subjects were asked to keep their arms bent at an angle of approximately 90º degrees in relation to the forearm, with the arm sat on the thigh and the hand on the knee. Patients were advised to leave their hands loose and thumbs away from the other fingers to form an angle of 90º degrees in relation to the index finger (Figure 1). A skinfold caliper set at a constant pres-sure of 10 g/mm2 was used to pinch the muscle in
the center of an imaginary triangle formed by the patient’s index finger and thumb. The mean value of three measurements performed in the same day was considered for further analysis.
LABWORKUP
Routine lab workup (blood urea, creatinine, and albumin) was carried out on the day of the first hemodialysis session of the week with patients in a fasting regimen. Tests were processed at the Kidney and Hypertension Hospital Laboratory - Oswaldo Ramos Foundation/Federal University of São Paulo (UNIFESP/EPM).
Protein intake was estimated through the protein equivalent of total nitrogen appearance (PNA), as recommended by the K/DOQI.30
Dialysis adequacy was calculated based on Kt/V.
STATISTICALANALYSIS
Results were expressed in the form of mean values and standard deviations, medians and interquartile ranges, or ratios. Comparisons between independent samples used Student’s t-test for continuous variables following a normal distribution, and the Chi-square test for catego-rical variables. Pearson's correlation coefficient was used to test possible correlations between variables. Linear regression was used to test the independent correlation between APMT and hand grip strength. Statistical significance was attributed to events with p < 0.05. Statistical analysis was performed on software SPSS (Statistical Package Social Sciences) version 18.0 for Windows (Illinois, MA, USA).
R
ESULTSSeventy-three patients, 57.5% males, with a mean age of 52.3 ± 17 years were included in the study. Table 1 shows demographic, clinical, and nutritional data of the studied population separa-ted by gender. Adequacy values for AMC, AMA, resistance, and Kt/V were higher in females. Males had significantly higher values for cell mass (%), hand grip strength, and serum creatinine. APMT and malnutrition status as assessed in the SGA were not significantly different when genders were compared.
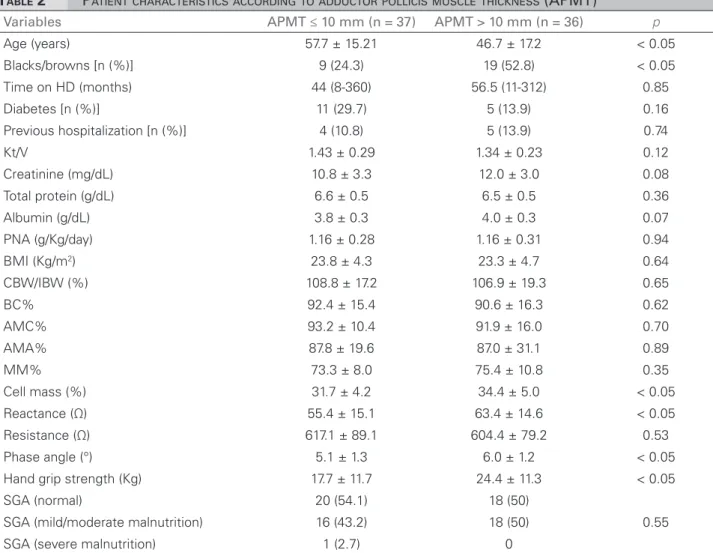
Table 2 describes the characteristics of patients above and below median APMT (10 mm). Individuals with greater APMT were mostly black or brown, younger, and had higher hand grip streng-th scores. SGA-based malnutrition n were not statis-tically different when both groups were compared.
APMT was positively correlated with hand grip strength (Figure 2), serum albumin, cell mass (%), reactance, phase angle, and negatively correlated with age (Table 3). No correlation was found between APMT and serum creatinine, SGA, and traditional anthropometric parameters. Linear regression adjusted for gender, age and time on hemodialysis indicated that APMT was a predictor for hand grip strength (Table 4).
D
ISCUSSIONAPMT was identified as a predictor for hand grip strength in the hemodialysis patients enrolled in this study regardless of age, gender, and time on dialysis. The correlation between APMT and hand grip strength had been described for non-healthy individuals,20,31 but not for patients with CKD.
APMT has been recently considered as a nutritional parameter for both healthy and non-healthy individuals with other diseases. Lameu et al.24 and Gonzalez et al.23 found greater
APMT values in healthy subjects aged between 30 and 65 years. In this study, APMT values below the median were seen in older patients; APMT was inversely correlated with age. Authors in general have reported good correlations between APMT and traditional anthropometric parameters such as BC, AMC, TST, and BMI.20-22 However, in
our study the APMT was not correlated with any of these parameters. This may have occurred for a number of reasons. First, even though an-thropometric values have well-defined standard values, water balance disorders frequently seen in patients on hemodialysis may compromise
TABLE 1 DEMOGRAPHIC, CLINICAL, ANDNUTRITIONALCHARACTERISTICSOFHEMODIALYSISPATIENTS
HD: hemodialysis; BMI: body mass index; CW/IW%: percent ratio current body weight vs. ideal body weight; BC%: brachial circumference percent adequacy; AMC%: arm muscle circumference percent adequacy; AMA%: arm muscle area percent adequacy; MM%: muscle mass percentage; PNA: protein equivalent of total nitrogen appearance; SGA: subjective global assessment. Continuous variables were expressed in the form of mean values and standard deviations or medians and extremes.
Variables Total (n = 73) Males (n = 42) Females (n = 31) p
Age (years) 52.3 ± 17.0 53.3 ± 16.3 50.9 ± 18.1 0.56 Blacks/browns [n (%)] 28 (38.4) 17 (40.5) 11 (35.5) 0.81 Time on HD (months) 56 (28-110.6) 56 (32.2-100.2) 56 (23-121) 0.70 Diabetes [n (%)] 15 (21.9) 12 (28.6) 4 (12.9) 0.15 Previous hospitalization [n (%)] 9 (12,3) 4 (9,5) 5 (16.1) 0.48 Kt/V 1.39 ± 0.27 1.30 ± 0.26 1.51 ± 0.23 < 0.05 Creatinine (mg/dL) 11.4 ± 3.2 12.2 ± 3.2 10.4 ± 3.0 < 0.05 Total protein (g/dL) 6.5 ± 0.5 6.5 ± 0.5 6.6 ± 0.6 0.90 Albumin (g/dL) 3.8 ± 0.3 3.9 ± 0.3 3.8 ± 0.3 0.25 PNA (g/Kg/day) 1.16 ± 0.30 1.19 ± 0.32 1.13 ± 0.26 0.33 BMI (Kg/m2) 23.5 ± 4.5 24.2 ± 4.7 22.6 ± 3.9 0.22
CBW/IBW (%) 107.9 ± 18.2 112.3 ± 19.2 101.8 ± 15.0 0.30 BC% 91.5 ± 15.8 90.9 ± 15.7 92.4 ± 16.1 0.68 AMC% 92.6 ± 13.4 88.8 ± 11.2 97.7 ± 14.5 < 0.05 AMA% 87.4 ± 25.7 80.0 ± 20.3 97.4 ± 29.1 < 0.05 MM% 74.4 ± 9.5 78.6 ± 7.4 68.4 ± 9.0 < 0.05 Cell mass (%) 33.1 ± 4.8 35.3 ± 4.1 30.0 ± 4.0 < 0.05 Reactance (Ω) 59.4 ± 15.31 57.7 ± 13.4 61.7 ± 17.6 0.28 Resistance (Ω) 610.7 ± 84.0 580.2 ± 69.4 653.5 ± 85.0 < 0.05 Phase angle (°) 5.5 ± 1.3 5.7 ± 1.2 5.4 ± 1.4 0.29 Hand grip strength (Kg) 21.0 ± 11.9 25.3 ± 11.6 15.2 ± 9.8 < 0.05 APMT (mm) 10.0 ± 4.5 10.8 ± 4.9 9.0 ± 3.7 0.08 SGA (normal) 38 (51.4) 21 (50) 17 (54.8)
0.43 SGA (mild/moderate malnutrition) 34 (45.9) 21 (50) 13 (41.9)
the measurements and the interpretation of such findings in this population.32 Additionally, there
is substantial error in the reproducibility of anthropometric measurements. Studies have shown that skinfold thickness measurement inter-rater variability may be as high as 22.6%.33
In arm circumference measurements, inter-rater
variability has been reported to be of approxima-tely 4.7%.34
APMT and SGA correlation was reported in a study carried out on a population of critical patients.22 Such correlation was not observed in
this study. However, it is important to mention that the prevalence of malnutrition as categorized by the SGA and reported by these authors differed significantly from what we found in our study (75.8% vs. 47.3%). This disparity, along with the demographic and clinical differences between the studied populations and the size of the sample, may have weakened the correlation between APMT and SGA.
The authors of a recent study on hemodialysis patients found positive correlations between APMT and BMI, BC, AMC, creatinine levels, al-bumin levels, cell mass (%), and phase angle, and
Figure 2. Correlation between adductor pollicis muscle thickness and hand grip strength.
TABLE 2 PATIENTCHARACTERISTICSACCORDINGTOADDUCTORPOLLICISMUSCLETHICKNESS (APMT)
HD: Hemodialysis; BMI: Body mass index; CW/IW%: percent ratio current body weight vs. ideal body weight; BC%: brachial circumference percent adequacy; AMC%: arm muscle circumference percent adequacy; AMA%: arm muscle area percent adequacy; MM%: muscle mass percentage; PNA: Protein equivalent of total nitrogen appearance; SGA: subjective global assessment. Continuous variables were expressed in the form of mean values and standard deviations or medians and extremes.
Variables APMT ≤ 10 mm (n = 37) APMT > 10 mm (n = 36) p
Age (years) 57.7 ± 15.21 46.7 ± 17.2 < 0.05 Blacks/browns [n (%)] 9 (24.3) 19 (52.8) < 0.05 Time on HD (months) 44 (8-360) 56.5 (11-312) 0.85 Diabetes [n (%)] 11 (29.7) 5 (13.9) 0.16 Previous hospitalization [n (%)] 4 (10.8) 5 (13.9) 0.74 Kt/V 1.43 ± 0.29 1.34 ± 0.23 0.12 Creatinine (mg/dL) 10.8 ± 3.3 12.0 ± 3.0 0.08 Total protein (g/dL) 6.6 ± 0.5 6.5 ± 0.5 0.36 Albumin (g/dL) 3.8 ± 0.3 4.0 ± 0.3 0.07 PNA (g/Kg/day) 1.16 ± 0.28 1.16 ± 0.31 0.94 BMI (Kg/m2) 23.8 ± 4.3 23.3 ± 4.7 0.64
CBW/IBW (%) 108.8 ± 17.2 106.9 ± 19.3 0.65 BC% 92.4 ± 15.4 90.6 ± 16.3 0.62 AMC% 93.2 ± 10.4 91.9 ± 16.0 0.70 AMA% 87.8 ± 19.6 87.0 ± 31.1 0.89 MM% 73.3 ± 8.0 75.4 ± 10.8 0.35 Cell mass (%) 31.7 ± 4.2 34.4 ± 5.0 < 0.05 Reactance (Ω) 55.4 ± 15.1 63.4 ± 14.6 < 0.05 Resistance (Ω) 617.1 ± 89.1 604.4 ± 79.2 0.53 Phase angle (°) 5.1 ± 1.3 6.0 ± 1.2 < 0.05 Hand grip strength (Kg) 17.7 ± 11.7 24.4 ± 11.3 < 0.05 SGA (normal) 20 (54.1) 18 (50)
0.55 SGA (mild/moderate malnutrition) 16 (43.2) 18 (50)
a negative correlation with resistance.35 Positive
correlations between APMT and albumin levels, phase angle, and cell mass (%) and a negative correlation between APMT and resistance were described in this study. None of these studies found correlations between APMT and lean mass as assessed in BIA. In patients without CKD, the correlation between APMT and BIA muscle mass was described by Oliveira & Frangella (r = 0.5315).20 BIA is known to be a practical
method used to assess body composition, and the
fact that it estimates the amount of body water, in addition to lean mass and fat, has favored its use among nephrologists.36 Nonetheless,
over or underestimation of lean mass due to water balance disorders, particularly in dialysis patients, and the lack of formulae to predict lean mass of this specific population, are the main limitations affecting BIA. Therefore, BIA-derived parameters that eliminate mathematical error such as reactance, cell mass, and phase angle have attracted more attention.13 There is evidence that
reactance and phase angle may be used to predict risk of hospitalization and death for dialysis pa-tients.37,38 The authors of this study and Oliveira et al.35 found strong correlations between these
parameters and APMT.
Muscle mass reduction is seen as the most important parameter to detect PEM.39 Muscle
func-tion has been given significant attenfunc-tion in nutri-tional assessment, not only due to the impact mal-nutrition produces upon it, but mainly for its use as a predictor of change in body composition.25,40
In this sense, methods that take muscle function in-to account have become useful in-tools in the clinical management of patients with CKD.17,25,40
Hand grip strength measured with a dynamometer is an established method to assess the muscle function of patients with CKD.10,16,17,19,41 Hand grip strength tests are
con-sidered to be practical, objective, affordable, and non-invasive. Additionally, these tests are not impacted by water balance disorders common-ly seen in populations on diacommon-lysis. Studies have described a good correlation between hand grip strength and body composition parameters asses-sed through dual-energy X-ray absorptiometry (DEXA)16 and SGA.10 Several authors have
al-so indicated that hand grip strength is a good predictor for morbidity and mortality in various populations. Leal et al.17 studied patients on
he-modialysis and found that 55.8% of the individu-als had reduced muscle function; female patients had hand grip strength values below the 10th percentile and lower values for BC, AMC, and AMA (against healthy adults for gender and age from Rio de Janeiro). As previously mentioned, the correlation between hand grip strength and APMT was observed in studies carried out with
TABLE 3 CORRELATIONSBETWEENADDUCTORPOLLICIS
MUSCLETHICKNESS (APMT) ANDSTUDIED
VARIABLES
HD: Hemodialysis; BMI: Body mass index; CW/IW%: Percent ratio current body weight vs. ideal body weight; BC%: brachial circumference percent adequacy; AMC%: Arm muscle circumference percent adequacy; AMA%: arm muscle area percent adequacy; MM%: muscle mass percentage; PNA: Protein equivalent of total nitrogen appearance; SGA: Subjective global assessment.
Variables r p
Age (years) -0.321 < 0.05 Time on HD (months) 0.039 0.74 Kt/V -0.228 0.05 Creatinine (mg/dL) 0.195 0.10 Total protein (g/dL) -0.070 0.56 Albumin (g/dL) 0.273 < 0.05 PNA (g/Kg/day) -0.066 0.58 BMI (Kg/m2) -0.106 0.37
CBW/IBW (%) -0.110 0.35 BC% -0.065 0.58 AMC% -0.078 0.51 AMA% -0.063 0.59
MM% 0.207 0.08
Cell mass (%) 0.403 < 0.05 Reactance (Ω) 0.271 < 0.05 Resistance (Ω) -0.152 0.20 Phase angle (°) 0.383 < 0.05 Hand grip strength (Kg) 0.400 < 0.05 SGA (1-7) -0.017 0.89
TABLE 4 ANÁLISEDEREGRESSÃOLINEARUTILIZANDO
FORÇADEPREENSÃOMANUALCOMOVARIÁVEL
DEPENDENTE (R2 = 0.20)
Variables Coefficient 95% CI p
subjects submitted to surgery (r = 0.46; p < 0.001) and stroke patients (r = 0.56; p = 0.0024).20,31 This
study is the only up to this moment to assess this correlation in dialysis patients.
Recently, Bragagnolo et al.31 observed a
correlation between APMT and higher risk of death and postoperative complications in patients submitted to gastrointestinal surgery. APMT was used in patients scheduled to undergo heart surgery to predict clinical outcomes such as sepsis, length of hospitalization, and death.42 A recent
study showed that APMT was correlated with higher risk of hospitalization in the six-month follow-up of patients on dialysis.35
APMT limitations include the lack of reference values. Additionally, the inter-rater and test-retest reproducibility of APMT measurements has not been evaluated, which further reinforces the importance of having trained personnel perform measurements.
To sum up with, APMT served as a good predictor for hand grip strength in hemodialysis patients, and appears to be a promising marker for patient nutritional status. However, more studies are required to consolidate the role of APMT as a nutritional status marker for CKD patients and substantiate its role as a predictor of morbidity and mortality in this population.
R
EFERENCES1. Sociedade Brasileira de Nefrologia. Censo de diálise [Acesso 10 de junho de 2013]. Available from: URL: http://www.sbn.org. br/index.php DOI: http://dx.doi.org/10.5935/abc.2013s002 2. Dwyer JT, Larive B, Leung J, Rocco M, Burrowes JD,
Chu-mlea WC, et al. Nutritional status affects quality of life in Hemodialysis (HEMO) Study patients at baseline. J Ren Nutr 2002;12:213-23.
3. Kopple JD. McCollum Award Lecture, 1996: protein-energy malnutrition in maintenance dialysis patients. Am J Clin Nutr 1997;65:1544-57. PMID: 9129491
4. Marreiro DN, Lemos JO, Moura JF. Estado nutricional de pacientes renais crônicos em hemodiálise. Rev Bras Nutr Clin 2007;22:189-93.
5. Araújo IC, Kamimura MA, Draibe SA, Canziani ME, Manfredi SR, Avesani CM, et al. Nutritional parameters and mortality in inci-dent hemodialysis patients. J Ren Nutr 2006;16:27-35.
6. Merhi VA, de Oliveira MR, Caran AL, Tristão TM, Ambo RM, Tanner MA, et al. Hospitalization period and nutritional status in hospitalized patients. Nutr Hosp 2007;22:590-5.
7. Rambod M, Kovesdy CP, Bross R, Kopple JD, Kalantar-Zadeh K. Association of serum prealbumin and its changes over time with clinical outcomes and survival in patients receiving hemo-dialysis. Am J Clin Nutr 2008;88:1485-94.
8. Beddhu S, Pappas LM, Ramkumar N, Samore M. Effects of body size and body composition on survival in hemodialysis patients. J Am Soc Nephrol 2003;14:2366-72.
9. Beddhu S. If fat is good, muscle is better. Am J Kidney Dis 2006;47:193; author reply -4.
10. Carrero JJ, Chmielewski M, Axelsson J, Snaedal S, Heimbürger O, Bárány P, et al. Muscle atrophy, inflammation and clinical ou-tcome in incident and prevalent dialysis patients. Clin Nutr 2008;27:557-64.
11. Donadio C, Halim AB, Caprio F, Grassi G, Khedr B, Mazzantini M. Single- and multi-frequency bioelectrical impedance analyses to analyse body composition in maintenance haemodialysis pa-tients: comparison with dual-energy x-ray absorptiometry. Phy-siol Meas 2008;29:S517-24.
12. Bross R, Chandramohan G, Kovesdy CP, Oreopoulos A, Noori N, Golden S, et al. Comparing body composition assessment tests in long-term hemodialysis patients. Am J Kidney Dis 2010;55:885-96. PMID: 20346558
13. Oliveira CM, Kubrusly M, Mota RS, Silva CA, Choukroun G, Oliveira VN. The phase angle and mass body cell as markers of nutritional status in hemodialysis patients. J Ren Nutr 2010;20:314-20.
14. Chertow GM, Lowrie EG, Wilmore DW, Gonzalez J, Lew NL, Ling J, et al. Nutritional assessment with bioelectrical impe-dance analysis in maintenance hemodialysis patients. J Am Soc Nephrol 1995;6:75-81.
15. Detsky AS, McLaughlin JR, Baker JP, Johnston N, Whittaker S, Mendelson RA, et al. What is subjective global assessment of nutritional status? JPEN J Parenter Enteral Nutr 1987;11:8-13. PMID: 3820522
16. Leal VO, Mafra D, Fouque D, Anjos LA. Use of handgrip strength in the assessment of the muscle function of chronic kidney disease patients on dialysis: a systematic review. Ne-phrol Dial Transplant 2011;26:1354-60.
17. Leal VO, Stockler-Pinto MB, Farage NE, Aranha LN, Fouque D, Anjos LA, et al. Handgrip strength and its dialysis determinants in hemodialysis patients. Nutrition 2011;27:1125-9.
18. Carrero JJ, Qureshi AR, Axelsson J, Avesani CM, Suliman ME, Kato S, Bárány P, et al. Comparison of nutritional and inflam-matory markers in dialysis patients with reduced appetite. Am J Clin Nutr 2007;85:695-701.
19. Wang AY, Sea MM, Ho ZS, Lui SF, Li PK, Woo J. Evalua-tion of handgrip strength as a nutriEvalua-tional marker and prog-nostic indicator in peritoneal dialysis patients. Am J Clin Nutr 2005;81:79-86. PMID: 15640464
20. Oliveira DR, Frangella VS. Adductor pollicis muscle and hand grip strength: potential methods of nutritional assessment in outpatients with stroke. Einstein 2010;8:467-72.
21. Bragagnolo R, Caporossi FS, Dock-Nascimento DB, de Agui-lar-Nascimento JE. Adductor pollicis muscle thickness: a fast and reliable method for nutritional assessment in surgical pa-tients. Rev Col Bras Cir 2009;36:371-6. PMID: 20069147 22. Caporossi FS, Bragagnolo R, Dock-Nascimento DB,
Aguilar-Nascimento JE. Thickness of the adductor pollicis muscle as an anthropometric parameter in critically ill patients. Rev Bras Nutr Clin 2010;25:182-8.
23. Gonzalez MC, Duarte RR, Budziareck MB. Adductor pollicis muscle: reference values of its thickness in a healthy popula-tion. Clin Nutr 2010;29:268-71.
24. Lameu EB, Gerude MF, Corrêa RC, Lima KA. Adductor polli-cis muscle: a new anthropometric parameter. Rev Hosp Clin Fac Med São Paulo 2004;59:57-62.
25. Russell DM, Prendergast PJ, Darby PL, Garfinkel PE, Whitwell J, Jeejeebhoy KN. A comparison between muscle function and body composition in anorexia nervosa: the effect of refeeding. Am J Clin Nutr 1983;38:229-37. PMID: 6881081
26. Ditor DS, Hicks AL. The effect of age and gender on the rela-tive fatigability of the human adductor pollicis muscle. Can J Physiol Pharmacol 2000;78:781-90.
28. Shizgal HM, Vasilevsky CA, Gardiner PF, Wang WZ, Tuitt DA, Brabant GV. Nutritional assessment and skeletal muscle func-tion. Am J Clin Nutr 1986;44:761-71.
29. Adequacy of dialysis and nutrition in continuous peritoneal dialysis: association with clinical outcomes. Canada-USA (CANUSA) Peritoneal Dialysis Study Group. J Am Soc Nephrol 1996;7:198-207.
30. Kopple JD. National kidney foundation K/DOQI clinical prac-tice guidelines for nutrition in chronic renal failure. Am J Kid-ney Dis 2001;37:S66-70. PMID: 11158865
31. Bragagnolo R, Caporossi FS, Dock-Nascimento DB, Aguilar--Nascimento JE. Handgrip strength and adductor pollicis mus-cle thickness as predictors of postoperative complications after major operations of the gastrointestinal tract. E Spen Eur E J Clin Nutr Metab 2011;6:e21-e26.
32. Kamimura MA, Avesani CM, Cendoroglo M, Canziani ME, Draibe SA, Cuppari L. Comparison of skinfold thicknesses and bioelectrical impedance analysis with dual-energy X-ray absorptiometry for the assessment of body fat in patients on long-term haemodialysis therapy. Nephrol Dial Transplant 2003;18:101-5.
33. Lohman TG, Pollock ML, Slaughter MH, Brandon LJ, Boileau RA. Methodological factors and the prediction of body fat in female athletes. Med Sci Sports Exerc 1984;16:92-6. PMID: 6708788 34. Hall JC, O'Quigley J, Giles GR, Appleton N, Stocks H. Upper
limb anthropometry: the value of measurement variance stu-dies. Am J Clin Nutr 1980;33:1846-51.
35. de Oliveira CM, Kubrusly M, Mota RS, Choukroun G, Neto JB, da Silva CA. Adductor pollicis muscle thickness: a promising anthropometric parameter for patients with chronic renal failu-re. J Ren Nutr 2012;22:307-16.
36. Cuppari L, Kamimura MA. Avaliação nutricional na doen-ça renal crônica: desafios na prática clínica. J Bras Nefrol 2009;31:21-7.
37. Maggiore Q, Nigrelli S, Ciccarelli C, Grimaldi C, Rossi GA, Michelassi C. Nutritional and prognostic correlates of bio-impedance indexes in hemodialysis patients. Kidney Int 1996;50:2103-8. PMID: 8943496
38. Pupim LB, Kent P, Ikizler TA. Bioelectrical impedance analysis in dialysis patients. Miner Electrolyte Metab 1999;25:400-6. 39. Axelsson J, Qureshi AR, Divino-Filho JC, Bárány P, Heimbürger O,
Lindholm B, et al. Are insulin-like growth factor and its binding proteins 1 and 3 clinically useful as markers of malnutrition, sarcopenia and inflammation in end-stage renal disease? Eur J Clin Nutr 2006;60:718-26. PMID: 16391585
40. Lopes J, Russell DM, Whitwell J, Jeejeebhoy KN. Skeletal mus-cle function in malnutrition. Am J Clin Nutr 1982;36:602-10. PMID: 6812409
41. Silva LF, Matos CM, Lopes GB, Martins MT, Martins MS, Arias LU, et al. Handgrip strength as a simple indicator of possible malnutrition and inflammation in men and women on maintenance hemodialysis. J Ren Nutr 2011;21:235-45. 42. Andrade PV, Lameu EB. Espessura do músculo adutor do