... .,.-FUNDAÇÃO ... GETULIO VARGAS EPGE
Escola de Pós-Graduação em Economia
SEMINÁRIOS
DE PESQUISA
ECONÔMICA
"Dynamics of Micro-Entrepeneurial
Activities"
Prof. Marcelo Nery (IPEA-UFF)
LOCAL
Fundação Getulio Vargas
Praia de Botafogo, 190 - 10° andar - Auditório
DATA
29/04/99 (Y feira)
HORr\RIO
16:00h
-DYNAMICS OF SELF -EMPLOYMENT ACTIVITIES
1Marcelo Neri - Ipea
mClleri(âlipea, gov, brABSTRACT
This paper generates and organizes stylized facts related to the dynamics of self-employment activities in Brazil. The final purpose is to help the design of policies to assist micro-entrepreneurial units. The 'first part of the paper uses as a main tool of analysis transitional data constructed from household surveys. The longitudinal information used covers three transition horizons: 1-month, 12-month and 5-year periods. Quantitative flows analysis assesses the main origins, destinies and various types of risks assumed by micro-entrepreneurial activities. Complementarily, logistic regressions provides evidence on the main characteristics and resources of micro-entrepreneurial units. In particular, we use the movements from self-employment to employer activities as measures of entrepreneurial success. We also use these transitions as measures of employment creation intensity within the self-employed segment.
The second part of the paper explores various data sources. First, we attempt to analyze the life-cycle trajectories and determinants of self-employment. We use cohort data constructed from PME and qualitative data on financial and work history factors related to the opening of small bussiness from the informal firms survey implemented during 1994. Second, we apply a standart Mincerian wage equation approach to self-employment profits. This exerci se attempts to capture the correlation patterns between micro-entrepreneurial performance and a variety of firms leveI variables present in the 1994 Informal Survey. Finally, we use a a survey on the poor enterpreneurs of Rocinha favela as a laboratory to study poor entrepreneurs resources and behavior.
In sum, the main questions pursued in the paper are: i) who are the Brazilian self-employed?; ii) in particular: what is relative importance among the self-employed of subsistence activities versus those activities with growth and capital accumulation potential?;
iii) what are the main static and dynamic determinants ofmicro-entrepreneurial success?; iv) what is the degree ofrisk associated with micro-entrepreneurial activities in Brazil?; v) What is the life-cycle profile of self-employment?; vi) what are the main constraints on poor entrepreneurs activities?
..
•
W·
"'.
OUTLINE
1. Dynamics of Micro-entrepreneurial activities in Brazil
The Life-Cycle Profile of Self-Employment: Cohort Analysis
Probability Transition Matrices between Working Classes
2. Origins and Destinies ofthe Self-Employed across Different Horizons
3. Analysis of Micro-Entrepreneurial Risk
Duration Dependence and Occupational Risk
Micro-entrepreneurs and the Probability of Exiting Unemployment
Occupational Risk and Age
Self-Employed Income Risk
4. Qualitative transitional analysis: Self-employed and Employers
Profile of flows: Stayers versus Migrants
5. Resources and Entrepreneurial Success
Logistic Regressions
Mincerian Profit Equations
6. Micro-enterpreneurs: Resources, Behavior and Policies
Poor Entrepreneurs From Rocinha Favela
Lessons for Microcredit Policies
Appendices:
A: The Longitudinal Aspect of PME
B: Dynamic ProfIles
C: Logistic Regressions
D: Profit Equations for Micro-Entrepreneurial Activities
E: The Life Cycle Behavior of Self-employment
..
,,-.,
EXECUTIVE SUMMARY
According to recent opinion polls, the main policy to fight unemployment in Brazil is 'to support micro and small enterprises'. Complementarily, standard poverty profiles demonstrate that no other head of household working class has a higher contribution to poverty in Brazil than self-employment (including inactive states). However, little is known about how Brazilian poor and non poor micro-entrepreneurs behave and what are their main productive needs.
This paper attempts to generate and organize stylized facts of self-employment and employer activities in Brazil. Our main tool of analysis is transitional data constructed from household surveys. The final purpose is to help the design of policies to assist micro-entrepreneurial activities (e.g.; productive credit, technical assistance, marketing support and cooperatives building.). These policies can be used either as means of enhancing micro-enterprises competitiveness, increasing the employment generation potential in this segment or, more specifically, as a poverty alleviation device.
Analysis of Micro-Entrepreneurial Risk
The analysis of entrepreneurial risk can be usefuI in the design of a series of policies designed to assist micro-entrepreneurs (e.g., micro-credit arrangements and compensatory schemes for the unemployed).
Occupational Risk across Working Classes
SeIf-empIoyed and employers are in an intermediary position in terms of occupational risk with monthly probabilities equal to 24% and 23%, respectively. This result indicates that the occupational risk of these activities tend to be higher than the one observed for formal employees (11%) but smaller those observed for informal empIoyees (47%) and the unemployed (58%).
Occupational Risk across DifTerent Borizons
We evaluate how changes in the period of measuring labor market flows affect the risks assumed by different occupational groups. PME rotating panel scheme and retrospective questions allows to capture labor market dynamics operating at three different frequencies (monthly, yearIy and 5 year periods). In general, we observe an increase in ex-post risk measures when we move from monthly to five year windows of measurement in alI working classes analyzed. For example, as we increase the window of measuement from 1 month to one year the risk of exiting self-employement (employer) status increases from 28% (26%) to 43% (400/0). The self-employed is the only working class that present a risk reduction when we move from annuaI (43%) to the five year windows (37%) of measurement. This counter-intuitive result may be explained by differences between working class dynamics taken from retrospective questions and from direct questions asked on a pane!.
Probability ofExiting Unemployment
..
--Duration Dependence
Self-employed presented the following exiting probabilities: 51 % after one month, 34% after two months and 14% after three or more months. Employers presented similar exiting probabilities (54%, 35% and 12%, respectively). The sharp fali of occupational risk with tenure may imply the inadequacy of providing seed money for new micro-entrepreneurs instead of funding already established business.
Occupational Risk and Age
In the 15-24 years age bracket, the exiting probability of self-employment is 15.6%, this statistic falls to 7.9% in the 45-54 years group. Occupational risk of employers also tend to falI as people move from the begin to the middle of their life cycle.
Self-Employed Income Risk
The income risk of self-employed units that do not change occupation was between 26% and 54% higher than the risk observed for alI working classes in the 1982-97 period. However, there is an inverse relationship between self-employed income risk and the risk of alI occupied individuaIs. The total elasticity between this two variables is -0.29. In sum, self-employed risk is higher but it increases relatively less in times of increasing overall volatility.
Profile of flows: Self-employed and Employers
The strategy pursued here is to analyze the main socio-economic characteristics of stayers versus movers fromlto self-employed and employer status.
Stayen
Employers stayers are more correlated with the following characteristics masculinity (87% of males against 58% among the self-employed) , headship (83% of heads against 59%) and specially formal schooling (9.1 years of completed schooling against 4.8).
The bulk of the observed differences in occupational structure between employers and self-employed are the greater importance of manufacturing for the former (24% against 4.7%) and ofthe services sector for the later (56.5% against 32%). Relative net income of employers are about 4 times the leveI observed for the self-employed. On the other hand, average hoursare much higher among employers (50.4 weekly hours) than for self-employed (41.7).
Moven
•
""
Self-employment entrepreneurial success
The transition probabilities from self-employment to employer status between 1991 and 1996 constitute a measure of entrepreneurial success and of employment generation in this segment of the labor market.
Individual Characteristics: as expected, heads, males, whites or yellow individuaIs
and heads are more frequent1y successful in their respective self-employment activities even after controlling for other items such as education attainment. The lack of entrepreneurial success among blacks and mulattos has been subject to various studies in the USo This result taken at face value may imply that there may be room for affrrmative actions toward self-employment units in microentrepreneurial support programs.
Family education background variables and religion related variables dropped out in the variable selection process used. This last result points against the existence of Weberian Protestant ethics effect among the Brazilian self-employed.
Human Capital: - Experience with diminishing retums captured by the negative
coefficient on the age square variable indicates an inverted U shaped life-cycle profile of individuals moving from self-employment to employer position. As expected, the coefficient on the variable completed years of schooling indicates the importance of formal educational policies as feeding entrepreneurial success.
A variable that captures the simultaneous knowledge of the name of mayor, govemor and president also plays an important role explaining the likelihood of the specific transition under scrutiny. One should perhaps view this variable more as an education quality indicator.
Social Capital - There is evidence that variables captured by productive associations
membership (trade union and non community associations), seems to explain part ofthe self-employment success rates. This result would support the use of productive networks in micro-entrepreneurial enhancing policies (e.g., as social collateral in credit arrangements).
Self-employed individuaIs that perceived to be well off in 1991 were cIo ser to the margin of change towards employer and consequent1y presented higher transition probabilities between 1991 and 1996. Finally, self-employed individuaIs that perceived the regular incorporation of new equipment in 1991 aIso presented higher transitions probabilities toward employer occupations.
Regional dummies: Minas Gerais dummy variable presents a positive effect on the
probability of migrating from self-employment to employer activities.
Design of Productive Popular Credit Instruments from the Rocinha Survey Most of the sources of funding used by poor micro-entrepreneurs to start their business are own savings (47%), firing fines (13% - FGTS etc.), family Ioans (7.1%). On the necessary support found to expand their business: 35% declared that needed no support while 17% said that credit was essential to them.
Main Lessons:
1. Introduction
The operation of public employment policies in Brazil can be divided in two broad groups. The first group consists of policies designed to assist the unemployed through unemployment insurance, intermediation schemes, training programs and direct employment programs (e.g.; frentes de trabalho da seca) . The second and more embrionary group of policies is aimed at fostering micro and small enterprises employment generation potential through a series of initiatives: productive credit, technical assistance, marketing support and cooperatives building.
According to the May 98 national Ibope-CNI survey, the biggest concem of Brazilians is unemployment indeed. When individuaIs were asked what are the main policies to fight unemployment the main answers were: 'support micro and small enterprises' (44%), 'training programs' (16%) and 'interest rate reduction' (14%). Despite ofthe importance attributed by the population to interventions designed to assist micro-entrepreneurs, little is known about how micro-entrepreneuriaI activities operate in Brazil and consequent1y how to design efficient policies to enhance this segmento
Complementarily, standard poverty profiles shows that no other head of household working class (including inactive states) has a bigger contribution to poverty in Brazil than self-employment. However, once again little is known about how poor self-employed behave and what are their main productive needs.
This paper attempts to generate and organize stylized facts of self-employment and employer activities in Brazil. The final purpose is to help the design of policies to assist micro-entrepreneurial activities in Brazil. The main questions pursued are: i) who are the Brazilian self-employed? ii) in particular: what is relative importance among the self-employed of subsistence activities versus those activities with growth and capital accumulation potential? iii) what are the main determinants of micro-entrepreneurial success? iv) what are the main constraints on poor entrepreneurs activities? v) what is the degree of risk associated with micro-entrepreneurial activities in Brazil?
Our main tool of analysis are transitional data constructed from household surveys. The longitudinal information covers three transition hórizons: 1 month, 12 months and 5-year periods. This data wiIl be used quantitatively and qualitatively. On the quantitative side, our strategy is to study movements into and out of self-employment and employer status as qualitative evidence on the nature of these activities. The idea can be putted as te/l me where will you go (and where did you come from) and I tell you who you are. In particular, we will use the transitions from self-employment to employer occupations as a proxy for the degree of entrepreneurial success. The main point here is to distinguish self-employment activities tumed to subsistence from those with a growth potential. The transition between
self-employment to employer can also be seen as a measure of self-employment creation intensity in the self-employed sector.
Another quantitative goal is to assess the degree of risk implicit in micro-entrepreneurial activities. This analysis is relevant to identify the welfare effects of entrepreneurs vulnerability as well as their ability to honor previously contracted credit arrangements. We use the exiting probability of different working classes as ex-post
rneasures of occupationaI risk. We use three windows of measurement: 1 month, 1 year and five-year periods. We also assess other possible determinants of entrepreneurial risk: i) the ... relation between tenure and occupational risk (duration dependence); ii) the probability of
•
The qualitative analysis will describe the socio-economic profile of individuals going in, going out or staying in self-employed and employer activities. We start tracing simple tabulations of the main characteristics of individuals exiting and entering micro-entrepreneurial activities fromlto different origins/destinies. The main characteristics analyzed are sex, household status, age, schooling, initial and final sectors of activity, initial and final earnings and initial and final hours worked.
The next step is to run logistic regressions of micro-entrepreneurial transitions on a broad range of explanatory variables. We attempt to assess the role played on entrepreneurial success by various personal characteristics (sex, household status, race, religion) and by various types of assets such as: Human Capital (experience, formal education, educational background, professional training), Physical capital (access to new technologies) and Social Capital (membership in cooperatives and community associations). The main purpose ofthis exerci se is to guide the implementation of capital enhancing policies aimed at increasing micro-entrepreneurs success rates.
The final step of the analysis implements case studies of entrepreneurial activities in Rio de Janeiro. First, we extract from a sample of micro-entrepreneurs from Rocinha some lessons for the implementation of productive micro-credit turned towards the poor. In particular, the analysis of informal arrangements and other characteristics of poor entrepreneurs is implemented trying to extract lessons for the design of micro-credit contracts. Final1y, we briefly describe the operation of technologicaIly advanced micro-enterprises incubators.
2. Dynamics of Micro-entrepreneurial activities in Brazil
The literature on Brazilian labor markets often groups together self-employed units and illegal employees and label them as the informal sector. The unifying feature according to this classification would be the precariousness leveI of these occupations. Another key characteristic of the informal sector would be high degree of tax fiscal evasion. Both of these ways of splitting formal and informal sectors are not in line with questions on working class implicit in labor market and household surveys questionnaires which constitute the main source of information used here. According to the typical survey questionnaire self-employed would be much eloser to employers in terms of contractual labor relations. The basic distinction between self-employed and employers is the fact that the former does not hire labor. There is an extensive empirical literature for the US and the UK that uses the movements towards self-employed as a proxy for the creation of enterpreneurship in the economy.
We use here movements into and out of self-employment and employer occupations as qualitative evidence on the nature of micro-entrepreneurial activities in BraziI. The idea can be putted as tell me where will you go (anti where did you come from) and I tell you who you
are. In particular, we wiIl use the transitions from self-employment to employer occupations
as a proxy for the intensity of entrepreneurial success. The main point here is to distinguish self-employment activities tumed to subsistence from those with a growth potentiaI.
2.1 Quantitative transitional analysis
The dynamic objective of this section requires the use of longitudinal statistic at an individual leveI. Each month a large number of micro-enterprises go out of business while I ' others start their activities. In this setting, the evolution of the number of micro-enterprises
hides the existing mobility in this sector.
•
•
non-response rates, attrition rates and selectivity biases). Our purpose here is to gauge the flows of individuaIs entering and exiting seIf-employment and empIoyers status departing from different origins and leaving to different destines. These flows will provide intensity measures of micro-enterprises creation, expansion, decaying and destruction. The tool used to organize this data are probability transition matrices.
2.2. Probability Transition Matrices between Working Classes
A transition matrix presents the probability that each individual observed at different working class conditioned on being on a given working class in the previous period.
The sampIe of individuaIs successfully observed during four consecutive periods is our basic unit of analysis. At this point we wiIl restrict the analysis to the transition between the second and the third observation ofthe group offour consecutive observations. Given the sensitivity of mobility measures to reporting errors in the classification variables we will impose further restrictions on the sample analyzed. In order to reduce the effects of reporting errors: we willlimit our analysis to the sample of individuals that did not report working class changes in the first two and in the last two observations of the group of four. That is, we will calculate the transition probabilities between the second and the third observation conditioned that there was no other transition in the group of four consecutive observations. Later, we relax this restriction to study how these transitions operate in different horizons, we will also study non-Markovian properties of the micro-entrepreneurs occupational switching processes (i.e., duration dependence).
P
o n
s c ç
ã a
o
TABLEl
PROBABILlTY TRANsmON MATRIX BE1WEEN WORKING CLASSES PROB WlTH REFINEMENT (2 BY 2)
Metropolitan Brazil - PERIOD 82-97
FarmalEmp. lnformoI Emp. SoIf..en.> EmpI- Unpoid Publie servanc InadiV8 u~ FannalEmp. 97.3% 0.7% 0.3% 0.1% 0.0% 0.3% 0.7% 0.5% .ntonnoIEmp. 8.7% 79.9% 4.1% 0.2% 0.2% 0.8% 4.9% 1.3%
~ 1.1% 2.6% 90.0% 1.5% 0.1% 0.1% 4.3% 0.3%
EmpI- 0.9% 0.5% 5.5% 92.1% 0.2% 0.1% 0.7% 0.0%
Unpoid 0.7% 5A% 4.2% 1.6% 76.3% OA% 11.1% 0.2%
Public Servant 1.2% 0.2% 0.1% 0.0% 0.0% 97.7% 0.6% 0.1%
..-"" OA% 0.7% 0.9% 0.0% 0.1% 0.1% 97.3% 0.5%
U'*"!lIoyood 13.6% 12.5% 5.6% 0.1% 0.2% 0.7% 18.9% 48.2%
We will focus the analysis ofthe transition matrix in three dimensions:
ToUI 100.0% 100.0% 100.0% 100.0% 100.0% 100.0% 100.0% 100.0%
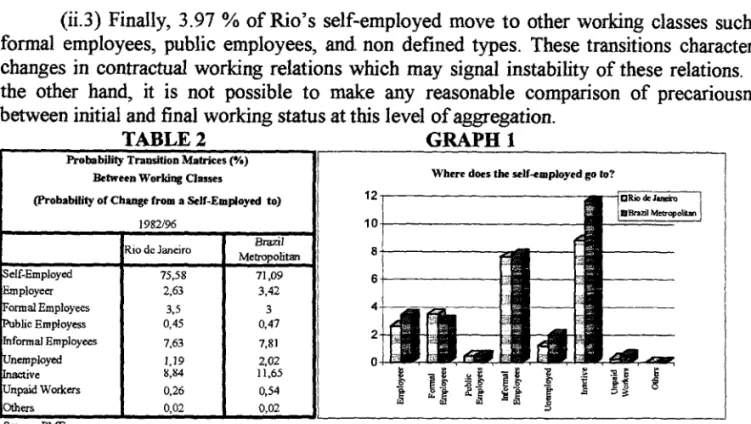
(I) Row analysis (where will the self-employed go to?) - Table 2 and Graph 1 assess the probability of change from self-employment to other working classes in Brazil metropolitan areas and in the metropolitan region of Rio. We divide these patterns in two types:
(i) individuais that stay in the same working class. This group wiIl be analyzed latter. (ii) Individuals that move to other working classes. This group amounts to 24.52 % and can be divided into three further groups:
(ii.l) Self-employed units that moved toward larger scaIe entrepreneurial activitie~,
that is, to an employer status. The idea here is that the act of hiring at least one employer IS indicative of business growth. The expanding number of self-employed in Rio was 2.63 %. The same statistic raises to 3.5% in the case of metropolitan Brazil. This result indicates that Rio's self-employed were less prosperous than their Brazilian counterparts.
... (ii.2) Around 17.92 % of the initiaI seIf-employed Carioca~ mi~ate to mo:e precarious working classes, such as informal employees, unemployed, mactIve. and un~aId
,
..
"'.-
.
...
-~--- ~~~~ -- -- -- -- -- -- -- -- -- -- -- - - -- - --(ii.3) Finally, formal employees, p
3.97 % of Rio's self-employed move to other working classes such as
ublic employees, ando non defined types. These transitions characterize
aI working relations which may signal instability of these relations. On
s not possible to make any reasonable comparison of precariousness nal working status at this leveI of aggregation_
changes in contractu the other hand, it i
between initial and fi
TAB LE2 GRAPH 1
Probability Transitio n Matrices (".)
Between Worki ng Classes Where does lhe seU~mployed go to?
(Probability of Change from a Self-Employed to)
Self-Employcd Employeer lFormal Employecs public Employess Informal Employees [unemploycd ~ve Unpaid Workers OIhers Source:PME
1982/9 6
Rio de Jan eira 75, 58 63 5 45 2, 3, 0, 7, I, ~, 0, 0, 63 19 S4 26 02 Brazil Metropolitan 71,09 3,42 3 0,47 7,81 2,02 11,65 0,54 0,02
In sum, the s elf-employed from the metropolitan region of Rio presents at the same on probabilities towards more prosperous states and smaller transition more precarious states than the ones from metropolitan Brazil. The sum of probabilities remain approximately constant, so does the residual of hat is, the probability to remain self-employed.
time smaller transiti probabilities towards of these three types these probabilities. T
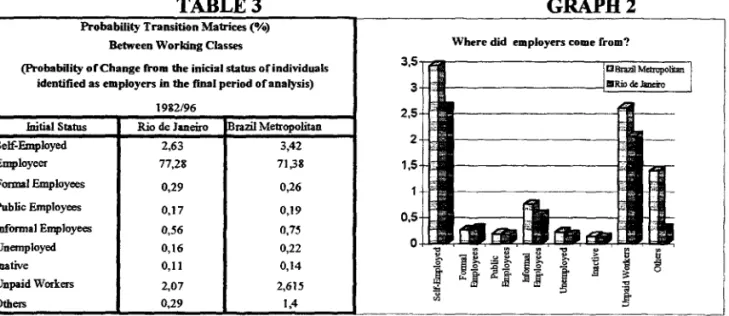
(lI) Column analysis (where did employers come from?) Table 3 and
That is, the analysis
Gíaph 2 presents an employers column analysis of the transition matrix. indicates the initial status of individuais identified as employers in the
15_
final period of analys
Gíaph 2 indi cates that the main origin of employers are self-employed units. In this p of self-employed does not constitute subsistence activities but activities
ial where the precariousness adjective does not always apply. sense at least a grou
with a growth potent
We can idenf 1fy three main origin groups for employers according to the magnitude of
bilities: their transition proba
(i) The pos services), inactive unemployed.
itions belonging to the formal sector (formal employees and public and the unemployed present smaller probabilities of becoming
(ii) The self-employed present the highest probabilities of becoming employers, 2.63 a of the realized expansion potential of the self-employed.
%, what gives an ide
(iii) The thir the highest probabil classes are fairly uns
.
-"'.
·---~---TABLE3
Probability Transition Ma1rices (%) Between Working Classes
(Probability ofChange from the inicial status ofindividuals identified as employers in the final period oranalysis)
1982/96
Initial Status Rio de Janeiro razil Metropolitan
Self-Employed 2,63 3,42
Employeer 77,28 71,38
Formal Employees 0,29 0,26
PubJic Employees 0,17 0,19
Informal Employees 0,56 0,75
Unemployed 0,16 0,22
Úlative 0,11 0,14
npaid Workers 2,07 2,615
Others 0,29 1,4
Source:PME
GRAPH2
Where did employers COllle frolll'?
3 , 5 T 2 ! l : . _ _ - - - = - - - - . ,
3 2.5 2 1,5 0.5 O
I
'"(llI) Diagonal analysis (occupational risk comparisons)
Table 4 below presents the transition probabilities of individuaIs that keep their initial occupation during two consecutive months. This statistic is the complement of ex-post occupational risk measures.
TABLE 4 GRAPH3
Probability TransitioD Matric:es (%) Between Working Classes Transition ProbabiJities of Individuais that keep their initial oc:c:upation during two consec:utive 1II0nthS
1982/96 Waking classes Self-Emp1oyed Unpaid Worlcers OIhers Fonte:PME Brazil Metropoli1an 71.05 71,38 89.51 89.54 59.75 38.42 89.01 49.52 1.65
Rio de Janeiro
75.58 77,28 89.12 90.6 63.14 42.06 91.26 57.91 3.94 100 90 80
f--70 60 50 40 30 20 10 o
i
'"
~Oc:cupational Risk COlllparisollS
~ - R J!~ .,. n
iL~ E ~
I
~~;fI
:il
1 - - , ' - c
-1 - - , ' I
I
-
f---~
j
t :5 11 ~
!
-~ ~Table 4 allow us to identify ex-post the risk of changing working class. For instance, the occupational risk of self-employed. Graph 3 allow us to visualize differences of staying probabilities between different occupational groups. Once again, these probabilities can be divided into three groups according to their magnitude.
(i) Informal employees ( 63.14%), unemployed ( 42.06%) and unpaid workers
(57.91%) are the more unstable states, that is those with smaller probability ofkeeping their
initial state. It is interesting to notice that the fact that these high exiting probabilities of
precarious states should enhance social welfare. That is, when one can not be get worst, risk should be viewed as a quality.
(ii) Formal employees, public employees, and inactive present higher staying
probabilities around 90%. Inactive are difficult to be analyzed since they cover both discouraged unemployment as well as workers that are out of the labor force by choice or age (student and retirees) .
(iii) Self-employed and employers are in an intermediary position with respect to the two groups mentioned above with staying probabilities equal to 75.58% and 77.28%, respectively. This result indicates that the income risk of both of these activities tend to be
higher than the one observed for formal employees but smaller those observed for informal
.
'3. Origins, Destinies and Risks or Micro-entrepreneurial Activities across DitTerent Time Horizons
PME rotating panel scheme allows to capture labor market dynamics operating at different frequencies. We will work here with 1 month and 12 months interva]s without any refinement in order to allow more direct comparisons. The retrospective question on working class on the special PME supplement that went to the field during 1996 allow us to study a five year transition period (i.e., between 1991 and 1996). This sub-section evaluates how changes in the period of measuring labor market flows affect the different origins, destinies and risks of micro-entrepreneurial activities analyzed before.
We start with occupational risk measures captured here by the probability that an individual change his/her working class between two time instants. The data in Table does not include any type of refinement in order to al]ow more direct comparisons. In general, we observe an increase in ex-post risk measures when we move from monthly to five year windows of measurement in alI working classes analyzed. The self-employed is the only working class that present a risk reduction when we move from annual (43%) to the five year
windows (37%) of measurement. This counter-intuitive result may be explained by
differences between working class dynamics taken from retrospective questions and from direct questions asked on a panel.
TABLE5
Occupational Risk Comparisons Brazil 1982-98
Monthly Annual
Without Ref. Without Ref.
SeIf
Employer
Legal Employee megal Employee
Unpaid
Public sector
Inactive Unemployed
Source: PME
28.15 26.22 10.29 40.29 47.95 10.48 9.98 60.56
42.92 40.23 22.52 61.49 67.94 17.28 19.66 85.75
Between 5 years 91 and 96
37.31 44.26 33.04 65.64 75.62 23.69 30.37 91.23
Given the rise in the probability of exiting different working classes as we increase the period between transitions, we wiIl analyze the composition of the flow for those that moved between working classes.
•
.
'..
- - - -- - - ---~
TABLE6
Wheredid employers come from? Brazil 1982-98
Moothl~ Aooual Betweeo 5 years Without Ref. Without Ref. 91 and96
Self 63.5% 52.5% 43.9%
Legal Employee 11.4% 18.5% 32.4%
llIegal Employee 10.3% 10.8% 6.3%
Uopaid 2.9% 2.7% 0.3%
Public sector 2.1% 2.5% 4.4%
Inactive 8.6% 11.3% 3.6%
Uoemployed 1.2% 1.6°,(, 2.5%
Other 0.0% 0.0% 6.7%
100.00 100.00 100.00
Source: PME
4. AnaJysis of Micro-Entrepreneurial Risk
This section assess various aspects of entrepreneurial risk. This analysis can be useful in the design of a series of policies designed to feed entrepreneurial activities (e.g. micro-credit arrangements, compensatory schemes for the unemployed).
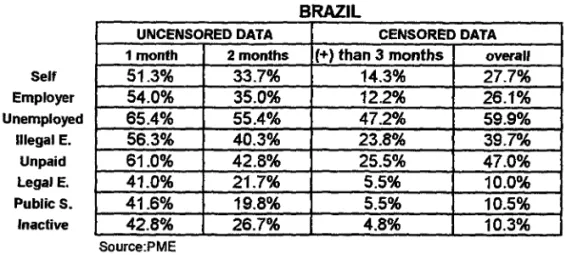
4.1 Duration Dependence and OccupationaJ Risk
We attempt now to verify if the duration of the stay in the different working classes analyzed above affect their respective exiting probabilities. The exiting probabilities calculated were given that the individual is only one month, only two months, more than three months in a given working class, as presented in Table 7.
For the self-employed we found the following exiting probabilities: 51 % after one month, 34% after two months and 14% after three or more months. Employers presented similar exiting probabilities (54%,35% and 12%, respectively).
There are twO main lessons to be extracted from this exerci se self-empIoyed and employers occupationaI risk measures are stilI in the intermediary range from those observed for the unstable group of unemployed, informal employees and unpaid and the more stable group of inactive, formal employees and public servants. Second, and most important, all groups presented duration dependence in the sense that longer spells tend to present smaller exiting probabilities. In particular, in the case of self-employed units the exiting probability for those that are for more than three months in the occupation is roughly one third the probability found for those that entered self-employment in the previous month. In the case of employees this ratio falIs to less than one fourth. In policy terms this result main point towards the inadequacy of providing seed money for new micro-entrepreneurs .
f i '
...
Self Employer Unemployed
/Ilegal E. Unpaid LegalE. PubJic S.
'nactive
UNCENSORED DATA
1 month 2months
51.3% 33.7%
54.0% 35.0%
65.4% 55.4%
56.3% 40.3%
61.0% 42.8%
41.0% 21.7%
41.6% 19.8%
42.8% 26.7%
Source:PME
TABLE7
BRAZIL
CENSORED DATA
(+) than 3 months overall
14.3% 27.7%
12.2% 26.1%
47.2% 59.9%
23.8% 39.7%
25.5% 47.0%
5.5% 10.0°.{,
5.5% 10.5%
4.8% 10.3%
4.2 Micro-enuepreneurs and the Probability ofExiting Unemployment
Table 8 attempts to answer the following question: What is the relative difficulty of individuaIs that were previously micro-entrepreneurs to exit unemployment. We found that the after one month unemployment exiting probability of individuals that were previously in self-employment (73%) and employer (70%) states is greater than the one observed for alI other states. The same type of resuIt hoIds for individuais that were in one month in either unemployed or inactive states. This result may be interpreted as an indication that previously micro-entrepreneurs do not require any type of special assistance with respect to other working classes when they get unemployed.
TABLE8
Present Working Class
Previous Unemployed Unemployed
Working or'naclive
Class
Se.f 73,3% 57,9%
Employer 70,4% 54,0%
Informal E. 68,0% 48,4%
Unpaid 64,9% 37,2%
FormalE. 56,3% 40,7%
PublicS. 58,2% 39,8%
Inactive 66,6% 21,2%
Source:PME
4.3 Occupational Risk and Age
•
..
..
_ _ _ G_r--'C:a.1!h 4 16%
16,0%
-.--=:;--____________
--,
14,0% 12,0% 10,0% 8,0% 6,0% 4,0% 2,0% 0,0%
15A 24 25A34 35A 44 45A 54
I O self-emplovees g emplovers I
Source:PME
4.4 Self-Employed Income Risk
The short-run panel characteristic ofPME also allow us to evaluate the income risk of self-employed units that do not loose their jobs. In other words, we analyze the income risk of those with a nuIl ex-post occupational risk). Taking as a reference the transition matrix (Table
1) we analyze those that are in the diagonal of the matrix.
Graph 5 presents a 12 month-moving average ofthe temporal variance oflog earnings of continuously self-employed heads during four consecutive months. Graph 6 presents the ratio between this measure and the one calculated with continuously occupied heads in aIl working classes (including self-employed). This latter graph reveals the existence of extra income risk in continuously self-employed units activities. The differential between income risk between self-employed and the whole sample of continuously occupied heads ranged from 54% to 26%.
Another characteristic reveal by this graph is the existence of an inverse relationship between self-employed heads risk and the risk of alI occupied heads. The total elasticity between this two variables is -0.286 with a t-ratio of -15.7 . This result reveals that although self-employed present an additional risk with respect to other occupations they are relatively more able to avoid additional risk increases in times ofhigher aggregate instability.
As a consequence of the self-employed ability to reduce their extra risk when their income risk is at a local maximum, the risk differential tends to be at a local minimum. These points tend to coincide with inflation peaks that were usually followed by stabilization plans, like those observed in 1986, 1990 and 1994. One interpretation for this empirical regularity is the relative ability of self-employed units to change their prices/incomes in a high inflationary environrnent. For example, employees have to go through a costly bargaining process with their firms to change nominal wages. In contrast, the self-employed are vertically integrated units (i.e.; are firms and workers at the same time) with a nuIl bargaining cost. This greater degree of vertical integration makes the self-employed more able to deal with higher and more unstable inflation rates.
Temporal Variance ofLog Earnings Graph 5 - SelfEmployed Units
of Continuously Self-Employed Units (12-m MA) Graph 6 - Ratio between the Self- Employed and the Whole Sample
~---,
0.046~
0.044
0.042 :
0.040
0.038
0.036
Q~ .
~ ~ ~ ~ ~ ~ ~ ~ ~ ~ ~ m ~ ~ ~ ~ ~ ~
..
..
5. Qualitative transitional analysis
The present section attempts to qualify the nature of self-employed and employers activities. The measures of flows of individuais entering and exiting the status of self-employed and employers departing from different origins and Ieaving to different destines analyzed in the previous section can be used as indications of WHO belongs to these groups. We are interested in capturing qualitative aspects of the heterogeneous group of self-employed from the relative magnitude of their different inward and outward flows That is, the composition of the row and the column flows in transition matrices anaIysis explored in the previous section. These flows will provide measures of the intensity of processes of micro-enterprises being bom, expanding, decaying and dying. In particular, we want to disentangle the self-employed subsistence activities from those activities with potentiaI for capital accumulation and growth.
5.1 Profile of flows: Self-employed and Employers - Stayers
•
..
TABLE9
Sample Profile - SeIf-Employed and Employer - 1982 to 1997
Analysis of Changes Between 2 consecutive months - Brazil - With Refinement
Continue as Switch From Continue as Switch From
Self-Employed Self-Employed to Employer Employerto
Emp/oyer Self-Employed
Socio-OemOgraphic Characteristics
% Males 57.76% 85.73% 87.20% 85.75%
037% 222,. 050% 215%
Average Age 40.37 40.44 41.24 40.50
00' 00. 015 065
% Heads 58.52% 78.07% 82.78% 80.68%
037% 253% 056% 243%
Average Schooling in Years 4.77 7.04 9.09 7.10
003 030 0.07 0.29
Sclloolinll
%illHerate 16.04% 6.52% 1.48% 7.22%
078% 157% 018% 159%
% between 1 and 3 Years 21.49% 13.42% 6.51% 12.21%
031"", 216% 037% 202%
% between 4 and 7 Years 39.83% 37.24% 28.06% 38.32%
037% 307% 067% 300%
% between 8 and 11 Years 17.59% 27.41% 38.38% 25.04%
om, 283% 072% 267%
% between 12 and 15 Years 3.03% 8.41% 16.77% 9.45%
013% 175% 055% 1.80%
% 160rrrnre 2.02% 6.99% 8.81% 7.75%
011% 162% 042% 165%
Economic Characteristics
Sec1Drial Cllaract8ristics
% in Services '"itia' 56.46% 42.97% 32.04% 41.63%
037.,.
"'" 070% 31)8%
% in Services Final 57.14% 41.23% 33.09% 45.26%
037% 318'" 071% 310%
% in Manutacturing Inmal 3.66% 7.76% 24.41% 11.53%
014% 172% 065% 199%
% in Manufacturing Final 3.63% 10.68% 24.30% 8.12%
014% 199" 065% 170%
% in Commerce Initial 27.96% 32.68% 32.70% 28.55%
034% 302% 071% "2%
% in Commerce Final 27.45% 30.95% 32.09% 29.84%
0"% '99% 070% 285%
% in Construction Initial 9.54% 12.90% 6.77% 15.19%
022% 215% 038% 224%
% in Construction Final 9.46% 14.30% 6.59% 13.32%
0.22% 2,. .. 037% 212%
% in Public Sector Initial 1.54% 2.72% 3.60% 2.84%
0.09% 11)'" o - 10<"
% in Public Sector Final 1.48% 1.96% 3.47% 3.10%
009% 090% 028% 108%
EaminllS'
Average Relative Eamings Initial 0.66 1.52 2.86 1.81
Average ReJative Eamings Final 0.64 1.62 2.80 1.60
% Above Overall Median Innial 35.67% 74.07% 92.62% 79.07%
037% 2 • .,., 0 _ 2.62%
% Above Overall Median Final 35.00% 76.75% 89.81% 72.71%
031% 278% 048% 287%
% Positive Secondary Eamings Sources Inmal 3.46% 4.25% 4.39% 4.01%
014% 128% O~O% ''-1%
% Positive Secondary Eamings Sources Final 3.27% 4.16% 4.46% 2.40%
013% "'7% 031% O"''''
% Positive Earnings In itial 94.38% 91.87% 93.11% 91.90%
017~ 1.13% 038% 1.58%
% Positive Earnings Final 94.57% 93.10% 94.14% 91.36%
017% 151% 035% 113%
Hours Worked'
Average Hours In~ial 41.65 49.03 50.43 49.48
01. 005 022 094
Average Hours Final 41.45 50.03 50.05 48.61
014 096 0?1 o.,
% Final Hours Grealer Ihan Initial hours 48.97% 53.36% 48.89% 46.29%
Source: PME
Stayers
Table 9 shows that employers stayers are more much more correlated with masculinity (87% of males against 58%) , headship (83% of heads against 59%) and specially formal schooling (9.1 years of completed schooling against 4.8). The percentage of individuaIs above 11 years of schooling is substantially greater in employers than in the self-employed (25.6 % against 5%). This indicates the importance ofrelative high schooling leveis among employers. On the other hand, the percentage below 4 years of completed schooling is smaller among employers (8% against 37.5%) indicating a heterogeneity among employers not too far from the one observed among the self-employed. These results also highlights the importance of human capital among employers.
The average age of employers is higher than self-employed individuaIs schooling (41.2 years ofage against 40.8). Note that although these results are statistical1y different at a 95% confidence levei (inferred from the standard error ofthe estimates in small numbers), they are not very different. This provides initial evidence against systematic differences between the life-cycle profile of self-employment and the life-cycle profile of employers that wiIl be analyzed later.
The comparison between economic characteristics of stayers is done by comparing the
status in both the second and the third observation within the group of four consecutive observations. In alI cases comparing both segments of micro entrepreneurial activities in these two points in time. This analysis will be specially useful to compare the economic characteristics ofmovers before and afier the shifi between working classes. For the sake of simplicity, the present comparison between stayers will only use the economic characteristics observed in the second observation. Note that these results are always not statistically different at a 95% confidence leveI.
Employers are more associated than the self-employed with the manufacturing sector (24% against 4.7%), commerce sector (32.7% against 28%) and the public sector (3.6% against 1.5%). The reverse is true with services sector (56.5% against 32%%) and civil construction sector (6.8% against 9.6%). In sum, the bulk of the observed differences in occupational structure between employers and self-employed are the greater importance of
manufacturing for the former (24% against 4.']010) and of the services sector for the later
(56.5% against 32%%).
In terms of earnings, reIative net income of employers are about 4 times the levei observed for self-employed (ratio between employers earnings and the whole group of occupied individuaIs is 2.9 against 0.66 for the self-employed). Perhaps more interesting, 92.6% of employers are above median of the whole group of occupied individuais. This
statistic falls to 35.7% in the case of self-employed individuais. If one accepts the median as
the cutoff paint between poorly and well paid individuais, these numbers reveal that the great majority of employers are fairly well paid while most of self-employed are poorly paid. The greater percentage of positive secondary sources of labor income are also statistically higher among employers what reinforces total eamings differentiaI between the two working classes under scope. The Iast row of the earnings module shows the universe of positive main sources of eamings where the earnings statistics previously discussed emerge from. Self-employed and employers present about the same proportion of positive earnings, confirming the validity ofthe above analysis.
..
•
Migrants
The previous section focused on the profiles individuais that kept these respective working classes in each group of four consecutive observations successfully matched. Since the staying probabilities are, as a rule, not too far from one, specially once the refinement is incorporated into the analysis. The result ofthis analysis overlaps at large to the profile of these profiles derived from standard cross-sectionallabor market or household surveys.
We move now to the analysis of those groups of individuaIs that are moving between
working classes taking fulI advantage ofthe longitudinal aspect ofP:ME data. In general the
analysis of specific socio-economic characteristics of movers between two specific states these yields intermediary values with respect to the intervaI defined by the same
characteristics observed by stayers in these respective states. The issue here is who the movers between movers from states A and B (and vice-versa) look more alike stayers in state A or stayers in state B .
The comparison of socio-demographic characteristics between migrants
self-employment and employer status and vice-versa, presented in Table 9 yields results that are much closer to employers than to self-employed status. For example the proportion of males are two percentage points far from those observed in employers but 28 percentage points distant ofthose found for the self-employed. Similar absolute differences are observed for the proportion of heads. These results may be read as an indication that those moving between self-employment and employer status (and vice-versa) constitute a selected group ofex-self-employed (future self-ofex-self-employed). Average completed years ofschooling is closer to the half-way point, (7) in the interval delimited by the values observed for self-employed (4.8) and employers (9.1). Once again, average age is not dissimilar in the four groups analyzed (around 41 years).
The comparison of economic characteristics before and after the shifts from self employment to employer status are associated with shifts of sectors of activity towards manufacturing, (from 7.8% to 10.7%) and towards civil construction (12.9% to 14.3%) while there is a corresponding reduction in the share in services (43% and 41.2%), commerce (32.9% to 31 %) and in the public sector (2.7% to 2%).
There is a 7% increase of average earnings and a 2% increase in weekly hours worked associated with the switch from self-employment to employer status. The same statistics in Table 9 also show that the income leveI of self-empIoyed before the expansion to employer is 130% greater than the self-employed that did not move. The absoIute flows from
seIf-empIoyment into employer status is 6.1% higher than the reverse movement (1123
observations against 1058), indicating a net outflow of empIoyers. In other words, according
to our measures based on direct flows, one can say that in the 1982 to 1987 period there were more shrinking empIoyer units than there were expanding seIf-employed units.
In sum, the socio-economic characteristics of the flow from empIoyers to seIf-employed are not statistically different, one by one, from the reverse flow. One may interpret this similarity as an indication that individuaIs moving from self-employed to empIoyer are more likeIy to move back to seIf-empIoyment than the rest of the employer group. The existence of a circular flows between self-empIoyment and employers for a selected group of individuaIs may indicate a high heterogeneity among the seIf-employed.
Appendix B presents profiles similar to the ones discussed above considering different
horizons between transitions (1 month without refinement, 12 months with and without
..
•
6. Self-employment entrepreneurial success
We will implement a casual interpretation of the role played by resources and individual characteristics on micro-entrepreneurial success. This analysis is in many aspects similar to the one presented in the previous section. There we compared the profiles of peopIe that stayed in self-employment and in employer occupations with those that migrate between these two working classes. The difference is that we use a different data set: the supplement to PME that went to the field in 1996. This means, first using a different horizon, in the previous section we studied the transitions occurred between two consecutive months and now we examine transitions over the tive year period between 1991 and 1996. The month by month window has the advantage of allowing to observe the exact moment that individuaIs are leaving certain working classes while using 10nger windows does not allow us to distinguish those that went out and in certain working class from those that stayed continuously occupied in this working class. On the other hand, the tive year window seems more relevant to the analysis of individuaIs Iife-cycle occupational behavior. Another advantage of the supplement is to provide a much richer set of endogenous variables than the usual PME survey to study working classes transitions.
..
•
-.
TABLEIO
LOGISTIC MODEL - ANALYSIS OF PARAMETER SIMPLE ESTIMATES V ARIABLES CONSIDERED IN ISOLATION
Switch from Self-Employed to Employer Between 1991 and 1996 _ BraziJ
Marginal
Obs* ProbabiL Estimate
Gender
MJlJe
1 90.4% 0.644
Race
White and Yellow
113.3% 0.758
Housebold Status
Head
104.0% 0.713
Household Status Spouse
-37.3% -0.466
Household Status
Sou
-44.7% -0.593
Religion
Evangelical
-30.4% -0.363
Experience Age
40/30 129.0% 0.019
Education
Completed Years ofSc:hooling 8/4
18.2% 0.119
Motber Education
Completed Years of Sc:hooling 10/4
78.5% 0.104
Father Education
Completed Years ofSc:hooling 10/4
51.7°,. 0.092
Technical Course Equivalent to High Sc:hool
1 77.9% 0.576
Knows tbe Correct Name
President, Governor and MJlyor
171.9% 1.000
Trade Unions and Associations Member in 1996
108.6"/0 0.735 Trade Unions and AssociatioDS
Attends at Least ooe Meeting per Year
126.2°/. 0.816
Communitarian AssociatioDS Member in 1996
43.6% 0.362
Communitarian Associations
Attends at Least ooe Meeting per Year
50.7% 0.410
Incorporation of New Equipament Perceived at Least as Regular in 1991
92.6% 0.656
Importance of new Knowledge
Big Risk of Losing tbe Job without them
47.5% 0.388
Importance of new Knowledge
Essential to Keep Working in the Same Occupation 49.30/.
0.401 Sitoation in tbe Occupation
Ranked Among the Well Paid in 1991 71.80/.
0.541
Construction Sector Occupied in 1991
-56.3% -0.827
Public Sector
Occupied in 1991
64.8"/. 0.500
Regional Dummies Minas Gerais
46.1% 0.379
Regional DumDÚes Pernambuco
-42.1"/. -0.547
Regional Dummies São Paulo
28.6% 0.251
Regional Dummies Rio de Janeiro
-24.2% -0.278
.. ComparÍS<ms for lhe marginal probability difference calculations:
1 corresponds to a companson taken from dummy variable, olher comparisons are specified below.
Std Error 0.118 0.114 0.117 0.137 0.196 0.167 0.004 0.011 0.015 0.013 0.124 0.133 0.113 0.205 0.129 0.140 0.115 0.140 0.106 0.100 0.208 0.234 0.112 0.199 0.114 0.143
The folIowing variables did not present a statisticaIly different from zero effect on the probability of moving from self-employment to employer occupations when they were considered in isolation: religion (atheist, catholic, kardecist, afro religion), sectors of activity (services, commerce, sector not specified) and Regional Dummies (porto Alegre and Bahia).
We proceed now in two altemative routes: First, we developed a general to specific variable selection procedure to end up with an a posteriori set of exogenous variables which appears to exert statistically significant impacts on the status variables analyzed. In this sense
the information of the variables dropped out during this selection process is a relevant part of
•
•
..
TABLE 11
LOGISTIC MODEL - ANAL YSIS OF PARAMETER ESTIMATES Switch frem Self-Employed to Employer Between 1991 and 1996 - Brazil
Estimate t-Statistic SUl Error Deviance
Gender Male 0.4477 2.6181.... 0.1710 2363.47
Race White and Yellow 0.4008 2.7026.... 0.1483 2324.73
Household Status Head 0.4147 2.4495 *" 0.1693 2311.55
.ª-~H&~.'.l ...•... ~~.~!!~! ... :~~!.~~ ... :.~:.~~? ... ~:~.~.?~ ... ~07.10
Education Completed Years ofSchooling 0.0841 5.0359.... 0.0167 2209.·93···
Experience Age 0.1359 3.6730.... 0.0370 2200.58
Experience Age Square -0.0013 -3.2500.... 0.0004 2189.70
Knows the Correct Name Pl-esident, Governor lInd Mayor 0.4241 2.7013·" 0.1570 2179.18
Father Education Completed YearsofSchooling 0.0210 0.8642 0.0243 2187.68
Mother Education Completed Years ofSchooling 0.0065 0.2453 0.0265 2187.48
.!.~!!!!:~.I .. Ç~!!!:~ ... ~~~!~!!~.~!!.!!i.~.~~ ... Q:E~.~ ... !:.!~~? ... ~~!~?. ... ?.I n. 75
Incorporation ofNew Equipament Perceived at Least as Regular in 1991 0.2976 2.1227.... 0.1402 . . 2Í72:5S .. · ..
.~~.~!~'!.'.l .. ~~.~~!:.Q!:~l'.~!i.I!.'.l ... ~~~.~!'.~.~.~o:!!.~!~.!!!.~.~~ ... Q:~~~~ ... ~:~~.~~ ... ~~ ... Q:!.!.?~ ... ?~~!.:~? ... .
Manufacturing Sector Occupied in 1991 0.5831 2.2054 *.. 0.2644 2156.13
Construction Sector Occupied in 1991 -0.3223 -1.0751 0.2998 2154.15
Services Sector Occupied in 1991 -0.0653 -0.2923 0.2234 2155.97
.ç.'!.':!':':!':~r:~.~:': ... ~~~~ .. !!!.~~.~ ... ~:Q!~~ ... Q:!>.??~ ... Q:~~.?~ ... ~.~~:!.! .... .
RegionaJ Dwnmies Rio de Janeiro -0.0403 -0.1961 0.2055 2149.12
RegionaJ Dummies São Paulo 0.3048 1.7318 " 0.1760 2153.81
RegionaJ Dummies Minas Gerais 0.6941 3.8285
....
0.1813 2134.88Regional Dwnmies Perll8mbuo:o 0.1815 0.7146 0.2540 2134.80
Regional Dummies Bahia 0.3324 1.3190 0.2520 2133.11
DF Value Va1ue/DF
NlI1IIhcr ofObservations : 3498 ; Log Likelihood: -1066.5526; Pearson Cbi-Square: 3475 3359.584 0.967
The transition probabilities from self-employment to employer status between 1991 and 1996 constitute both a measure of self-employment entrepreneurial success and simultaneousIya measure of employment generation in this segment ofthe labor market. We proceed now with a variable by variable analysis of the proposed model of entrepreneuriaI success presented in Table 11, we complement the analysis with references to the simple Iogistic regression exercise presented in Table 10.
Individual Characteristics: heads, males and whites or yellow individuals are more frequentIy succ essful in their respective self-employment activities even after controlling for other items such as education attainment. The coefficients of these three variables ranges between 0.40 and 0.45. The lack of entrepreneurial success among blacks and mulattos has been subject to various studies in the USo For example, this resuIt taken at face value could in principIe imply that there may be room for affrrmative actions in programs that support employment units. Although, one would need to precise what is driving the racial bias in self-employment success rates (e.g., tighter credit constraints for blacks due to lack of collateral or consumer discrimination)FN.
The dummy for evangelical religions is not significant different from zero. This resuIt points against the existence of Weberian Protestant ethics effect among the Brazilian self-employed in the Brazilian environmene.
Human Capital: - Experience with diminishing returns captured by the negative coefficient on the age square variable indicates an inverted U shaped life-cyc1e profile of individuais moving from seIf-empIoyment to employer position. As expected, the coefficient on the variable completed years of schooIing is highly significative indicating the importance of fonnaI educational policies as feeding entrepreneurial success. On the other hand, fathers
•
•
..
and mother education attainrnent variables and professional education variable (equivalent to a high school degree) coefficient did not turned out to be statistically significane.
A variable that captures the simultaneous knowledge of the name of mayor, governo r and president also plays an important role explaining the like1ihood of the specific transition under scrutiny. One should perhaps view this variable more as an education quality indicator than evidence of the importance assumed by other types knowledge apart from traditional education variables.
Social Capital - There are not variables for the initial period of transition, 1991, related to associativism in the survey used. There is a broad range of such type of variables for the final period of anaIysis, 1996, however this wouId introduce simultaneity bias in our estimates4
• This is unfortunate since productive and community networks may potencialize
self-employed units perfonnance through economies of scale. Other Variables
Self-employed individuais that perceived the regular incorporation of new equipment in 1991 presented higher transitions probabilities toward employer occupations. This effect demonstrate the importance of the updating knowledge for entrepreneuriaI success in the nineties. Finally, seIf-employed individuais that perceived to be well off in 1991 were closer to the margin of change towards employer and consequent1y presented higher transition probabilities between 1991 and 1996.
Sectoral and Regional Dummies: Manufacturing sector, Minas Gerais and São Paulo dummy variables presents a positive effect on the probabiIity of migrating from self-employment to employer activiti. The first two variabIes present the higher coefficients among aII the dummy variables considered in the present exerci se.
Appendix C presents a similar logistic regression anaIysis, considered in isoIation and after performing the variabIe seIection process described above, for the folIowing samples: i) self-empIoyed in 1996; ii) continuously self-empIoyed between 1991 and 1996. iii) empIoyer in 1996; iv) continuousIy employer between 1991 and 1996. v) migrant from employer to seIf-empIoyment between 1991 and 1996. v) migrant from employee to empIoyer between 1991 and 1996. vi) migrant from empIoyee to self-employed between 1991 and 1996.
7. Micro-enterprises: Resources, Behavior and Policies
According to the May 98 national Ibope-CNI survey, the biggest concern ofBrazilians IS unempIoyment. When Brazilians were asked what were the main policies to fight
3 These set of educational background variables were statistically significant froro zero in the simple logistic regression analysis: self-employed individuais who mother had ten completed years of schooling presented 79% more chances to migrate to employer occupation than those who mother had fom years of completed schooling. This same statistic drops to 52% when fathers education were considered in the analysis. professional education variable The self-employed individuaIs that possessed such diploma presented 78% more chances to migrate to employer status than those that did not possess such diploma.
4 When we use social capital related variables for the final period of analysis in isolation we observe a positive reJationship between these variables and self-employment success rates. 1bis evidence that variables captured by productive associations membership (trade unions and cooperatives) have higher simple correlation coeefficients than community associations membership. A similar type of ana1ysis indicates that both ofthese types of associativism presents higher coefficients when one controI for participation intensity (i.e., imposing a condition that the individual attends more than one meeting per year). This result would support the use of networks, specia1ly productive type, in micro-entrepreneurial enhancing policies (e.g. as social collateral in credit arrangements). Nevertbeless, it should be viewed with cautious since it is related with the final state 1996 and thus it is subject to simultaneity bias.
•
•
unemployment the main answers were 'support micro and small enterprises' (44%), 'training programs' (16%) and 'interest rate reduction' (14%). Despite ofthe importance attributed by the popuIation to interventions designed to assist micro-entrepreneurs, little is known about how this segment operates and how to design efficient policies.
The main objective here is to understand financiaI decisions of micro enterprises to guide the implementation of micro policies tumed toward the poor. Our emphasis will rely more on diagnosing potential implementation problems of micro credit policies tumed toward the poor rather than evaluating the policies themselves.
7.1 Rocinha's Poor Entrepreneurs
Standard poverty profiles recent1y shows that no other head of household working class has a bigger contribution to poverty in Brazil than self-employment (e.g., 36.6%
contribution against 5.6% of unemployed heads, according with Ferreira et all.(1998) 6).
However, once again little is known about how poor self-employed behave and what are their main productive needs. The purpose of this section is to study poor entrepreneurs behavior and resources, where poverty is defined in spatial terms. More specifically, we take advantage ofa special survey implemented in 1997 on the entrepreneurial activities in Rocinha's favela.
According to the 1991 Census data reported in Amsberg (1997) there are 462 favelas in RJ-Mun with a total of882,667 people in 224,350 households. Favelas thus housed 16% of the population. The favela population has grown 23% from 1980-91 compared to city wide population growth of 8%. Favelas span small settlements of less than 100 people to the biggest favelas with 43,000 (Rocinha) and 35,000 (Jacarezinho) people7.
7.1.1. Lessons for the Design ofProductive Credit Instruments for the Poor
(Neri (1998»
Popular productive credit programs should be sufficient1y flexible to incorpora te in its credit scoring system informal institutions and social habits of poor environments such as those found in Rocinha:
(i) 83% of Rocinha entrepreneurs declared to live in own housing. However, their property titles are probably not well established impeding the use of housing as collateral. In this respect previous public action to legalize property titles can be useful as a pre-condition of micro-credit policies.
(ii) The use of family ties as part of the workings of micro-credit policies can be extremely useful: 65% of Rocinha poor entrepreneurs are married or have a not legalized matrimony (união livre), 80% have sons, 38% receive family support in terros of family members work (mainly spouses (20%), sons (16%». 77% of Rocinha entrepreneurs do not count with the help of employees in their enterprises, besides family members.
6 Barros, et.al. (1998) estimate that e/iminating unemployment would have reduced headcount poverty in
September 1995 by merely 2-3 percentage points from 28.2% to 25.4% using a poverty line ofR$50 per month, and from 40.1% to 37.2% using a poverty line of R$75 per month. The debate on unemployment should not distract attention from the much larger problem of poverty in Brazil.
7 In addition, 318,604 people are estimated to live in irregular subdivisions, where demarcated lots have
•
•
-,
(üi) Systems to check income leveIs and physical assets used as collateral or as indication of loans repaying potential should consider the family and not the individual as the basic unit. The use of the family, the basic cell of the social tissue, is an advantage not only in terms of measuring repayment potential but also because it constitutes the basic unit used to measure poverty and social welfare.
(iv) most ofthe credit used by Rocinha entrepreneurs was provided by friends (53%). Most of entrepreneurs that would like to contract loans have the following purposes in mind: increase their business (44%), open another business (26%), the acquisition of equipmentlmachines (15%) or merchandise stocks (9.3%),. The main barriers to credit perceived are: providing an income proof (10%), documents/legalization (10%), what may explain the predominance of credit between friends. This type of informal relationship should be taken into account in the design of credit contracts. In particular, the use of social collateral.
(v) Legalization is not perceived as an essential condition, since it represents only 1.6% ofthe
support perceived as necessary to expand small businesses. In this respect, the specific question on the legalization of business reveal that 49% of Rocinha' s micro-entrepreneurs would like to become legal and that only 17% have a CGC. Among the main motives
presented for not legalizing high taxes (22.4%) and lack of time (22%). In sum, the
imposition of legaIization requirements would probably reduce a lot the sample of able credit takers in Rocinha.
(vi) Information on discontinuity and seasonalities of business can be useful in the formulation ofpayment schedules implicit in credit contracts: 95% ofRocinha business are
done during the whole year. In terms of seasonal factors 46% consider sub-periods of the
Rio summer as the best time ofthe year oftheir business.
(vii) 53% ofRocinha micro-entrepreneurs consider that in general there are no product offer lacking in the community what may reflect a low growth potential of local markets. The main deficiencies perceived in Rocinha are: supermarkets (7.2%) , drug stores (3.3%) and banks (3.1%).
7.1.2 Perceptions about the importance of Credit arrangements in Rocinha
1. Most of the sources of funding used by rnicro-entrepreneurs to start their business are own savings (47%), firing fines (13% - FGTS etc.), family loans (7.1%), banks only represent 0.2% ofthe rnain sources used as seed money.
2. In this sense the birth ofmicro-enterprises is more related to previous savings than externaI
sources of funds. However, the lack of use of credit does not allow us to test if the lack of use of externaI loans results from a unsatisfied demand for credit or a lack of demand for credit. Nevertheless, financiai difficulties are presented in another question by one third of the 49% of entrepreneurs that reported that faced some sort of difficulty to start their business.