Voxel Based Morphometry Alterations in Mal
de Debarquement Syndrome
Yoon-Hee Cha1,2*, Shruthi Chakrapani2,3
1Laureate Institute for Brain Research, Tulsa, Oklahoma, United States of America,2University of California Los Angeles, Los Angeles, California, United States of America,3Semel Institute for Neuroscience and Human Behavior, Los Angeles, California, United States of America
Abstract
Background
Mal de debarquement syndrome (MdDS) is a disorder of chronic self-motion perception that occurs though entrainment to rhythmic background motion, such as from sea voyage, and involves the perception of low-frequency rocking that can last for months or years. The neu-ral basis of this persistent sensory perception abnormality is not well understood.
Methods
We investigated grey matter volume differences underlying persistent MdDS by performing voxel-based morphometry on whole brain and pre-specified ROIs in 28 individuals with MdDS and comparing them to 18 age, sex, and handedness matched controls.
Results
MdDS participants exhibited greater grey matter volume in the left inferior parietal lobule, right inferior occipital gyrus (area V3v), right temporal pole, bilateral cerebellar hemispheric lobules VIII/IX and left lobule VIIa/VIIb. Grey matter volumes were lower in bilateral inferior frontal, orbitofrontal, pregenual anterior cingulate cortex (pgACC) and left superior medial gyri (t = 3.0, p<0.005uncorr). In ROI analyses, there were no volume differences in the middle occipital gyrus (region of V5/MT) or parietal operculum 2 (region of the parietoinsular vestib-ular cortex). Illness duration was positively related to grey matter volume in bilateral inferior frontal gyrus/anterior insula (IFG/AI), right posterior insula, superior parietal lobule, left mid-dle occipital gyrus (V5/MT), bilateral postcentral gyrus, anterior cerebellum, and left cerebel-lar hemisphere and vermian lobule IX. In contrast, illness duration was negatively related to volume in pgACC, posterior middle cingulate gyrus (MCC), left middle frontal gyrus (dorso-lateral prefrontal cortex-DLPFC), and right cerebellar hemispheric lobule VIIIb (t = 3.0, p<0.005uncorr). The most significant differences were decreased volume in the pgACC and increased volume in the left IFG/AI with longer illness duration (qFDRcorr<0.05). Concurrent medication use did not correlate with these findings or have a relationship with duration of ill-ness. MdDS participants showed positive correlations between grey matter volume in pgACC and bilateral cerebellar lobules VIII/IX, which was not seen in controls.
OPEN ACCESS
Citation:Cha Y-H, Chakrapani S (2015) Voxel Based Morphometry Alterations in Mal de Debarquement Syndrome. PLoS ONE 10(8): e0135021. doi:10.1371/ journal.pone.0135021
Editor:Marco Iacoboni, UCLA, UNITED STATES
Received:May 8, 2015
Accepted:July 16, 2015
Published:August 7, 2015
Copyright:© 2015 Cha, Chakrapani. This is an open access article distributed under the terms of the Creative Commons Attribution License, which permits unrestricted use, distribution, and reproduction in any medium, provided the original author and source are credited.
Data Availability Statement:Data are available from the Harvard Dataverse:http://dx.doi.org/10.7910/ DVN/GUFVEY
Conclusions
Individuals with MdDS show brain volume differences from healthy controls as well as dura-tion of illness dependent volume changes in (a) visual-vestibular processing areas (IPL, SPL, V3, V5/MT), (b) default mode network structures (cerebellar IX, IPL, ACC), (c) salience network structures (ACC and IFG/AI) (d) somatosensory network structures (postcentral gyrus, MCC, anterior cerebellum, cerebellar lobule VIII), and (e) a structure within the cen-tral executive network (DLPFC). The identification of these associations may enhance future investigations into how exposure to oscillating environments can modulate brain function and affect motion perception as well cognitive and affective control.
Introduction
Awareness of body position and agency of motion are fundamental not only to the production of movement but also to spatial cognition, memory, and emotive processes [1–3]. Understand-ing which brain networks are involved in drivUnderstand-ing a false sense of body motion may illuminate the anatomical connections that underlie many disorders of spatial perception and postural control that have cognitive and affective features [4–6].
A useful model to study brain structures involved in abnormal self-motion perception is a dis-order termedmal de debarquement syndrome(MdDS). MdDS is a disorder of intractable percep-tion of self-mopercep-tion that occurs after prolonged exposure to oscillating environments such as occurs during sea travel [7]. Unlike common forms of landsickness, the rocking and swaying sen-sations that occur in MdDS can last for months or years leading to significant morbidity [8]. There is currently no explanation for why the common experience of post-motion rocking dizzi-ness does not go away in some individuals. Relevant clinical features are that MdDS typically affects middle-aged individuals and is more common in women [7]. People experiencing MdDS represent a unique subject group in which to study brain volume changes associated with motion perception because their symptoms are chronic, they occur in the absence of central or peripheral vestibular injury, and the affected individuals are otherwise physically healthy [7,9,10].
Voxel based morphometry (VBM) is a technique used to make voxel-by-voxel comparisons of segmented grey matter volume or concentration differences and can be useful in showing brain volume changes in chronic illnesses that are not evident in clinical scans [11]. Brain vol-ume changes secondary to peripheral vestibular nerve injury such as occurs in vestibular neuri-tis or acoustic neuroma resection have been shown to occur in motion sensitive area V5/MT, inferior parietal lobule, posterior insula, and posterior hippocampus [12,13]. Though these examples of central compensation after peripheral injury are helpful starting points in under-standing where perception of body motion is processed, they may be difficult to study to understand chronic ongoing motion illusions because of their associated hearing and eye movement abnormalities, continuously changing central compensatory processes and the lim-ited duration of the motion illusion.
One approach to identifying which neural substrates might be affected in the process of motion entrainment that leads to MdDS is to examine brain volume changes. Here, VBM was used to identify structural changes in grey matter to better delineate the neural basis of MdDS. An ancillary question addressed in this investigation was whether grey matter volume in spe-cific areas correlated with a longer history of MdDS. We further determined whether brain vol-umes within the identified structures correlated differently in MdDS and if there were any associations with the kinds of medications that are used to treat MdDS.
Group Companies Charitable Foundation, William M. and Linda R. Dietel Philanthropic Fund, and Northstar Fund. Research reported in this publication was also partially supported by the National Center for Research Resources and by the Office of the Director of the National Institutes of Health under award numbers C06RR012169, C06RR015431 and S10OD011939. The content is solely the
responsibility of the authors and does not necessarily represent the official views of the National Institutes of Health. The funders had no role in study design, data collection and analysis, decision to publish, or preparation of the manuscript.
Competing Interests:The authors have declared
Materials and Methods
Subject Recruitment
The Institutional Review Board of the University of California Los Angeles, specifically Medical IRB 3, which oversees neuroscience research, approved all study procedures, which were per-formed according to the Declaration of Helsinki guidelines. Participants provided written informed consent.
Participants with a history of unambiguous motion-triggered symptoms of MdDS were recruited by advertisement through the MdDS Balance Disorders Foundation website (www. mddsfoundation.org) or through a database of patients diagnosed with MdDS at the investiga-tor’s institution. Inclusion into the study required: 1) a typical history of chronic rocking dizzi-ness occurring within two days of disembarking from a moving vessel such as from sea, air, or land-based travel; and 2) symptoms lasting at least three months without any other cause found after evaluation by a neurologist or otolaryngologist. Participants without a history of clear motion triggered rocking dizziness or a history that was otherwise suggestive of peripheral vestibular nerve injury were excluded. Healthy control participants were selected based on a negative history for any form of dizziness or imbalance. They were proportionately matched for age, sex, and handedness. All participants were required to be normotensive (blood pres-sure<140/90 and pulse 60–100 beats per minute) and to pass a screening neurological exami-nation. Because of hemispheric structural asymmetry driven by handedness, only right-handed participants were included. All participants were scanned on the same MRI scanner between June 2009 and November 2012 on the same protocol.
MRI Imaging
Structural scans. Participants were scanned on a Siemens Magnetom Trio 3Tesla scanner with a 12-channel head coil at the Ahmanson-Lovelace Brain Mapping Center (Los Angeles, CA.). Specifications for Magnetization Prepared Rapid Acquisition Gradient Echo imaging were as follows: 192 slices at 1mm slice thickness, voxel size: 1.0mmx1.0mmx1.0mm, field of view: 256mm, flip angle: 9 degrees, repetition time (TR) = 1900ms, echo time (TE) = 3.25ms.
VBM Analysis
Because of normalization artifacts from whole brain volume processing that can disproportion-ately affect the cerebellum, we separdisproportion-ately analyzed cerebral versus cerebellar structures.
was performed to remove any outliers that were above or below two standard deviations of the mean brain volume.
Cerebellar VBM. We used the spatially unbiased atlas template of the cerebellum and brainstem (SUIT) version 2.7 in order to precisely localize foci within the cerebellum [16,17]. SUIT uses a higher resolution template of the cerebellum for normalization than the standard SPM T1 template and provides localization into 28 distinct cerebellar regions. Whole brain images previously aligned along the AC-PC axis were subjected to the isolation procedure under SUIT, which separates the cerebrum from the cerebellum based on cortical grey matter thickness. Visual inspection confirmed high quality isolation. Normalization with DARTEL to the standard SUIT template was performed followed by re-slicing into 1x1x1mm voxels and smoothing with a 4mm FWHM isotropic kernel. A smaller smoothing kernel was used for the cerebellum than the cerebrum since cerebellar architecture is more homogeneous than the cerebrum. Modulated images corrected for individual brain volumes were used.
Statistical Analyses. Whole brain voxel-by-voxel comparison between MdDS participants and controls was performed with an unpaired two-sample t-test assuming independent sam-ples and unequal variances thresholded at a t value of 3.0 and extent of 30 voxels in the cere-brum and 10 voxels in the cerebellum. These were the effect sizes that we wished to see. For contrast images, this translates to apvalue<0.005 with 40 degrees of freedom. For the multiple regression analysis, this translates to apvalue<0.005 with 21 degrees of freedom. We did not correct for whole brain voxel number since many of the areas in our results have been shown to be in functionally related regions and we would have risked overcorrecting the data. Covari-ates included age and total grey matter volume. Because of an initial finding of prefrontal vol-ume decrements in MdDS, we also added anxiety (HADA) and depression (HADD) subscores of the Hospital Anxiety and Depression Scale (HADS) as additional covariates in our final analysis to control for volume differences that could be due to depression or anxiety [18]. In order to determine whether brain volume changes correlated with length of illness, we per-formed a multiple regression analysis using duration of illness in months.
Since brain volume changes could be related to the use of medications, we determined which medications were used differently between MdDS participants and controls. We then performed an ANOVA using the number of medications found to be different between the two groups as the number of factors with each factor having two levels.
Peak voxels from the contrast images between MdDS vs Controls as well as those deter-mined by regression for duration are presented in Montreal Neurologic Institute coordinates with localization determined by the Jülich atlas version 2.0 [19]. Anatomical labels are provided for all foci and probabilistic functional labels are provided in parentheses, when available. Mean volume in clusters with a corrected false detection rate (FDR) significance of p<0.05 were extracted to determine whether there were correlations with duration of illness or the use of certain medications.
V5/MT and OP2 ROIs. ROIs were created for areas V5/MT (human extrastriate region hOC5) and OP2 (the human parietal operculum region 2, the anatomical center of the parie-toinsular vestibular cortex) according to the Jülich probabilistic atlas [19–22]. Mean volumes were extracted using the MarsBaR tool [23].
Results
symptoms ranged from 3–240 months. If the outlier of 240 months was excluded, the mean duration was 35.7+/-28.7 months with a median of 24 months. All but one subject had both brain MRIs and vestibular function testing available through previous clinical evaluations, which were normal in all cases. These evaluations came as part of their medical records and source data (e.g. actual tracings) were not available. MdDS individuals had higher ratings of anxiety (HADA 8.35+/-4.19) and depression (HADD 6.43+/-3.95) than healthy comparison participants (HADA 3.83+/-3.73, p<0.001, HADD 1.22+/-1.40, p<0.001).
There were no major central lesions such as evidence of prior ischemia or tumors in any of the images acquired as part of this study. After a sample homogeneity test on the VBM data, one scan from the MdDS group was identified as a significant outlier, given a total grey matter volume exceeding two standard deviations from the mean. This sample, from a female subject, was removed from the analysis. Subsequent analyses on contrast images were performed on 28 MdDS and 18 Control participants. The participant with symptoms lasting 240 months was removed from the regression analysis for duration since this was over three standard deviations from the mean for duration and would have created too much leverage effect.
MdDS and Control contrasts
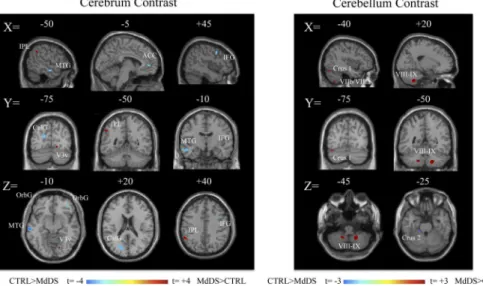
Relative increases in brain volume were seen in the MdDS participants in the left inferior parie-tal lobule (IPL), right ventral occipiparie-tal lobe, and right temporal lobe. Relative decreases were seen primarily in orbital and frontal regions, most notably in the pregenual region of the ante-rior cingulate cortex (pgACC) (Fig 1,Table 1). Grey matter was relatively increased in the cau-dal cerebellum in hemispheric lobules VIIIb and IX bilaterally as well as in left Crus I, VIIa and VIIIa in MdDS participants while a relative decrease was only seen in a small portion of left cerebellar Crus II (Fig 1,Table 2).
Multiple regression for duration
Twenty-seven participants were entered into a multiple regression analysis to determine which brain regions varied in volume with respect to duration. As a function of duration, grey matter
Fig 1. Contrast images of grey matter volume differences between MdDS and controls shown at a threshold of t = 3.0, extent voxels 30 for cerebrum and 10 for cerebellum.Blue scales images represent areas with higher volume in Controls; red areas represent higher volumes in MdDS participants. Scale values are in t score. Coordinates are in MNI space.
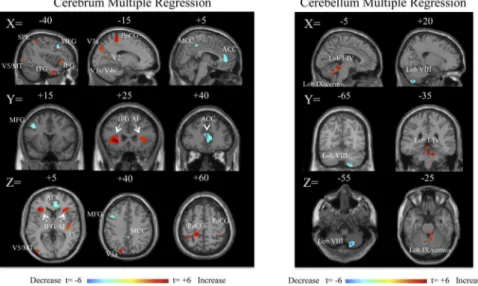
volume increased in bilateral inferior frontal gyrus/anterior insular (IFG/AI) cortex, right pos-terior insula, superior occipital gyrus region (V3a), postcentral gyrus (somatosensory cortex), left middle occipital gyrus (V5/MT), superior parietal lobule (SPL), and the left temporal lobe (Fig 2,Table 3). In the cerebellum, grey matter volume increased primarily in the anterior (lobules I-IV) cerebellum, left hemispheric lobule IX, and vermian lobule IX (Fig 2,Table 3). Cerebral volume in the pgACC, posterior middle ACC, left middle frontal gyrus (region of dor-solateral prefrontal cortex, DLPFC), and, the right cerebellar lobule VIIIa/b decreased as a function of duration (Fig 2,Table 4). The left IFG/AI and the ACC volume changes surpassed a whole brain corrected FDR p<0.05 at the cluster level. Age showed no correlation with dura-tion (R2= 8.5x10⁻⁵). ROI analyses in areas V5/MT and OP2 did not reveal any differences in mean volume across the clusters: MdDS Left V5 = 0.433, CTRL Left V5 = 0.418, MdDS Right V5 = 0.430, CTRL Right V5 = 0.447, MdDS Left OP2 = 0.363, CTRL Left OP2 = 0.366, MdDS Right OP2 = 0.402, CTRL Right OP2 = 0.389, all p>0.2.
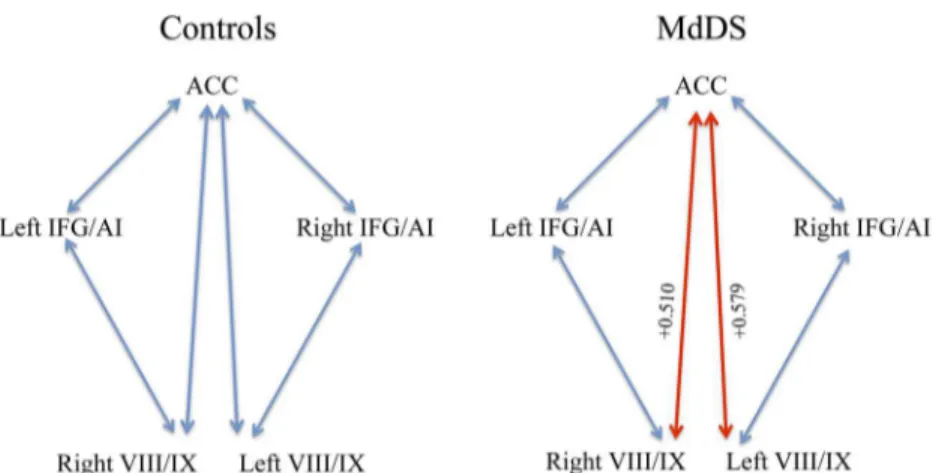
Mean volumes in areas of the most significant differences were extracted to determine the correlation coefficients relative to each other as well as to duration: pgACC, right and left IFG/ AI, and bilateral cerebellar VIII/IX. Notably pgACC volume was negatively correlated with duration with a correlation coefficient of -0.633, p<0.05 (corrected), indicating a moderately strong negative correlation. Both left and right IFG/AI volumes were positively correlated with duration with correlation coefficients of +0.440 and +0.427, respectively, p<0.05 (corrected). There was a high positive correlation between ACC and bilateral cerebellar VIII/IX volume in MdDS participants because both volumes decreased with duration.Fig 3shows the differences
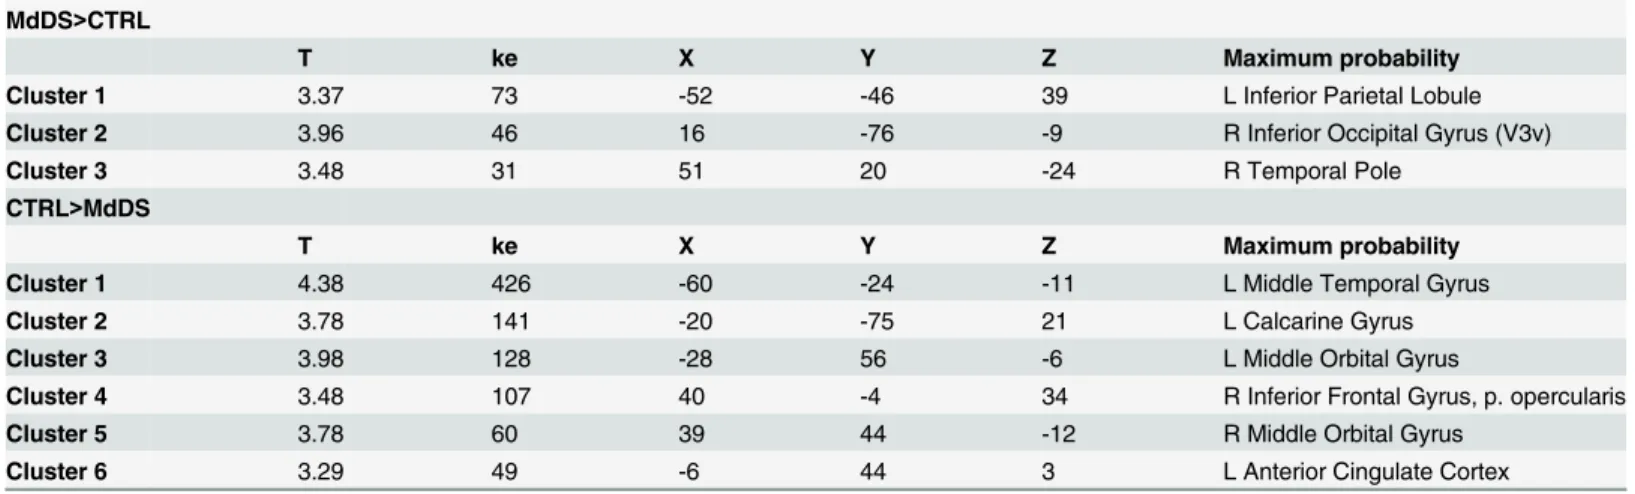
Table 1. Cerebral Contrasts.
MdDS>CTRL
T ke X Y Z Maximum probability
Cluster 1 3.37 73 -52 -46 39 L Inferior Parietal Lobule
Cluster 2 3.96 46 16 -76 -9 R Inferior Occipital Gyrus (V3v)
Cluster 3 3.48 31 51 20 -24 R Temporal Pole
CTRL>MdDS
T ke X Y Z Maximum probability
Cluster 1 4.38 426 -60 -24 -11 L Middle Temporal Gyrus
Cluster 2 3.78 141 -20 -75 21 L Calcarine Gyrus
Cluster 3 3.98 128 -28 56 -6 L Middle Orbital Gyrus
Cluster 4 3.48 107 40 -4 34 R Inferior Frontal Gyrus, p. opercularis
Cluster 5 3.78 60 39 44 -12 R Middle Orbital Gyrus
Cluster 6 3.29 49 -6 44 3 L Anterior Cingulate Cortex
doi:10.1371/journal.pone.0135021.t001
Table 2. Cerebellar Contrasts.
MdDS>CTRL
T ke X Y Z Maximum probability
Cluster 1 3.89 817 22 -50 -44 R Cerebellum, VIIIb and IX
Cluster 2 3.77 313 -19 -49 -44 L Cerebellum, VIIIb and IX
Cluster 3 3.62 240 -39 -59 -53 L Cerebellum, VIIb and VIIIa
Cluster 4 3.40 156 -38 -78 -20 L Cerebellum, VIIa Crus 1
CTRL>MdDS
T ke X Y Z Maximum probability
Cluster 1 3.24 13 -20 -83 -28 L Cerebellum, VIIa Crus 2
Fig 2. Multiple regression analysis for duration in months, shown at a threshold of t = 3.0, extent voxels 30 for cerebrum and 10 for cerebellum for 27 MdDS participants.Blue areas represent areas of lower volume in individuals with longer duration of illness; red areas represent areas of higher volume in individuals with longer duration of illness. Scale values are in t scores. Coordinates are in MNI space.
doi:10.1371/journal.pone.0135021.g002
Table 3. Multiple Regression: Positive Correlation with Duration.
Cerebrum
T ke X Y Z Maximum probability
Cluster 1 6.29 947 -26 30 -3 L Inferior Frontal Gyrus, p. orbitalis
Cluster 2 5.10 709 -15 -37 61 L Postcentral Gyrus
Cluster 3 5.60 384 -18 -81 36 L Superior Occipital Gyrus (V3a)
Cluster 4 4.08 334 27 24 4 R Inferior Frontal Gyrus, p. orbitalis
Cluster 5 3.93 302 40 -21 7 R Heschls Gyrus/ Insula Ig1/Ig2
Cluster 6 4.87 279 26 -72 19 R Cuneus
Cluster 7 4.07 241 -51 -12 -26 L Inferior Temporal Gyrus
Cluster 8 4.65 197 -56 -21 0 L Middle Temporal Gyrus
Cluster 9 4.52 187 51 -25 54 R Postcentral Gyrus
Cluster 10 4.13 174 -40 -45 57 L Superior Parietal Lobule
Cluster 11 4.26 135 -46 -4 -15 L Middle Temporal Gyrus
Cluster 12 4.34 109 -40 2 -33 L Inferior Temporal Gyrus
Cluster 13 3.55 100 21 -58 10 R Calcarine Gyrus (V1/V2)
Cluster 14 3.53 53 -42 -85 4 L Middle Occipital Gyrus (V5/MT)
Cluster 15 3.45 42 -33 -9 -23 L Amygdala (lateral basal)
Cluster 16 3.91 38 -46 12 12 L Inferior Frontal Gyrus, p. triangularis
Cluster 17 3.58 38 -15 -82 -2 L Lingual Gyrus (V3v/V4v)
Cluster 18 3.28 35 -16 -63 13 L Calcarine Gyrus (V2)
Cluster 19 3.51 31 46 0 -11 R Temporal Pole
Cerebellum
T ke X Y Z Maximum probability
Cluster 1 4.52 108 -6 -38 -17 L Lobule I IV, hemisphere
Cluster 2 5.03 49 8 -50 -27 R Lobule I-IV, hemisphere
Cluster 3 5.96 44 -6 -56 -23 Not assigned, hemisphere lobule V likelihood 1%
Cluster 4 6.03 41 14 -34 -27 R Lobule I-IV, hemisphere
Cluster 5 4.35 13 -6 -58 -31 L Lobule IX/Vermis IX
in volume correlations in MdDS relative to controls for correlations significant to p<0.05. All other correlations were not significant after Bonferroni correction for multiple comparisons.
The use of the following major classes of medications was assessed: selective serotonin reup-take inhibitors (SSRIs), tricyclic amines, benzodiazepines, anticonvulsants, triptans, beta block-ers, calcium channel blockblock-ers, ACE inhibitors and angiotensin blockblock-ers, hormone replacement, thyroid replacement, vitamins, and statins. Only the use of SSRIs (p<0.05) and benzodiaze-pines (p<0.001) were significantly different between the two groups. This is expected because these are the main classes of medications that have been shown to be symptomatically effective for MdDS [10]. A 2x2 ANOVA with SSRI and benzodiazepines (factor = drug class,
level = present or not present) was performed for duration, ACC, and left IFG/AI volumes. There was no significant effect of the use of these medications either on the duration of illness or the volumes of these areas (Table 5).
Discussion
This study shows that there are grey matter volume differences in brain areas involved in pro-cessing somatosensory and spatial information as well as those that mediate awareness of inter-oception and attentional control in individuals with MdDS. The general pattern of primary brain volume increases seen were in sensory association areas such as IPL and SPL and func-tional areas V5/MT and area V3v as well as cerebellar lobes VIII and IX which are related to the somatosensory network and the default networks, respectively. As a function of duration of
Table 4. Multiple Regression: Negative Correlation with Duration.
Cerebrum
T ke X Y Z Maximum probability
Cluster 1 6.40 640 2 40 13 R Anterior Cingulate Cortex
Cluster 2 4.83 221 -42 15 43 L Middle Frontal Gyrus
Cluster 3 3.98 105 3 -40 45 R and L Middle Cingulate Cortex
Cluster 4 5.16 39 -2 40 13 L Anterior Cingulate Cortex
Cerebellum
T ke X Y Z Maximum probability
Cluster 1 6.24 165 18 -66 -55 R Lobule VIIIb/VIIIa, hemisphere
doi:10.1371/journal.pone.0135021.t004
Fig 3. Pearson’s correlation coefficients between nodes with the most significant volume changes with time.Blue lines signify relationships that are not significant. The red lines are correlations at<0.05.
illness, grey matter volume significantly decreased in ACC while increasing in bilateral IFG/AI, important hubs of the salience network involved mediating interoceptive awareness and in reg-ulating limbic activity [24].
Role of the anterior cingulate cortex
The ACC is composed of a dorsal division that is functionally related to the evaluation and response to stimuli with rich connectivity to lateral prefrontal cortex whereas the ventral ACC functions to regulate limbic activity through its connections to the amygdala, periaqueductal grey, and the hypothalamus [25,26]. In our study, the specific region of the ACC with differen-tial volume was the pregrenual ACC (pgACC), which is functionally considered part of the ventral-rostral group. The pgACC plays a role in emotional conflict regulation, the extinction of conditioned fear, and in the planning of responses to future threats; activations have been associated with decreased amygdala responses [27–30].
Role of the inferior frontal gyrus/anterior insular cortex
Paired with the decrease in pgACC volume with duration of illness was an increase in volume of a frontoinsular area that included both the inferior frontal gyrus and the anterior insula (IFG/AI). Objective sensory percepts such as of hot and cold stimuli are processed in the poste-rior insula whereas subjective awareness and evaluation of those stimuli are mediated in the anterior insula (AI) [31,32]. It is hypothesized that the AI harbors a representation of the feel-ings associated with body movements. A model has been proposed for a posterior-to-anterior pathway of sensory integration that progressively incorporates environmental, emotional, and cognitive factors until a global percept of an experience is finally developed in the AI [33].
The ACC, along with the AI, amygdala, and the hypothalamus are part of the“salience” net-work, which serves to reorient attention to functionally relevant internal and external stimuli [34]. ACC and AI along with DLPFC and posterior parietal cortex are also part of the cognitive control network [35]. Our data showed duration related volume decreases in the left middle fron-tal gyrus, the region of the DLPFC, indicating that both a cognitive network and an emotional regulation network are affected in MdDS. The decrease in left DLPFC volume with increasing duration is consistent with our previous finding that excitatory repetitive transcranial magnetic stimulation (rTMS) over the left DLFPC can acutely decrease the intensity of the rocking percep-tion in MdDS but that the likelihood of response to rTMS decreases as a funcpercep-tion of durapercep-tion of illness [36]. Hubs that are common to multiple networks may be points through which emotional and cognitive information can influence each other. The volume differences found in this study of two such important hubs may be relevant to why patients with MdDS often note severe cogni-tive and affeccogni-tive control problems associated with the motion perceptions [37].
Studies of emotional awareness typically show concurrent activation of ACC and AI, whether the emotion is positive or negative but there are notable instances when ACC and AI activations are dissociated. In particular, tasks requiring time estimation, attention to rhythm,
Table 5. Association between SSRI and benzodiazepine use with duration and volume changes.
Duration ACC Left IFG/AI
F (2,27) F-ratio pvalue F-ratio pvalue F-ratio pvalue
SSRI 0.022 0.884 0.198 0.660 0.103 0.751
Benzodiazepines 0.799 0.381 1.324 0.262 2.462 0.130
SSRI x Benzodiazepines 3.711 0.067 0.004 0.951 1.230 0.279
and body movements that do not involve agency i.e. the sense that one is generating the move-ment, are associated with activation of AI without activation of ACC [38–40]. These differences may be pertinent to MdDS since ACC and IFG/AI volume showed an inverse relationship rela-tive to duration in our data and the trigger that causes MdDS is one of rhythmic motion. The caveat to this interpretation, however is that brain activity and volume are not necessarily correlated.
Role of the cerebellum
Cerebellar volume changes in hemispheric lobes VIIIa/b and IX (along with vermian lobule IX to which it projects) in these data are consistent with the cerebral volume changes that were seen in bilateral primary sensory cortex and ACC. Cerebellar lobule VIII is considered part of the secondary motor representation within the cerebellum being functionally connected to pre-motor cortex; the primary pre-motor representation is within lobules I-IV, which are connected to primary motor cortex [41]. Cerebellar lobule IX has strong functional connectivity with the default mode network [41,42]. Our regression analysis showed increased volume in the ante-rior cerebellum with duration but was contrasted by decreased volume in the right cerebellar VIIIa/b. One factor explaining this difference might be that the right lobule VIII has the dis-tinction of being the only lobule within the cerebellum to have intrinsic activity negatively cor-related with every section of the precuneus, a region that has rich connections to somatomotor cortex and hubs within the default mode network; the precuneus is involved in visuospatial processing, attention, and memory [43,44]. Therefore, lobule VIII may have additional influ-ence on cerebral networks outside of its role in the motor system perhaps by its influinflu-ence on the default mode network. This interpretation would be consistent with the increased volume also seen in lobules IX. Volumes in cerebellar lobules VIII/IX and ACC were positively corre-lated in MdDS participants but not in Controls though overall VIII/IX volume was higher and ACC volume was lower in MdDS subjects. The most straightforward explanation for this dis-crepancy would be that VIII/IX maybe higher in individuals with MdDS at baseline before the onset of their disorder (perhaps a risk factor) but that volume decreases with time in parallel with a decrease in ACC volume, perhaps as a compensatory process. Only a longitudinal study could verify this possibility.
The cerebellum is situated to make important contributions to major resting state brain net-works. Converging sensory input into the cerebellum allows it to be part of the process of mak-ing predictions about future sensory experiences, allowmak-ing predictable future events to be cancelled out in order to highlight unpredictable functionally relevant information [45]. This process is particularly important when in an oscillating environment. A model for rhythmic sensory input needs to be made in order to release repetitive postural adjustment strategies from conscious perception or to make an efference copy that cancels out the afferent input in order to decrease attention to repetitive sensory stimuli [46]. This process is particularly rele-vant during sea travel in which the development of‘sea legs’(adaptation to the sea) is associ-ated with reduction in motion sickness. Our data shows that areas that are functionally connected to somatomotor regions, motor planning, and default mode networks within the cerebellum show volume changes in MdDS, a disorder in which feelings of motion occur at rest. Part of the adaptation to background oscillating motion may be to redefine a new baseline and the neural substrate for that may be alterations in the default network.
Role of area V5/MT
superior occipital gyrus did emerge as an area that increases in brain volume with increased duration of illness. We would therefore submit that it is not the primary driver of the motion perception but may become a more important contributor with time. Apparent motion elicited by illusory contours, imagined motion, and triggering illusions of self-motion can all activate V5/MT [47,48]. The enhanced functional connectivity between V5/MT and the entorhinal cor-tex (EC) found in our previous study suggests that there may be enhanced transfer of motion information to the EC from V5/MT or that motion information from V5/MT can more effi-ciently drive EC activity with time in MdDS [49].
Role of the parieto-insular vestibular cortex and other areas
We did not find volume differences in the parieto-insular vestibular cortex (PIVC), located in the parietal operculum (OP2). This area is considered to be the best candidate for a primary vestibular cortex, though clearly it is not a unimodal area [50,51]. The vestibular system has a widespread cortical representation, however and stimulation of multiple brain regions can trig-ger feelings of motion. Perceptions of non-spinning self-motion such as linear translation and oscillating motion (e.g. rocking and swaying) can be elicited by electrically stimulating the ACC and functionally connected areas like the precuneus and the frontal operculum [52,53]. In contrast, perceptions of rotation or tilting are more likely to be elicited by stimulating the posterior temporal lobe [53]. Therefore, our finding of altered volume in the pgACC and fron-tal opercular area (IFG) is more consistent with direct stimulation studies that elicit sensations of rocking motion rather than rotational vertigo. This may help explain why chronic rocking dizziness specifically is often associated with anxiety and affective disorders [4,5]. This was our rationale for using the HADS scores to regress out specific brain volume trends associated with high mood or anxiety scores.
Limitations
There are several limitations to our study. Brain volume differences may be due as much to compensatory processes as they may be direct drivers of the symptoms so we do not know whether the volume changes observed are a cause or an effect of the motion sensation; we have taken a snapshot of the affected individuals’brains at only one time point. A within-subject longitudinal study in which symptoms can be varied (such as with therapy) would be better positioned to determine the direction of brain volume changes as they pertain to symptom changes.
number of ROIs and performing small volume correction was going to risk missing the identi-fication of potentially significant brain areas.
Third, although we controlled for age, sex, and handedness, there were many other variables that we could not control such as how much lifetime motion exposure each group had experi-enced, e.g., the number of cruises or plane flights people with and without MdDS underwent. The latter would constitute an almost infinite number of permutations of type of travel, dis-tance, vessel, and age at exposure and was not practical for these analyses. Even if these data were ascertained, they would have been unverifiable.
Therefore, fourth, we only used duration for our regression analysis because it was the only truly reliable input variable, as opposed to severity or level of disability, as those are far too sub-jective. Factors related to duration are the most important to understanding why the symptom of rocking dizziness after motion exposure has a tendency to persist the longer it lasts [10].
Finally, we did not functionally define areas V5/MT or PIVC, which could be different between individuals and thus cancel out each other’s signals when analyzed as a group. Instead, we used maps of these regions that were carefully delineated in a well-established atlas. We only performed ROI analyses for the V5/MT and the PIVC since these are areas of exceptional interest for understanding motion perception and have been well-defined in the Jülich atlas. Future brain volume studies in MdDS may limit the analysis to specific brain areas also identi-fied in the present study, however.
Despite these caveats, the identification of major hubs of the saliency and default mode net-works as being altered in MdDS is consistent with some of the clinical features observed such as heightened sensitivity to environmental stimuli and the rocking dizziness predominantly being experienced when the individual is at rest but becoming nulled with re-exposure to pas-sive motion [10,54]. Volume reductions in prefrontal areas, particularly DLFPC, for example are consistent with problems with attention. MdDS as a disease model may thus be useful in understanding pathways involved in motion adaptation and ultimately in illuminating the association between disorders of self-motion perception and cognitive and affective symptoms. Identification of the relevant networks is important in deriving a more complete understanding of the process of body motion awareness and ultimately in identifying pathways through which to intervene for therapeutic purposes.
Acknowledgments
The authors thank Drs. Martin Paulus and Paul Hamilton for helpful critiques of earlier drafts of the manuscript. The authors are grateful for the generous support from the Brain Mapping Medical Research Organization, Brain Mapping Support Foundation, Pierson-Lovelace Foun-dation, The Ahmanson FounFoun-dation, Capital Group Companies Charitable FounFoun-dation, Wil-liam M. and Linda R. Dietel Philanthropic Fund, and Northstar Fund. Research reported in this publication was also partially supported by the National Center for Research Resources and by the Office of the Director of the National Institutes of Health under award numbers C06RR012169, C06RR015431 and S10OD011939. The content is solely the responsibility of the authors and does not necessarily represent the official views of the National Institutes of Health. The funding sources played no role in the conception, execution, analysis, or manu-script preparation of this study.
Author Contributions
References
1. Grünbauer WM, Dieterich M, Brandt T. Bilateral vestibular failure impairs visual motion perception even with the head still. Neuroreport 1998, Jun 1; 9(8):1807–10. PMID:9665605
2. Mast FW, Preuss N, Hartmann M, Grabherr L. Spatial cognition, body representation and affective pro-cesses: The role of vestibular information beyond ocular reflexes and control of posture. Front Integr Neurosci 2014; 8:44. doi:10.3389/fnint.2014.00044PMID:24904327
3. Hüfner K, Hamilton DA, Kalla R, Stephan T, Glasauer S, Ma J, et al. Spatial memory and hippocampal volume in humans with unilateral vestibular deafferentation. Hippocampus 2007; 17(6):471–85. PMID: 17397043
4. Staab JP, Ruckenstein MJ. Expanding the differential diagnosis of chronic dizziness. Arch Otolaryngol Head Neck Surg 2007, Feb; 133(2):170–6. PMID:17309987
5. Brandt T. Phobic postural vertigo. Neurology 1996; 46(6):1515–9. PMID:8649539
6. Best C, Eckhardt-Henn A, Tschan R, Dieterich M. Psychiatric morbidity and comorbidity in different ves-tibular vertigo syndromes. Results of a prospective longitudinal study over one year. J Neurol 2009, Jan; 256(1):58–65. doi:10.1007/s00415-009-0038-8PMID:19221849
7. Cha YH. Mal de debarquement. Semin Neurol 2009, Nov; 29(5):520–7. doi:10.1055/s-0029-1241038 PMID:19834863
8. Macke A, Leporte A, Clark BC. Social, societal, and economic burden of mal de debarquement syn-drome. J Neurol 2012, Jan 10; 259(7):1326–30. doi:10.1007/s00415-011-6349-6PMID:22231864 9. Brown JJ, Baloh RW. Persistent mal de debarquement syndrome: A motion-induced subjective
disor-der of balance. Am J Otolaryngol 1987; 8(4):219–22. PMID:3631419
10. Cha YH, Brodsky J, Ishiyama G, Sabatti C, Baloh RW. Clinical features and associated syndromes of mal de debarquement. J Neurol 2008, Jul; 255(7):1038–44. doi:10.1007/s00415-008-0837-3PMID: 18500497
11. Ashburner J, Friston KJ. Voxel-based morphometrythe methods. Neuroimage 2000; 11(6):805–21. PMID:10860804
12. zu Eulenburg P, Stoeter P, Dieterich M. Voxel-based morphometry depicts central compensation after vestibular neuritis. Ann Neurol 2010, Aug; 68(2):241–9. doi:10.1002/ana.22063PMID:20695016 13. Helmchen C, Klinkenstein JC, Krüger A, Gliemroth J, Mohr C, Sander T. Structural brain changes
fol-lowing peripheral vestibulo-cochlear lesion may indicate multisensory compensation. J Neurol Neuro-surg Psychiatry 2011, Mar; 82(3):309–16. doi:10.1136/jnnp.2010.204925PMID:20802221
14. Lancaster JL, Woldorff MG, Parsons LM, Liotti M, Freitas CS, Rainey L, et al. Automated talairach atlas labels for functional brain mapping. Hum Brain Mapp 2000, Jul; 10(3):120–31. PMID:10912591 15. Maldjian JA, Laurienti PJ, Kraft RA, Burdette JH. An automated method for neuroanatomic and
cytoarchitectonic atlas-based interrogation of fmri data sets. Neuroimage 2003, Jul; 19(3):1233–9. PMID:12880848
16. Diedrichsen J. A spatially unbiased atlas template of the human cerebellum. Neuroimage 2006, Oct 15; 33(1):127–38. PMID:16904911
17. Diedrichsen J, Balsters JH, Flavell J, Cussans E, Ramnani N. A probabilistic MR atlas of the human cerebellum. Neuroimage 2009, May 15; 46(1):39–46. doi:10.1016/j.neuroimage.2009.01.045PMID: 19457380
18. Zigmond AS, Snaith RP. The hospital anxiety and depression scale. Acta Psychiatr Scand 1983; 67 (6):361–70. PMID:6880820
19. Zilles K, Amunts K. Centenary of brodmann's map—conception and fate. Nat Rev Neurosci 2010, Feb; 11(2):139–45. doi:10.1038/nrn2776PMID:20046193
20. zu Eulenburg P, Caspers S, Roski C, Eickhoff SB. Meta-analytical definition and functional connectivity of the human vestibular cortex. Neuroimage 2012, Mar; 60(1):162–9. doi:10.1016/j.neuroimage.2011. 12.032PMID:22209784
21. Eickhoff SB, Amunts K, Mohlberg H, Zilles K. The human parietal operculum. II. Stereotaxic maps and correlation with functional imaging results. Cerebral Cortex 2006; 16(2):268. PMID:15888606
22. Malikovic A, Amunts K, Schleicher A, Mohlberg H, Eickhoff SB, Wilms M, et al. Cytoarchitectonic analy-sis of the human extrastriate cortex in the region of V5/MT+: A probabilistic, stereotaxic map of area hoc5. Cereb Cortex 2007, Mar; 17(3):562–74. PMID:16603710
23. Region of interest analysis using an SPM toolbox [abstract] presented at the 8th international confer-ence on functional mapping of the human brain, sendai, japan; 2002.
25. Etkin A, Egner T, Kalisch R. Emotional processing in anterior cingulate and medial prefrontal cortex. Trends Cogn Sci 2011, Feb; 15(2):85–93. doi:10.1016/j.tics.2010.11.004PMID:21167765
26. Etkin A, Schatzberg AF. Common abnormalities and disorder-specific compensation during implicit reg-ulation of emotional processing in generalized anxiety and major depressive disorders. Am J Psychiatry 2011, Sep; 168(9):968–78. doi:10.1176/appi.ajp.2011.10091290PMID:21632648
27. Mobbs D, Marchant JL, Hassabis D, Seymour B, Tan G, Gray M, et al. From threat to fear: The neural organization of defensive fear systems in humans. J Neurosci 2009, Sep 30; 29(39):12236–43. doi:10. 1523/JNEUROSCI.2378-09.2009PMID:19793982
28. Schiller D, Levy I, Niv Y, LeDoux JE, Phelps EA. From fear to safety and back: Reversal of fear in the human brain. J Neurosci 2008, Nov 5; 28(45):11517–25. doi:10.1523/JNEUROSCI.2265-08.2008 PMID:18987188
29. Egner T, Etkin A, Gale S, Hirsch J. Dissociable neural systems resolve conflict from emotional versus nonemotional distracters. Cereb Cortex 2008, Jun; 18(6):1475–84. PMID:17940084
30. Etkin A, Egner T, Peraza DM, Kandel ER, Hirsch J. Resolving emotional conflict: A role for the rostral anterior cingulate cortex in modulating activity in the amygdala. Neuron 2006, Sep 21; 51(6):871–82. PMID:16982430
31. Craig AD, Chen K, Bandy D, Reiman EM. Thermosensory activation of insular cortex. Nat Neurosci 2000, Feb; 3(2):184–90. PMID:10649575
32. Kong J, White NS, Kwong KK, Vangel MG, Rosman IS, Gracely RH, Gollub RL. Using fmri to dissociate sensory encoding from cognitive evaluation of heat pain intensity. Hum Brain Mapp 2006, Sep; 27 (9):715–21. PMID:16342273
33. Craig AD. How do you feel—now? The anterior insula and human awareness. Nat Rev Neurosci 2009, Jan; 10(1):59–70. doi:10.1038/nrn2555PMID:19096369
34. Seeley WW, Menon V, Schatzberg AF, Keller J, Glover GH, Kenna H, et al. Dissociable intrinsic con-nectivity networks for salience processing and executive control. J Neurosci 2007, Feb 28; 27(9):2349– 56. PMID:17329432
35. Cole MW, Schneider W. The cognitive control network: Integrated cortical regions with dissociable functions. Neuroimage 2007, Aug 1; 37(1):343–60. PMID:17553704
36. Cha YH, Cui Y, Baloh RW. Repetitive transcranial magnetic stimulation for mal de debarquement syn-drome. Otol Neurotol 2013, Jan; 34(1):175–9. doi:10.1097/MAO.0b013e318278bf7cPMID:23202153 37. Arroll M, Attree E, Cha Y, Dancey C. The relationship between symptom severity, stigma, illness
intru-siveness and depression in mal de debarquement syndrome (mdds). J Health Psychol 2014, Oct 20:1–12.
38. Platel H, Price C, Baron JC, Wise R, Lambert J, Frackowiak RS, et al. The structural components of music perception. A functional anatomical study. Brain 1997, Feb; 120 (Pt 2):229–43.
39. Livesey AC, Wall MB, Smith AT. Time perception: Manipulation of task difficulty dissociates clock func-tions from other cognitive demands. Neuropsychologia 2007, Jan 28; 45(2):321–31. PMID:16934301 40. Tsakiris M, Hesse MD, Boy C, Haggard P, Fink GR. Neural signatures of body ownership: A sensory
network for bodily self-consciousness. Cereb Cortex 2007, Oct; 17(10):2235–44. PMID:17138596 41. Buckner RL, Krienen FM, Castellanos A, Diaz JC, Yeo BT. The organization of the human cerebellum
estimated by intrinsic functional connectivity. J Neurophysiol 2011, Nov; 106(5):2322–45. doi:10.1152/ jn.00339.2011PMID:21795627
42. Habas C, Kamdar N, Nguyen D, Prater K, Beckmann CF, Menon V, Greicius MD. Distinct cerebellar contributions to intrinsic connectivity networks. J Neurosci 2009, Jul 1; 29(26):8586–94. doi:10.1523/ JNEUROSCI.1868-09.2009PMID:19571149
43. Bernard JA, Seidler RD, Hassevoort KM, Benson BL, Welsh RC, Wiggins JL, et al. Resting state cor-tico-cerebellar functional connectivity networks: A comparison of anatomical and self-organizing map approaches. Front Neuroanat 2012; 6:31. doi:10.3389/fnana.2012.00031PMID:22907994
44. Zhang S, Li C-SR. Functional connectivity mapping of the human precuneus by resting state fmri. Neu-roimage 2012; 59(4):3548–62. doi:10.1016/j.neuroimage.2011.11.023PMID:22116037
45. Sawtell NB, Bell CC. Cerebellum-Like structures. In: Handbook of the Cerebellum and Cerebellar Dis-orders. Springer; 2013. p. 1257–77.
46. Wolpert DM, Miall RC, Kawato M. Internal models in the cerebellum. Trends Cogn Sci 1998; 2(9):338– 47. PMID:21227230
48. Kovács G, Raabe M, Greenlee MW. Neural correlates of visually induced self-motion illusion in depth. Cereb Cortex 2008, Aug; 18(8):1779–87. PMID:18063566
49. Cha YH, Chakrapani S, Craig A, Baloh RW. Metabolic and functional connectivity changes in mal de debarquement syndrome. PLoS One 2012; 7(11):e49560. doi:10.1371/journal.pone.0049560PMID: 23209584
50. Dieterich M, Brandt T. Vestibular system: Anatomy and functional magnetic resonance imaging. Neuro-imaging Clin N Am 2001, May; 11(2):263–73, ix. PMID:11489739
51. Deutschländer A, Bense S, Stephan T, Schwaiger M, Brandt T, Dieterich M. Sensory system interac-tions during simultaneous vestibular and visual stimulation in PET. Hum Brain Mapp 2002, Jun; 16 (2):92–103. PMID:11954059
52. Wiest G, Zimprich F, Prayer D, Czech T, Serles W, Baumgartner C. Vestibular processing in human paramedian precuneus as shown by electrical cortical stimulation. Neurology 2004, Feb 10; 62(3):473– 5. PMID:14872035
53. Kahane P, Hoffmann D, Minotti L, Berthoz A. Reappraisal of the human vestibular cortex by cortical electrical stimulation study. Ann Neurol 2003, Nov; 54(5):615–24. PMID:14595651