Dual Origins of Dairy Cattle Farming – Evidence from a
Comprehensive Survey of European Y-Chromosomal
Variation
Ceiridwen J. Edwards1,2, Catarina Ginja3,4, Juha Kantanen5, Lucı´a Pe´rez-Pardal6, Anne Tresset7, Frauke Stock1, European Cattle Genetic Diversity Consortium", Luis T. Gama4
, M. Cecilia T. Penedo3, Daniel G. Bradley1, Johannes A. Lenstra8*, Isaa¨c J. Nijman8¤
1Smurfit Institute of Genetics, Trinity College Dublin, Dublin, Ireland,2Research Laboratory for Archaeology, University of Oxford, Oxford, United Kingdom,3Veterinary Genetics Laboratory, University of California Davis, Davis, California, United States of America,4Departamento de Gene´tica, Melhoramento Animal e Reproduc¸a˜o, Instituto Nacional dos Recursos Biolo´gicos, Fonte Boa, Vale de Santare´m, Portugal,5Biotechnology and Food Research, MTT Agrifood Research Finland, Jokioinen, Finland,6Area de Gene´tica y Reproduccio´n Animal, SERIDA, Gijo´n, Spain,7Arche´ozoologie, Arche´obotanique, Socie´te´s, Pratiques et Environnements, CNRS Muse´um National d’Histoire Naturelle, Paris, France,8Faculty of Veterinary Medicine, Utrecht University, Utrecht, The Netherlands
Abstract
Background:Diversity patterns of livestock species are informative to the history of agriculture and indicate uniqueness of breeds as relevant for conservation. So far, most studies on cattle have focused on mitochondrial and autosomal DNA
variation. Previous studies of Y-chromosomal variation, with limited breed panels, identified two Bos taurus (taurine)
haplogroups (Y1 and Y2; both composed of several haplotypes) and oneBos indicus(indicine/zebu) haplogroup (Y3), as well
as a strong phylogeographic structuring of paternal lineages.
Methodology and Principal Findings:Haplogroup data were collected for 2087 animals from 138 breeds. For 111 breeds,
these were resolved further by genotyping microsatellitesINRA189(10 alleles) andBM861(2 alleles). European cattle carry
exclusively taurine haplotypes, with the zebu Y-chromosomes having appreciable frequencies in Southwest Asian populations. Y1 is predominant in northern and north-western Europe, but is also observed in several Iberian breeds, as well as in Southwest Asia. A single Y1 haplotype is predominant in north-central Europe and a single Y2 haplotype in central Europe. In contrast, we found both Y1 and Y2 haplotypes in Britain, the Nordic region and Russia, with the highest Y-chromosomal diversity seen in the Iberian Peninsula.
Conclusions: We propose that the homogeneous Y1 and Y2 regions reflect founder effects associated with the development and expansion of two groups of dairy cattle, the pied or red breeds from the North Sea and Baltic coasts and the spotted, yellow or brown breeds from Switzerland, respectively. The present Y1-Y2 contrast in central Europe coincides with historic, linguistic, religious and cultural boundaries.
Citation:Edwards CJ, Ginja C, Kantanen J, Pe´rez-Pardal L, Tresset A, et al. (2011) Dual Origins of Dairy Cattle Farming – Evidence from a Comprehensive Survey of European Y-Chromosomal Variation. PLoS ONE 6(1): e15922. doi:10.1371/journal.pone.0015922
Editor:Toomas Kivisild, University of Cambridge, United Kingdom
ReceivedOctober 12, 2010;AcceptedNovember 29, 2010;PublishedJanuary 6, 2011
Copyright:ß2011 Edwards et al. This is an open-access article distributed under the terms of the Creative Commons Attribution License, which permits unrestricted use, distribution, and reproduction in any medium, provided the original author and source are credited.
Funding:CJE was supported by the Enterprise Ireland Basic Research Grants Programme (project numbers SC/1999/409 and SC/2002/510). CG was supported by a grant from Fundac¸a˜o Portuguesa para a Cieˆncia e a Tecnologia (Ref. SFRH/BD/13502/2003). JK was supported by the Academy of Finland and the Finnish Ministry of Agriculture and Forestry (SUNARE-program and ‘Russia in Flux’ program). LP-P was supported by grant BES-2006-13545. Collection of several samples was supported by the Resgen project 98–118 (1999–2002) funded by the European Union. This work was also part-funded by The Wellcome Trust (grant no. 047485/Z/96/Z), and a Eurocores OMLL Programme Grant via CNRS, France. The funders had no role in study design, data collection and analysis, decision to publish, or preparation of the manuscript.
Competing Interests:The authors have declared that no competing interests exist. * E-mail: J.A.Lenstra@uu.nl
¤ Current address: Genome Biology and Bioinformatics Group, Hubrecht Institute, Utrecht, The Netherlands
"For the full list of authors of this consortium, please see the Acknowledgments section.
Introduction
The history of human civilisations has left its footprint in the patterns of genetic variation of livestock species across and within continents [1,2,3,4]. Molecular markers, such as mitochondrial DNA (mtDNA) and autosomal polymorphisms, have been particularly useful in investigating the wild species origin of cattle and the subsequent genetic events that shaped the present pattern of genetic diversity. With regards to cattle in Europe, evidence indicates that: (i)
Balkan cattle act as reservoir of high genetic diversity [5]; (ii) there is a marked contrast between north and south Europe [6,7,8]; and (iii) central European breeds occupy a separate position relative to Mediterranean and northern European cattle [9].
Although the Fertile Crescent is considered the primary centre of taurine cattle domestication, evidence for independent domestica-tion events in other locals is currently debated [10,11,12, 13,14,15]. Ancestral taurine mtDNA lineages have been identified, and confirmed differences seen between northern and southern
European populations of wild cattle (aurochs): the B. primigenius haplogroup P was frequent in northern and central Europe [16], while distinct putative auroch matrilines (haplogroups Q and R) were found in modern southern European populations and it appears that these were sporadically introduced into domestic breeds [11,12]. MtDNA sequences also reveal that indicine cattle originated from a different wild aurochs population,Bos primigenius namadicus, in the Indus Valley approximately 8,000 years before present [17,18]. Differentiation of paternal lineages via analysis of Y-chromo-somal variation adds significantly to what can be inferred from mtDNA and autosomal variation [19]. The absence of interchro-mosomal recombination outside the pseudoautosomal region (PAR) preserves original arrangements of mutational events, and thus male lineages can be traced both within and among populations. Genetic drift is relatively strong due to the effective population sizes of Y-chromosomes being, at most, 25% of the autosomal effective population size [20]. Effective population size is often reduced further by the relatively high variability of male reproductive success. As a result, the Y-chromosome is a sensitive indicator of recent demographic events, such as population bottlenecks, founder effects and population expansions.
In several herd species, males are more mobile than females and compete for reproduction or, in the case of livestock, are selected on the basis of breeding objectives. So while mtDNA variants stay mostly within the herd, Y-chromosomal variants may reflect the origin of sires as influenced by introgression and upgrading. Indeed, in domestic cattle, a marked difference between the distributions of mitochondrial and Y-chromosomal components has been observed [16,21,22,23,24]. In an initial survey of European breeds, two haplogroups, Y1 and Y2, were found to be dominant in northern and southern Europe respectively [25]. Comparison of cattle Y-chromosome variation over time suggests that the frequency and distribution of these patrilines varied, which could be related with distinct breeding strategies [26]. In European aurochs, Y2 appears to be predominant [27], but so far it is unclear if there was significant introgression from wild bulls into domestic populations.
In the study of human male lineages, the use of Y-specific microsatellites has allowed for refined analyses of the genetic diversity of paternal lineages that can be found within major haplogroups [28,29]. Similarly, in cattle, microsatellite analysis has identified several Y-haplotypes in Portuguese [30], northern and eastern European [31], western-continental, British and Sub-Saharan Africa [14] breeds, as well as in American Creole [22] breeds. Even though different sets of markers were used in these studies, and each only partially covered the diversity pattern of the paternal lineages, they have confirmed that Y-markers exhibit a strong phylogeographic structure in cattle.
Here we report Y-haplotype data on 128 European, one African and nine Asian breeds, incorporating also data from the previous reports. This comprehensive study confirms a clear north-south contrast that is accentuated by a homogeneity of Y1 haplotypes in north-central Europe and of Y2 haplotypes in and around the Alpine region, both regions that are thought to be the origin of highly productive cattle breeds. This genetic boundary correlates with historic differences between northern and southern European cultures and we consider that this may have implications for the investigation of dairy QTL variation.
Results
Cattle haplogroups defined by Y-SNPs
For 238 males from 30 breeds, Y-chromosomal fragments comprising theZFY(1,219 bp and 1,003 bp),SRY(2,644 bp) and
DBY(also known asDDX3Y; 406 bp) genes were sequenced [32]. These sequences contained five mutational differences when compared to the zebu Y3 sequences [30], and all European animals carried either the Y1 or Y2 taurine haplogroups. Interestingly, comparison of the Y3 sequence with anSRY sequence from an Indian Sahiwal zebu (GenBank accession number AY079145) [33] revealed three additional differences downstream of the open-reading frame, indicating zebu-specific Y-chromosomal SNPs. In combination with a SNP inUYT19[14,22,25,31], three cosegregat-ing mutations differentiate the taurine Y1 and Y2 haplogroups (Table S1). A composite microsatellite inDBY[25], with one major allele in both Y1 and Y2 and only present in the Italian Maremmana, was not used for differentiation of haplotypes.
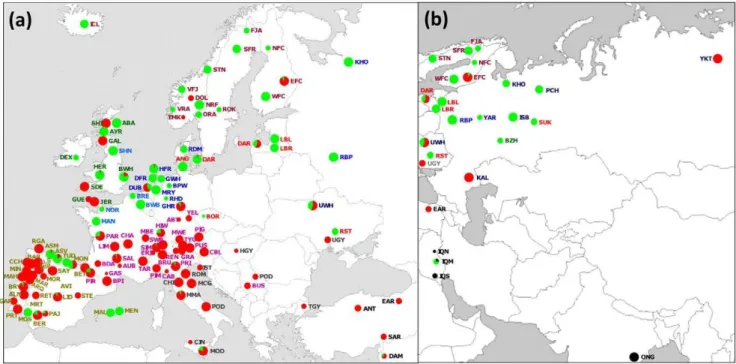
Genotypes of individual SNPs in other animals were combined with Y1-Y2 SNP data and resulted in Y1 or Y2 assignments of 2087 animals from 138 breeds (Table S1). The resulting dataset included previously published genotypic information for 1099 individuals from 78 breeds [14,22,31]. The Y3 haplogroup was identified on the basis of microsatellite information as described in the next section. The map ofFigure 1shows the geographical distribution of Y-haplogroups. The three haplogroups described in cattle (Y1, Y2 and Y3) were detected in Southwest Asia, but only Y3 was present in the two Indian breeds analysed, which is in agreement with their zebu morphology. Y1 was predominant in northern Europe and in a number of Iberian breeds. In contrast, Y2 was dominant in most central, Mediterranean and Iberian breeds, but was also found in several British and Nordic breeds. Although only a single African breed was included in this study, both Y1 and Y2 haplogroups were present.
Several of the breeds that do not confirm this northern Y1 – southern Y2 distribution pattern appear to have been subject to recent introgression from breeds with similar coat colour [34], but carrying the other Y-chromosomal haplogroup. Thus, Y2 was introduced in Dutch Belted (DUB) by crossbreeding with belted Galloway bulls. Danish Red bulls probably introduced Y1 into the Sicilian Modicana (MOD). The presence of Y1 in central dairy breeds, such as Simmental (SIM), Pezzata Rossa Italiana (PRI) and Hinderwald (HIW), is probably explained by crossbreeding with Red Holstein sires. Likewise, crossbreeding with Lowland Pied or English cattle probably accounts for the predominance of Y1 in Russian dairy cattle [35]. Y-chromosomes act as a single haplogroup and are, in general, homogeneous at the Y-chromosome variation level. In most cases, the presence of Y1 and Y2 haplotypes in a given breed can be explained by its recent history [14].
Cattle haplotypes detected through SNPs and microsatellites
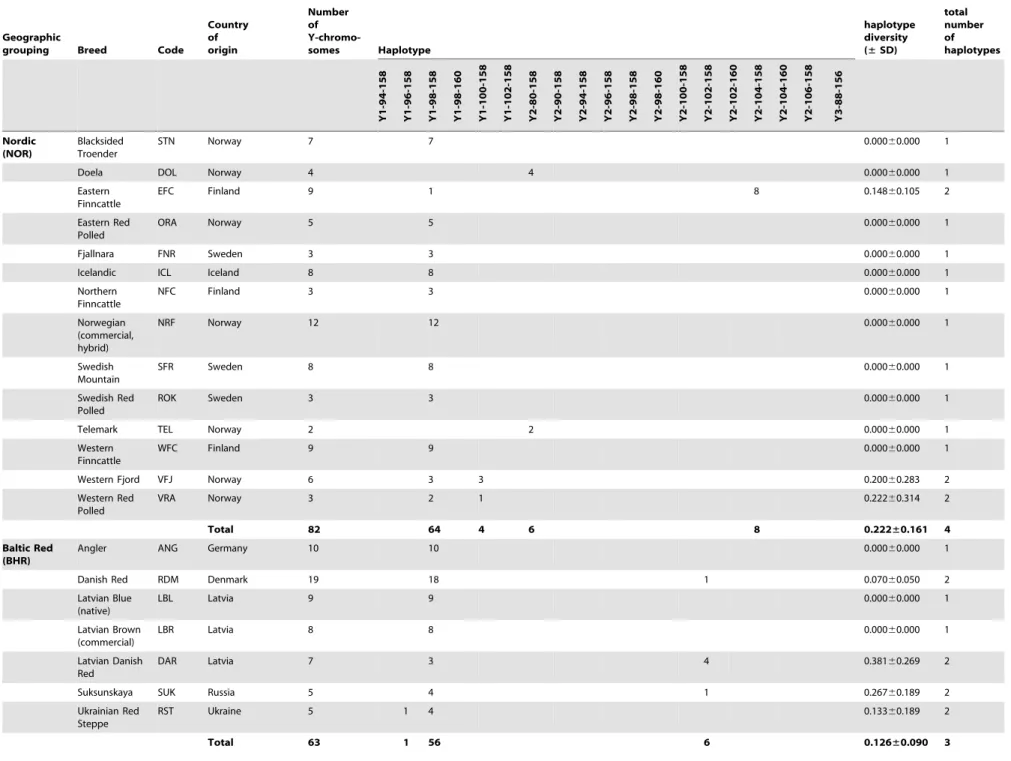
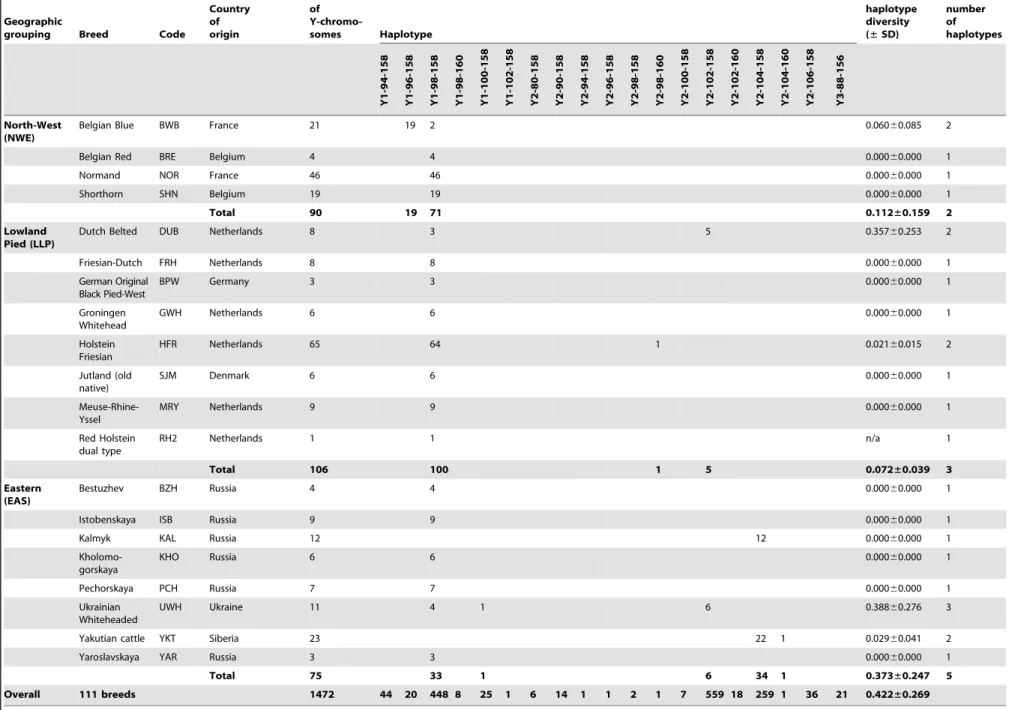
The diversity within each haplogroup was further assessed by genotypingINRA189 [36] andBM861 [37] Y-specific microsat-ellite markers. The combination of these data with previously published Y-chromosomal haplotypes [14,22,31] yielded haplo-types for a total of 1472 animals from 111 breeds, a subset of the individuals for which SNP information was available. Haplotype composition and absolute frequencies, as well as unbiased estimates of haplotype diversities with the associated standard deviations (SD) are shown for each breed and geographic group in Table 1. We found a total of 19 composite Y-haplotypes. The relationship between current haplotype nomenclatures is summa-rised inTable S2. LocusINRA189is the most informative marker with 10 alleles, differentiated among five Y1 and nine Y2 haplotypes. For 21 bulls belonging to the Indian and Southwest Asian breed groups, haplogroup Y3 was identified via the INRA189-88 bp allele. Microsatellite markerBM861 defines one
Y-Haplotype Distribution in European Cattle
additional Y1 and three Y2 additional haplotypes. Haplotype Y1-98-158 is the most frequent within the Y1 haplogroup and is detected in 82% of the animals from this haplogroup across all geographic breed groups with the exception of the Indian and Podolian. Within the Y2 haplogroup, Y2-102-158 and Y2-104-158 haplotypes account for 62% and 29% of the animals respectively. A map showing the distribution of Y-haplotypes is included inFigure S1.
Y-chromosomal diversity within breeds is low (mean of 0.4260.3) with fixed haplotypes in 65 out of 111 breeds (approximately 59%). Interestingly, the Southwest Asian breed group is the most genetically diverse, with a total of seven haplotypes detected in a limited sample of 24 animals, and an unbiased expected haplotype diversity of 0.5760.4 (Table 2). The Iberian and British groups have intermediate variability, with 11 and five haplotypes observed and diversities of 0.3460.2 and 0.4160.3 respectively.
Phylogeography of Y-haplotypes
The phylogenetic relationship among Y-haplotypes was inves-tigated after grouping the breeds into 12 regions on the basis of geography and/or phenotype [34,38]. These breed groups are in agreement with major clusters as defined by autosomal microsat-ellite (unpublished results; see alsoFigure S2) and SNP data [7]. Haplotype relationships are depicted inFigure 2by a median-joining (MJ) network obtained for the complete dataset, as well as by regional MJ networks defined for each of the 12 geographic breed groups. The MJ networks clearly differentiate the indicine Y3 patriline from the taurine Y1 and Y2 haplogroups. The regional networks depict the Y-chromosome diversity found in each region and the relationship among the observed haplotypes defined by the two microsatellites.
AMOVA results are presented in Table S3 and show a significant (P,0.0001) effect of geographical breed grouping, which accounted for 31% of the total variability. Approximately
51% (P,0.0001) of the Y-chromosome genetic variation was found among breeds within groups and 18% (P,0.0001) within breeds. This was confirmed by the generally high Y-chromosomal FSTvalues (Table S4) of all pairwise breed clusters, which were low mainly for the comparison of the dairy north-western European breed clusters.
InFigure S2, Y-chromosomal haplotypes have been indicated in a NeighborNet phylogenetic network of Reynolds’ distances based on 30 autosomal microsatellite data. This shows a clear consistency between Y-chromosomal variation and the breed relationships in the autosomal-based phylogeny, with only the British Y2 and Iberian Y1 cattle as major exceptions [as in 14,15].
Discussion
Differentiation of paternal lineages in European cattle We analysed Y-chromosomal haplotypes in a comprehensive sampling of European cattle. This allowed a differentiation of two SNP-based taurine haplogroups, which were resolved into 18 haplotypes using genotypes from two microsatellite markers. Locus INRA189appeared to be, by far, the most informative and, in combination with the other marker and SNPs, showed that paternal lineages strongly depend on geographic origin. A further differentiation was demonstrated by using other microsatellites [14,22,31]. For instance, BYM1 alleles defined a Y1-98-158 variant in Nordic cattle and a Y2-102-158 variant in Spain [14], whileDYZ1detected a different Y2-102-158 variant in Southwest Asian breeds [31].
Distribution of zebu and taurine haplotypes
Previous genetic studies have demonstrated a separation of the mitochondrial [39,40,41], Y-chromosomal [25,42,43] and nuclear [21] DNA from taurine and zebu cattle, which supports independent domestications in the Fertile Crescent and Indus valley respectively [44]. In a diverse panel of 2009 European cattle, we exclusively found taurine Y-chromosomal haplotypes. Figure 1. Geographical distribution of Y-haplogroups.(a) Europe, and (b) Eurasia. Green = Y1; red = Y2; black = Y3. Abbreviations of breed names are given in Table 1.
doi:10.1371/journal.pone.0015922.g001
Y-Haplotype Distribution in European Cattle
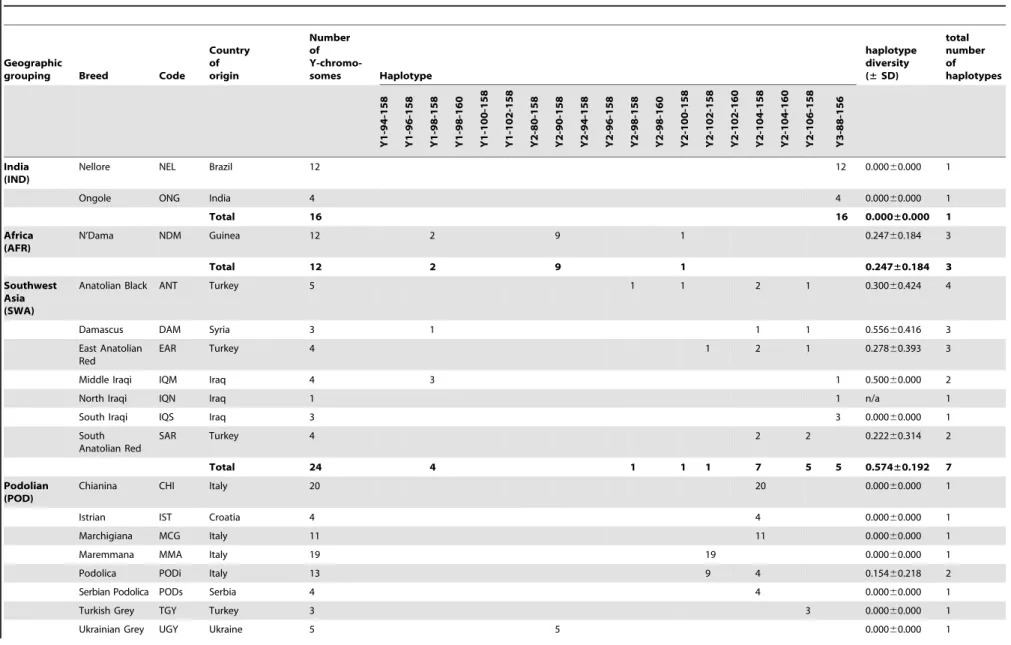
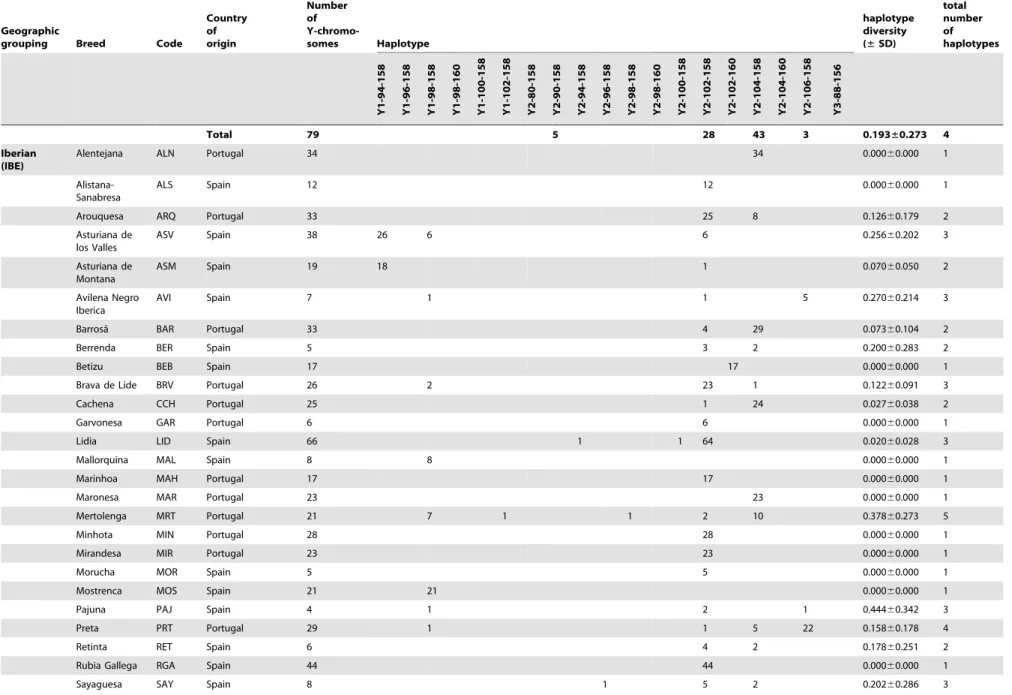
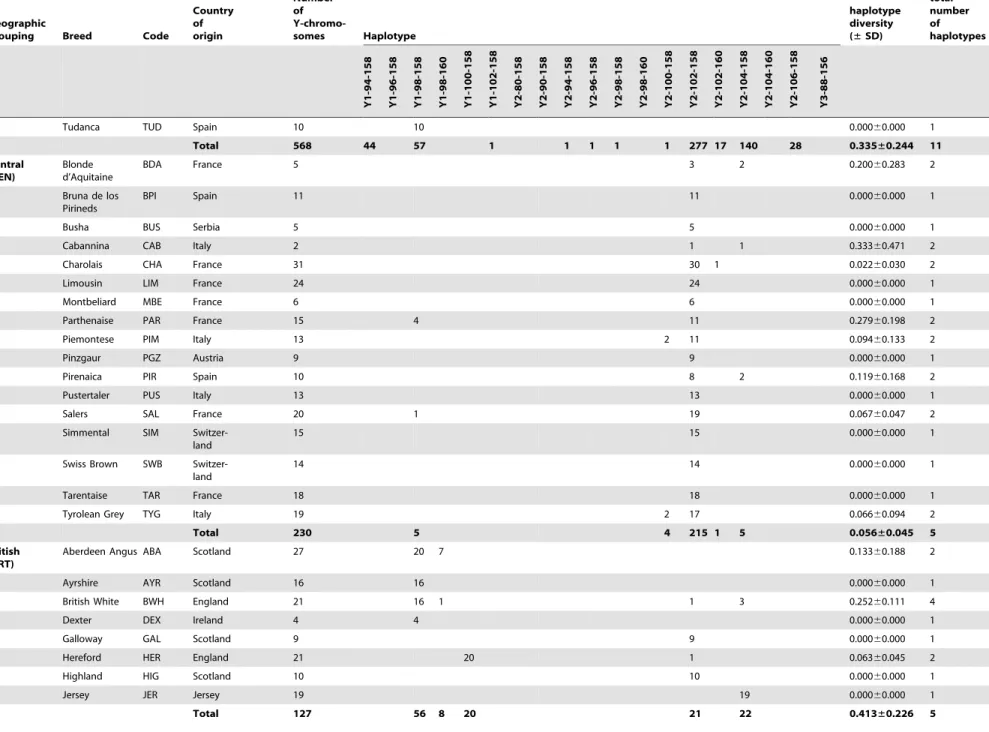
Table 1.Breed information, including geographical grouping, for the 111 cattle breeds sampled as part of this study, and associated haplotypic data (defined as SNP-INRA189 -BM861) and diversity values.
Geographic
grouping Breed Code
Country of origin
Number of
Y-chromo-somes Haplotype
haplotype diversity (±SD)
total number of haplotypes
Y1-94-158 Y1-96-158 Y1-98-158 Y1-98-160 Y1-100-158 Y1-102-158 Y2-80-158 Y2-90-158 Y2-94-158 Y2-96-158 Y2-98-158 Y2-98-160 Y2-100-158 Y2-102-158 Y2-102-160 Y2-104-158 Y2-104-160 Y2-106-158 Y3-88-156
India (IND)
Nellore NEL Brazil 12 12 0.00060.000 1
Ongole ONG India 4 4 0.00060.000 1
Total 16 16 0.000±0.000 1
Africa (AFR)
N’Dama NDM Guinea 12 2 9 1 0.24760.184 3
Total 12 2 9 1 0.247±0.184 3
Southwest Asia (SWA)
Anatolian Black ANT Turkey 5 1 1 2 1 0.30060.424 4
Damascus DAM Syria 3 1 1 1 0.55660.416 3
East Anatolian Red
EAR Turkey 4 1 2 1 0.27860.393 3
Middle Iraqi IQM Iraq 4 3 1 0.50060.000 2
North Iraqi IQN Iraq 1 1 n/a 1
South Iraqi IQS Iraq 3 3 0.00060.000 1
South Anatolian Red
SAR Turkey 4 2 2 0.22260.314 2
Total 24 4 1 1 1 7 5 5 0.574±0.192 7
Podolian (POD)
Chianina CHI Italy 20 20 0.00060.000 1
Istrian IST Croatia 4 4 0.00060.000 1
Marchigiana MCG Italy 11 11 0.00060.000 1
Maremmana MMA Italy 19 19 0.00060.000 1
Podolica PODi Italy 13 9 4 0.15460.218 2
Serbian Podolica PODs Serbia 4 4 0.00060.000 1
Turkish Grey TGY Turkey 3 3 0.00060.000 1
Ukrainian Grey UGY Ukraine 5 5 0.00060.000 1
Y-Haplotype
Distribut
ion
in
European
Cattle
PLoS
ONE
|
www.plos
one.org
4
January
2011
|
Volume
6
|
Issue
1
|
Geographic
grouping Breed Code
Country of origin
Number of
Y-chromo-somes Haplotype
haplotype diversity (±SD)
total number of haplotypes
Y1-94-158 Y1-96-158 Y1-98-158 Y1-98-160 Y1-100-158 Y1-102-158 Y2-80-158 Y2-90-158 Y2-94-158 Y2-96-158 Y2-98-158 Y2-98-160 Y2-100-158 Y2-102-158 Y2-102-160 Y2-104-158 Y2-104-160 Y2-106-158 Y3-88-156
Total 79 5 28 43 3 0.193±0.273 4
Iberian (IBE)
Alentejana ALN Portugal 34 34 0.00060.000 1
Alistana-Sanabresa
ALS Spain 12 12 0.00060.000 1
Arouquesa ARQ Portugal 33 25 8 0.12660.179 2
Asturiana de los Valles
ASV Spain 38 26 6 6 0.25660.202 3
Asturiana de Montana
ASM Spain 19 18 1 0.07060.050 2
Avilena Negro Iberica
AVI Spain 7 1 1 5 0.27060.214 3
Barrosa˜ BAR Portugal 33 4 29 0.07360.104 2
Berrenda BER Spain 5 3 2 0.20060.283 2
Betizu BEB Spain 17 17 0.00060.000 1
Brava de Lide BRV Portugal 26 2 23 1 0.12260.091 3
Cachena CCH Portugal 25 1 24 0.02760.038 2
Garvonesa GAR Portugal 6 6 0.00060.000 1
Lidia LID Spain 66 1 1 64 0.02060.028 3
Mallorquina MAL Spain 8 8 0.00060.000 1
Marinhoa MAH Portugal 17 17 0.00060.000 1
Maronesa MAR Portugal 23 23 0.00060.000 1
Mertolenga MRT Portugal 21 7 1 1 2 10 0.37860.273 5
Minhota MIN Portugal 28 28 0.00060.000 1
Mirandesa MIR Portugal 23 23 0.00060.000 1
Morucha MOR Spain 5 5 0.00060.000 1
Mostrenca MOS Spain 21 21 0.00060.000 1
Pajuna PAJ Spain 4 1 2 1 0.44460.342 3
Preta PRT Portugal 29 1 1 5 22 0.15860.178 4
Retinta RET Spain 6 4 2 0.17860.251 2
Rubia Gallega RGA Spain 44 44 0.00060.000 1
Sayaguesa SAY Spain 8 1 5 2 0.20260.286 3
Table 1.Cont.
Y-Haplotype
Distribut
ion
in
European
Cattle
PLoS
ONE
|
www.plos
one.org
5
January
2011
|
Volume
6
|
Issue
1
|
Geographic
grouping Breed Code
Country of origin
Number of
Y-chromo-somes Haplotype
haplotype diversity (±SD)
total number of haplotypes
Y1-94-158 Y1-96-158 Y1-98-158 Y1-98-160 Y1-100-158 Y1-102-158 Y2-80-158 Y2-90-158 Y2-94-158 Y2-96-158 Y2-98-158 Y2-98-160 Y2-100-158 Y2-102-158 Y2-102-160 Y2-104-158 Y2-104-160 Y2-106-158 Y3-88-156
Tudanca TUD Spain 10 10 0.00060.000 1
Total 568 44 57 1 1 1 1 1 277 17 140 28 0.335±0.244 11
Central (CEN)
Blonde d’Aquitaine
BDA France 5 3 2 0.20060.283 2
Bruna de los Pirineds
BPI Spain 11 11 0.00060.000 1
Busha BUS Serbia 5 5 0.00060.000 1
Cabannina CAB Italy 2 1 1 0.33360.471 2
Charolais CHA France 31 30 1 0.02260.030 2
Limousin LIM France 24 24 0.00060.000 1
Montbeliard MBE France 6 6 0.00060.000 1
Parthenaise PAR France 15 4 11 0.27960.198 2
Piemontese PIM Italy 13 2 11 0.09460.133 2
Pinzgaur PGZ Austria 9 9 0.00060.000 1
Pirenaica PIR Spain 10 8 2 0.11960.168 2
Pustertaler PUS Italy 13 13 0.00060.000 1
Salers SAL France 20 1 19 0.06760.047 2
Simmental SIM Switzer-land
15 15 0.00060.000 1
Swiss Brown SWB Switzer-land
14 14 0.00060.000 1
Tarentaise TAR France 18 18 0.00060.000 1
Tyrolean Grey TYG Italy 19 2 17 0.06660.094 2
Total 230 5 4 215 1 5 0.056±0.045 5
British (BRT)
Aberdeen Angus ABA Scotland 27 20 7 0.13360.188 2
Ayrshire AYR Scotland 16 16 0.00060.000 1
British White BWH England 21 16 1 1 3 0.25260.111 4
Dexter DEX Ireland 4 4 0.00060.000 1
Galloway GAL Scotland 9 9 0.00060.000 1
Hereford HER England 21 20 1 0.06360.045 2
Highland HIG Scotland 10 10 0.00060.000 1
Jersey JER Jersey 19 19 0.00060.000 1
Total 127 56 8 20 21 22 0.413±0.226 5
Table 1.Cont.
Y-Haplotype
Distribut
ion
in
European
Cattle
PLoS
ONE
|
www.plos
one.org
6
January
2011
|
Volume
6
|
Issue
1
|
Geographic
grouping Breed Code
Country of origin
Number of
Y-chromo-somes Haplotype
haplotype diversity (±SD)
total number of haplotypes
Y1-94-158 Y1-96-158 Y1-98-158 Y1-98-160 Y1-100-158 Y1-102-158 Y2-80-158 Y2-90-158 Y2-94-158 Y2-96-158 Y2-98-158 Y2-98-160 Y2-100-158 Y2-102-158 Y2-102-160 Y2-104-158 Y2-104-160 Y2-106-158 Y3-88-156
Nordic (NOR)
Blacksided Troender
STN Norway 7 7 0.00060.000 1
Doela DOL Norway 4 4 0.00060.000 1
Eastern Finncattle
EFC Finland 9 1 8 0.14860.105 2
Eastern Red Polled
ORA Norway 5 5 0.00060.000 1
Fjallnara FNR Sweden 3 3 0.00060.000 1
Icelandic ICL Iceland 8 8 0.00060.000 1
Northern Finncattle
NFC Finland 3 3 0.00060.000 1
Norwegian (commercial, hybrid)
NRF Norway 12 12 0.00060.000 1
Swedish Mountain
SFR Sweden 8 8 0.00060.000 1
Swedish Red Polled
ROK Sweden 3 3 0.00060.000 1
Telemark TEL Norway 2 2 0.00060.000 1
Western Finncattle
WFC Finland 9 9 0.00060.000 1
Western Fjord VFJ Norway 6 3 3 0.20060.283 2
Western Red Polled
VRA Norway 3 2 1 0.22260.314 2
Total 82 64 4 6 8 0.222±0.161 4
Baltic Red (BHR)
Angler ANG Germany 10 10 0.00060.000 1
Danish Red RDM Denmark 19 18 1 0.07060.050 2
Latvian Blue (native)
LBL Latvia 9 9 0.00060.000 1
Latvian Brown (commercial)
LBR Latvia 8 8 0.00060.000 1
Latvian Danish Red
DAR Latvia 7 3 4 0.38160.269 2
Suksunskaya SUK Russia 5 4 1 0.26760.189 2
Ukrainian Red Steppe
RST Ukraine 5 1 4 0.13360.189 2
Total 63 1 56 6 0.126±0.090 3
Table 1.Cont.
Y-Haplotype
Distribut
ion
in
European
Cattle
PLoS
ONE
|
www.plos
one.org
7
January
2011
|
Volume
6
|
Issue
1
|
Geographic
grouping Breed Code
Country of origin
Number of
Y-chromo-somes Haplotype
haplotype diversity (±SD)
total number of haplotypes
Y1-94-158 Y1-96-158 Y1-98-158 Y1-98-160 Y1-100-158 Y1-102-158 Y2-80-158 Y2-90-158 Y2-94-158 Y2-96-158 Y2-98-158 Y2-98-160 Y2-100-158 Y2-102-158 Y2-102-160 Y2-104-158 Y2-104-160 Y2-106-158 Y3-88-156
North-West (NWE)
Belgian Blue BWB France 21 19 2 0.06060.085 2
Belgian Red BRE Belgium 4 4 0.00060.000 1
Normand NOR France 46 46 0.00060.000 1
Shorthorn SHN Belgium 19 19 0.00060.000 1
Total 90 19 71 0.112±0.159 2
Lowland Pied (LLP)
Dutch Belted DUB Netherlands 8 3 5 0.35760.253 2
Friesian-Dutch FRH Netherlands 8 8 0.00060.000 1
German Original Black Pied-West
BPW Germany 3 3 0.00060.000 1
Groningen Whitehead
GWH Netherlands 6 6 0.00060.000 1
Holstein Friesian
HFR Netherlands 65 64 1 0.02160.015 2
Jutland (old native)
SJM Denmark 6 6 0.00060.000 1
Meuse-Rhine-Yssel
MRY Netherlands 9 9 0.00060.000 1
Red Holstein dual type
RH2 Netherlands 1 1 n/a 1
Total 106 100 1 5 0.072±0.039 3
Eastern (EAS)
Bestuzhev BZH Russia 4 4 0.00060.000 1
Istobenskaya ISB Russia 9 9 0.00060.000 1
Kalmyk KAL Russia 12 12 0.00060.000 1
Kholomo-gorskaya
KHO Russia 6 6 0.00060.000 1
Pechorskaya PCH Russia 7 7 0.00060.000 1
Ukrainian Whiteheaded
UWH Ukraine 11 4 1 6 0.38860.276 3
Yakutian cattle YKT Siberia 23 22 1 0.02960.041 2
Yaroslavskaya YAR Russia 3 3 0.00060.000 1
Total 75 33 1 6 34 1 0.373±0.247 5
Overall 111 breeds 1472 44 20 448 8 25 1 6 14 1 1 2 1 7 559 18 259 1 36 21 0.422±0.269
doi:10.1371/journal.pone.0015922.t001 Table 1.Cont.
Y-Haplotype
Distribut
ion
in
European
Cattle
PLoS
ONE
|
www.plos
one.org
8
January
2011
|
Volume
6
|
Issue
1
|
This implies that the zebu alleles found for autosomal markers in the Podolian [6,45,46,47], Iberian [6,48,49] and Ukrainian Whitehead [31] breeds came to Europe indirectly, presumably via Anatolia, North Africa or north of the Black Sea. In addition, the presence of zebu Y-chromosomes in Southwest Asia indicate that zebu introgression only took place after the expansion of domestic taurine cattle from Southwest Asia towards Europe [16].
Taurine haplogroups
The divergence of the two haplogroups Y1 and the Y2 without intermediate haplotypes suggests that domestication combined paternal lineages originate from two diverged populations. Remarkably, both haplogroups were found in Southwest Asia. In Europe, the Y1 and Y2 haplogroups found in extant cattle exhibit a clear geographic structure, with Y1 restricted to northern European and Iberian breeds. Initially, this was explained by local aurochs introgression, supposed to carry the Y1 lineage [25]; however, this does not account for the presence of Y1 in Southwest Asia. In addition, a subsequent study [27] exclusively found Y2 haplogroups in European aurochs. We note that this does not exclude that the Y2 lineage was partially contributed by local aurochs, nor that conditions of Neolithic farming may have created opportunities for male introgression from wild animals. However, several analyses of mtDNA have clearly demonstrated that domestic maternal lineages originate from Southwest Asia, with only sporadic female aurochs introgression [11,12,16,50,51]. An obvious possibility is that the current Y-chromosomal haplogroup distribution reflects Neolithic immigration routes. According to archaeological evidence, the dispersal of agriculture in Europe started in Greece around 7,000 BC, moved to southern Italy circa. 6,000 BC, and then along a southern route into the western Mediterranean between 5,600 and 5,400 BC, reaching Portugal around 5,300 BC. Migration along the continental route into Poland and Germany occurred between 5,500 and 5,300 BC, reaching north-western France around 5,000 BC; southern Scandinavia, the British Isles and Ireland were reached circa. or after 4,000 BC [52,53,54]. It is generally accepted that agriculture spread via these two routes: the Mediterranean route and the
Danubian(orcontinental) route. Although Y1 has a clear presence in Iberian cattle, Y2 paternal lineages dominate in the present Mediterranean area. A founder effect in Danubian immigrants could have caused the dominance of Y1 in northern Europe. In this scenario, the presence of Y1 in Iberia would have resulted from movements along the Atlantic seaboard, as documented by the Neolithic archaeological record [55], and the presence of two haplogroups in Britain may indicate a convergence of immigrants of both routes.
Alternatively, colonisation of Britain may have predated the expansion of Y1, which could have arrived in Britain later via the documented import of Dutch sires in the 18thcentury. This would be in line with analysis of skeletal remains excavated in Sweden, showing that Y1 bulls replaced Y2 bulls during or after the late Middle Ages [26], although Y1 cattle were taken to Iceland by the Vikingsc. 1,000 AD. However, a Y1 founder effect, long after the introduction of domestic cattle in northern Europe, is the most consistent with the haplotype diversity pattern.
Y1 samples identified in Africa are more likely to be the result of a recent introgression of European cattle rather than the expansion of a genetically heterogeneous sire population domes-ticated in the Fertile Crescent. Y-specific microsatellite data confirm the existence of a Y2 haplotypic subfamily in African cattle restricted to the African continent [14,15].
Distribution of haplotype diversity
The comprehensive coverage of our study permits a comparison of the diversity of paternal lineages in different regions. Even in a limited sampling, Southwest Asian cattle contain seven out of the 19 taurine haplotypes identified in this study. This supports the theory that the Fertile Crescent was a major centre of cattle domestication and that European cattle are a subset of an initially diverse Southwest Asian domestic population. The high diversity in Spain and Portugal is probably explained by the isolated position of the Iberian Peninsula, by which much of the original diversity has been conserved. However, the increased diversity may also have been influenced by African introgression, which is consistent with mitochondrial and autosomal information Table 2.Haplotypic data for the breeds typed for the Y1-Y2-Y3 SNPs and the two microsatellite loci,INRA189andBM861.
Geographic
grouping SNPs
Mean number of
samples / breed Microsatellites
Mean number of samples / breed
Total number of haplotypes
Haplotype diversity (±SD)
Breeds Samples Breeds Samples
India (IND) 2 16 8.0 2 16 8.0 1 0.00060.0
Africa (AFR) 1 14 n/a 1 12 n/a 3 0.24760.2
Southwest Asia (SWA) 7 25 3.6 7 24 3.4 7 0.57460.4
Podolian (POD) 12 184 15.3 8 79 9.9 4 0.19360.2
Iberian (IBE) 31 651 21.0 27 568 21.0 11 0.33560.2
Central (CEN) 30 453 15.1 17 230 13.5 5 0.05660.1
British (BRT) 10 164 16.4 8 127 15.9 5 0.41360.3
Nordic (NOR) 14 95 6.8 14 82 5.9 4 0.22260.2
Baltic Red (BHR) 9 77 8.6 7 63 9.0 3 0.12660.1
North-West (NWE) 5 126 25.2 4 90 22.5 2 0.11260.1
Lowland Pied (LLP) 9 208 23.1 8 106 13.3 3 0.07260.1
Eastern (EAS) 8 74 9.3 8 75 9.4 5 0.37360.3
Overall 138 2087 15.1 111 1472 13.3 19 0.422±0.3
doi:10.1371/journal.pone.0015922.t002
Y-Haplotype Distribution in European Cattle
[6,10,22,56,57]. The diversity in Italian cattle, including the Tuscan breeds with their unusual mtDNA diversity [58], is less than that exhibited in Iberian breeds, with two major Y2 haplotypes. As noted above, the presence of both Y1 and Y2 haplotypes in Britain and the Nordic region may reflect multiple arrivals of cattle, which probably also explains the diversity in Russian cattle.
The diversity in the Mediterranean countries, and in the northern and eastern periphery of Europe, is in striking contrast, with near homogeneity of paternal lineages in north-central and central Europe. The black-pied, red-pied and solid red dairy cattle originating from the Dutch, German and Danish lowlands almost exclusively carry the Y1-98-158 haplotype. We propose that this reflects a founder effect associated with the prehistoric develop-ment of dairy farming [59]. Dairy farming by Germanic people in the Roman period has been well documented [Strabo AD23, as translated in 60], while, in the Mediterranean area, cattle were mainly used for draught power and meat consumption [61]. This is consistent with the origin of human lactase tolerance in central Europe [61]. In the 18th century, Rinderpest epidemics led to a replacement of Dutch cattle, with their various coat colours, by black-pied cattle from the Holstein region [34,62]. These became
the ancestors of the highly productive Dutch black-pied cattle, which were exported to several countries. Similarly, the related dairy Red Angler and Danish Red spread to the Baltic countries, Russia and Germany [34,63].
A different haplotype, Y2-102-158 is predominant in southern France, southern Germany and the Alpine region (Figure 2). Many of the present Alpine short-headed cattle are derived from, or related to, the mixed-purpose Simmental and Swiss Brown cattle. It is not known when these types of cattle were developed, although archaeological findings indicate an ancient origin of milk consumption in Switzerland [64] and dairy farming in the Roman period has been documented [Pliny the Elder AD77, as translated in 65]. An increase in size of Swiss cattle during the Roman period further suggests importation of Italian cattle [64]. The predom-inance of a single Y2 haplotype may indicate again a founder effect. Just as the northern-central European dairy breeds, the Alpine breeds also spread to the surrounding regions. Simmentals were exported to several countries and also used for upgrading of local breeds [34]. Swiss Brown has been crossed with German, Italian and Spanish brown mountain breeds, as well as in the Asturian Valley [66]. We propose that historic or recent spreading of popular breeds acts on genetic diversity patterns and, by the Figure 2. Median-joining networks of Y-chromosome haplotypes using SNPs and two microsatellite markers.The size of each circle represents the number of chromosomes present in each haplotype. (a) Haplotype relationships for the complete dataset. (b) Regional networks defined for 11 geographic breed groups (India excluded). Haplotypes are indicated with the colouring scheme shown in (b).
doi:10.1371/journal.pone.0015922.g002
Y-Haplotype Distribution in European Cattle
selection of proven sires, has a homogenising effect on paternal lineages.
However, southern French beef breeds also carry exclusively the Y2-102-158 haplotype. A close relationship of southern French and Alpine breeds is indicated by autosomal AFLP profiles [9], SNPs [7] and microsatellite genotypes (unpublished results; Figure S2). One explanation might be that contacts of Transalpine Gallic people facilitated gene flow, for instance, during a repopulation of Gallia after the devastating Gallic wars. More recently, the Great Famine, from 1315 to 1317, north and west of the Alps may very well have decimated the French cattle and led to the introduction of Alpine cattle. After the Middle Ages, when the size of cattle started to increase, these would have developed into the present beef types.
The divergence of paternal lineages in north-central and central groups of dairy cattle is fully in agreement with their separate positions as indicated by autosomal markers (Figure S1; [7,9]). This may constitute evidence for independent developments of dairy cattle in different European regions. The Dutch cattle has been crossed with British breeds [34], but not in the Jersey Island dairy cattle, which obviously developed its high milk production separately. An important implication is that in different regions breeding for milk production selected other gene variants, and that crossbreeding of the different categories of dairy cattle is expected to generate potentially useful allelic combinations.
Apparently, the expansion of the dairy breeds have created, or largely maintained, a sharp genetic contrast of northern and southern Europe, which divides both France and Germany. It may be hypothesised that the northern landscapes, with large flat meadows, are suitable for large-scale farming with specialised dairy cattle (Niederungsvieh, lowland cattle), whilst the mixed-purpose or beef cattle (Ho¨henvieh, highland cattle) are better suited to the smaller farms and hilly regions of the south. However, it is also remarkable that in both France and Germany the bovine genetic boundary coincides with historic linguistic and cultural boundaries. In France, the Frankish invasion in the north created the difference between the northernlangue d’oı¨land the southern langue d’oc. The German language is still divided into the southern Hochdeutsch and northern Niederdeutsch dialects, which also corre-lates with the distribution of the Catholic and Protestant religions. On a larger scale, it is tempting to speculate that the difference between two types of European cattle reflects, and has even reinforced, the traditional and still visible contrast of Roman and Germanic Europe.
We conclude that analysis of paternal lineages contributes to a reconstruction of the history of cattle husbandry. A differentiation of more haplotypes [14,15,22,31], and especially the analysis of historic DNA, may answer the question of the European aurochs contribution, as well as indicating a time depth for the successive genetic events that have created the present pattern of genetic diversity.
Materials and Methods
Sample collection
Details on sample collection and DNA isolation can be found in previous publications from the participating laboratories [14,22,31,67]. Breeds, geographic origins and sample sizes are shown inTable S1. This dataset comprises a total of 138 breeds and 2087 individuals. Apart from the 16 zebu (Bos indicus) samples from India, all animals wereBos taurus. Based on breed histories and geographical origin, a total of 12 geographic breed groups were defined as follows: India (2 breeds), Africa (1), Southwest Asia (7), Podolian (12), Iberian (31), Central (30), British (10), Nordic
(14), Baltic Red (9), North-West (5), Lowland Pied (9) and Eastern (8).
Sequencing and genotyping
Segments of theZFY,SRYandDBYgenes were PCR-amplified and sequenced as previously described [32]. As indicated inTable S1, individual SNPs were typed by pyrosequencing [25,30], sequencing [14] or by custom service via the Taqman (Van Haeringen Laboratory, Wageningen, Netherlands) or KASPar (K-Bioscience, Hoddesdon, UK) procedures. Several samples were analysed by more than one method.
The Y-chromosomal microsatellites BM861 [37], INRA189 [36],INRA124andINRA126[68] were genotyped as described in previous publications [14,30,31,67]. Results from INRA124 and INRA126 were discounted due to these markers showing amplification in female samples [69]. Allele sizes were standardised via known fixed alleles from several samples or breeds analysed by the different laboratories (Dublin, Jokioinen, Davis and Gijon). Y-haplotypes were defined for each individual by combining data from both SNPs and microsatellite loci (SNP-INRA189-BM861).
Genotyping of the FAO-recommended autosomal microsatel-lites has been described previously [5,35,70].
Statistical analyses
Variability at the DNA level was assessed in each breed and within each geographic group by estimating the unbiased expected genetic diversity [71], and by an analysis of molecular variance (AMOVA), using ARLEQUIN version 2.0 [72]. Phylogenetic relationships among haplotypes were analysed by constructing median-joining (MJ) networks for each region using the algorithm of Bandeltet al.[73], as implemented in the NETWORK (Version 4.156; www.fluxus-engineering.com).
Supporting Information
Figure S1 Map showing distribution of SNP Y-haplo-types in: (a) Europe, and (b) Eurasia. Haplotypes are indicated with the colouring scheme shown in(b). Abbreviations of breed names are given in Table 1.
(PDF)
Figure S2 NeighborNet graphs of Reynolds’ distances, based on 30 autosomal microsatellites. Haplotypes are indicated with the same colouring scheme as for: (a) maps in Figure S1, and (b) maps inFigure 1. Abbreviations of breed names are given in Table 1.
(PDF)
Table S1 (DOC)
Table S2 (DOC)
Table S3 (DOC)
Table S4 (DOC)
Acknowledgments
The following members of the European Cattle Genetic Diversity Consortium contributed to the study. Austria: R. Baumung, BOKU Y-Haplotype Distribution in European Cattle
University, Vienna; Belgium: G. Mommens, University of Ghent, Merelbeke;Denmark:L.-E. Holm, Aarhus University, Tjele;K.B. Withen,
B.V Pedersen and P. Gravlund, University of Copenhagen; France: K. Moazami-Goudarzi, M. Gautier and D. Laloe¨, INRA, Jouy-en-Josas; A. OulmoudenandH. Leve´ziel, INRA, Limoges;P. Taberlet, Universite´ Joseph Fourier et CNRS, Grenoble; Germany: H. Simianer and H. Ta¨ubert, Georg-August-Universita¨t, Go¨ttingen;G. Erhardt, Justus-Liebig Universita¨t, Giessen;I. Medugorac, Ludwig-Maximilians Universita¨t, Munich;Iceland:
E. Eythorsdottir, Agricultural University of Iceland, Borgarnes;Italy: P. Ajmone MarsanandR. Negrini, Universita` Cattolica del S. Cuore, Piacenza;
E. Lasagna,V. Landi,F. PanellaandF. Maria Sarti, Universita` degli Studi di Perugia;M. Longeri, G. Ceriottiand M. Zanotti, Universita` degli Studi di Milano;D. MarlettaandA. Criscione, Universita degli Studi di Catania;A. Valentini and M.C. Savarese, Universita` della Tuscia, Viterbo; F. Pilla, Universita` del Molise, Campobasso;Latvia:Z. Grislis, Latvia University of Agriculture, Jelgava;Netherlands:D.C.J. van Boxtel, Utrecht University;
E. Cuppen, Hubrecht Laboratory, Utrecht;W. van HaeringenandL. van de Goor, Van Haeringen Laboratory, Wageningen; M. Felius, Rotterdam;
Norway: I. Olsaker, Norwegian School of Veterinary Science, Oslo; Russia:Z. Ivanova,R. PopovandI. Ammosov, Yakutian Research Institute of Agricultural Sciences, Yakutsk;T. Kiselyova, All-Russian Research Institute for Farm Animals and Breeding, St. Petersburgh-Pushkin; Serbia: M. C´ inkulov, University of Novi Sad;S. Stojanovic, Ministry of Agriculture and Water Management, Belgrade; Spain:S. Dunner, Universidad Complu-tense de Madrid;C. Rodellar, Veterinary Faculty, Zaragoza;P.J. Azor,A.
MolinaandE. Rodero, University of Co´rdoba;F. Goyache, SERIDA, Gijo´n;
Sweden: A. Go¨therstro¨m, Uppsala University; Switzerland: G. Dolf, University of Berne;UK:J.L. WilliamsandP. Wiener, Roslin Institute.
We thank the following persons and institutes for cattle sperm samples: Sue Walters (Shorthorn Society, Kenilworth, UK), J. Dengg (Tierzucht LWK, Salzburg, Austria), Besamungsverein (Neustadt/Aisch, Germany), Barbara Echert (Pru¨f- und Besamungsstation Mu¨nchen Grub, Germany), Dr. Hagena (ZBH eG, Alsfeld, Germany), B. Luntz (LfL Tierzucht, Poing-Grub, Germany), Rinderunion (Herbertingen, Germany), Claudia Scho¨der (Combibull,Ocholt, Germany), Angelika Weyand (RSH, Scho¨nbo¨ken, Germany), ANABIC (Perugia, Italy), Torstein Steine and Nina Hovden Saether (Norway), and Margareta Ha˚rd (Sweden). We thank A. Martı´nez-Martı´nez and J. V. Delgado (Universidad de Co´rdoba, Spain) for contributing Mostrenca samples. We also thank Jonna Roito, Tiina Jaakkola and Sari Raiskio (Finland) for DNA extractions, and Anneli Virta (Finland) for skilful technical assistance in A.L.F.TMExpress and Megabase runs.
Author Contributions
Conceived and designed the experiments: CJE CG JK LP-P MCTP DGB JAL IJN. Performed the experiments: CJE CG JK LP-P JAL IJN. Analyzed the data: CJE CG JK LP-P AT MCTP DGB JAL. Contributed reagents/ materials/analysis tools: FS MCTP DGB JAL. Wrote the paper: CJE CG JAL. Commented on manuscript: LP-P AT LTG.
References
1. Diamond J (2002) Evolution, consequences and future of plant and animal domestication. Nature 418: 700–707.
2. Zeder MA, Emshwiller E, Smith BD, Bradley DG (2006) Documenting domestication: the intersection of genetics and archaeology. Trends Genet 22: 139–155.
3. Driscoll CA, Macdonald DW, O’Brien SJ (2009) From wild animals to domestic pets, an evolutionary view of domestication. Proc Natl Acad Sci U S A 106 Suppl 1: 9971–9978.
4. Groeneveld LF, Lenstra JA, Eding H, Toro MA, Scherf B, et al. (2010) Genetic diversity in farm animals–a review. Anim Genet 41 Suppl 1: 6–31. 5. Medugorac I, Medugorac A, Russ I, Veit-Kensch CE, Taberlet P, et al. (2009)
Genetic diversity of European cattle breeds highlights the conservation value of traditional unselected breeds with high effective population size. Mol Ecol 18: 3394–3410.
6. Cymbron T, Freeman AR, Isabel Malheiro M, Vigne JD, Bradley DG (2005) Microsatellite diversity suggests different histories for Mediterranean and Northern European cattle populations. Proc R Soc Lond B Biol Sci 272: 1837–1843.
7. Decker JE, Pires JC, Conant GC, McKay SD, Heaton MP, et al. (2009) Resolving the evolution of extant and extinct ruminants with high-throughput phylogenomics. Proc Natl Acad Sci U S A 106: 18644–18649.
8. Laloe¨ D, Moazami-Goudarzi K, Lenstra JA (2010) Phylogeographic trends of domestic ruminants in Europe. Diversity 2: 932–945.
9. Negrini R, Nijman IJ, Milanesi E, Moazami-Goudarzi K, Williams JL, et al. (2007) Differentiation of European cattle by AFLP fingerprinting. Anim Genet 38: 60–66.
10. Beja-Pereira A, Caramelli D, Lalueza-Fox C, Vernesi C, Ferrand N, et al. (2006) The origin of European cattle: evidence from modern and ancient DNA. Proc Natl Acad Sci U S A 103: 8113–8118.
11. Achilli A, Bonfiglio S, Olivieri A, Malusa A, Pala M, et al. (2009) The multifaceted origin of taurine cattle reflected by the mitochondrial genome. PLoS ONE 4: e5753.
12. Achilli A, Olivieri A, Pellecchia M, Uboldi C, Colli L, et al. (2008) Mitochondrial genomes of extinct aurochs survive in domestic cattle. Curr Biol 18: 157–158.
13. Mona S, Catalano G, Lari M, Larson G, Boscato P, et al. Population dynamic of the extinct European aurochs: genetic evidence of a north-south differentiation pattern and no evidence of post-glacial expansion. BMC Evol Biol 10: 83. 14. Perez-Pardal L, Royo LJ, Beja-Pereira A, Curik I, Traore A, et al. (2009)
Y-specific microsatellites reveal an African subfamily in taurine (Bos taurus) cattle. Anim Genet 41: 232–241.
15. Perez-Pardal L, Royo LJ, Beja-Pereira A, Chen S, Cantet RJ, et al. (2010) Multiple paternal origins of domestic cattle revealed by Y-specific interspersed multilocus microsatellites. Heredity 105: 511–519.
16. Edwards CJ, Baird JF, MacHugh DE (2007) Taurine and zebu admixture in Near Eastern cattle: a comparison of mitochondrial, autosomal and Y-chromosomal data. Anim Genet 38: 520–524.
17. Troy CS, MacHugh DE, Bailey JF, Magee DA, Loftus RT, et al. (2001) Genetic evidence for Near-Eastern origins of European cattle. Nature 410: 1088– 1091.
18. Chen S, Lin BZ, Baig M, Mitra B, Lopes RJ, et al. (2009) Zebu cattle are an exclusive legacy of the South Asia Neolithic. Mol Biol Evol 27(1): 1–6.
19. Underhill PA, Kivisild T (2007) Use of y chromosome and mitochondrial DNA population structure in tracing human migrations. Annu Rev Genet 41: 539–564.
20. Jobling MA, Tyler-Smith C (2003) The human Y chromosome: an evolutionary marker comes of age. Nat Rev Genet 4: 598–612.
21. MacHugh DE, Shriver MD, Loftus RT, Cunningham P, Bradley DG (1997) Microsatellite DNA variation and the evolution, domestication and phylogeog-raphy of taurine and zebu cattle (Bos taurus and Bos indicus). Genetics 146: 1071–1086.
22. Ginja C, Penedo MC, Melucci L, Quiroz J, Martinez Lopez OR, et al. (2010) Origins and genetic diversity of New World Creole cattle: inferences from mitochondrial and Y chromosome polymorphisms. Anim Genet 41: 128–141. 23. Bradley DG, Loftus RT, Cunningham P, MacHugh DE (1998) Genetics and
domestic cattle origins. Evol Anthrop 6: 79–86.
24. Mohamad K, Olsson M, van Tol HT, Mikko S, Vlamings BH, et al. (2009) On the origin of Indonesian cattle. PLoS ONE 4: e5490.
25. Gotherstrom A, Anderung C, Hellborg L, Elburg R, Smith C, et al. (2005) Cattle domestication in the Near East was followed by hybridization with aurochs bulls in Europe. Proc R Soc Lond B Biol Sci 272: 2345–2350. 26. Svensson E, Gotherstrom A (2008) Temporal fluctuations of Y-chromosomal
variation in Bos taurus. Biol Lett 4: 752–754.
27. Bollongino R, Elsner J, Vigne JD, Burger J (2008) Y-SNPs do not indicate hybridisation between European aurochs and domestic cattle. PLoS ONE 3: e3418.
28. Balaresque P, Bowden GR, Adams SM, Leung HY, King TE, et al. A predominantly neolithic origin for European paternal lineages. PLoS Biol 8: e1000285.
29. Underhill PA, Myres NM, Rootsi S, Metspalu M, Zhivotovsky LA, et al. (2010) Separating the post-Glacial coancestry of European and Asian Y chromosomes within haplogroup R1a. Eur J Hum Genet 18: 479–484.
30. Ginja C, Gama LT, Penedo MCT (2009) Y chromosome haplotype analysis in Portuguese cattle breeds using SNPs and STRs. J Hered 100: 148–157. 31. Kantanen J, Edwards CJ, Bradley DG, Viinalass H, Thessler S (2009) Maternal
and paternal genealogy of Eurasian taurine cattle (Bos taurus). Heredity 103: 1–12.
32. Nijman IJ, van Boxtel DJ, van Cann LM, Cuppen E, Lenstra JA (2008) Phylogeny of Y-chromosomes from interbreeding bovine species. Cladistics 24: 723–726.
33. Verkaar EL, Nijman IJ, Beeke M, Hanekamp E, Lenstra JA (2004) Maternal and paternal lineages in cross-breeding bovine species. Has wisent a hybrid origin? Mol Biol Evol 21: 1165–1170.
34. Felius M (1995) Cattle breeds - an encyclopedia. Doetinchem, Netherlands: Misset.
35. Li MH, Tapio I, Vilkki J, Ivanova Z, Kiselyova T, et al. (2007) The genetic structure of cattle populations (Bos taurus) in northern Eurasia and the neighbouring Near Eastern regions: implications for breeding strategies and conservation. Mol Ecol 16: 3839–3853.
36. Kappes SM, Keele JW, Stone RT, McGraw RA, Sonstegard TS, et al. (1997) A second-generation linkage map of the bovine genome. Genome Res 7: 235–249. 37. Bishop MD, Kappes SM, Keele JW, Stone RT, Sunden SL, et al. (1994) A
genetic linkage map for cattle. Genetics 136: 619–639.
Y-Haplotype Distribution in European Cattle
38. Baker CMA, Manwell C (1980) Chemical classification of cattle: 1. Breed groups. Genetics 11: 127–150.
39. Loftus RT, MacHugh DE, Bradley DG, Sharp PM, Cunningham P (1994) Evidence for two independent domestications of cattle. Proc Natl Acad Sci U S A 91: 2757–2761.
40. Loftus RT, MacHugh DE, Ngere LO, Balain DS, Badi AM, et al. (1994) Mitochondrial genetic variation in European, African and Indian cattle populations. Anim Genet 25: 265–271.
41. Bradley DG, MacHugh DE, Cunningham P, Loftus RT (1996) Mitochondrial diversity and the origins of African and European cattle. Proc Natl Acad Sci U S A 93: 5131–5135.
42. Bradley DG, MacHugh DE, Loftus RT, Sow RS, Hoste CH, et al. (1994) Zebu-taurine variation in Y chromosomal DNA: a sensitive assay for genetic introgression in west African trypanotolerant cattle populations. Anim Genet 25: 7–12.
43. Teale AJ, Wambugu J, Gwakisa PS, Stranzinger G, Bradley D, et al. (1995) A polymorphism in randomly amplified DNA that differentiates the Y chromo-somes of Bos indicus and Bos taurus. Anim Genet 26: 243–248.
44. Bruford MW, Bradley DG, Luikart G (2003) DNA markers reveal the complexity of livestock domestication. Nat Rev Genet 4: 900–910.
45. Pieragostini E, Scaloni A, Rullo R, Di Luccia A (2000) Identical marker alleles in Podolic cattle (Bos taurus) and Indian zebu (Bos indicus). Comp Biochem Physiol B Biochem Mol Biol 127: 1–9.
46. Ibeagha-Awemu EM, Erhardt G (2006) An evaluation of genetic diversity indices of the Red Bororo and White Fulani cattle breeds with different molecular markers and their implications for current and future improvement options. Trop Anim Health Prod 38: 431–441.
47. Caroli A, Rizzi R, Luhken G, Erhardt G Short communication: milk protein genetic variation and casein haplotype structure in the Original Pinzgauer cattle. J Dairy Sci 93: 1260–1265.
48. Beja-Pereira A, Alexandrino P, Bessa I, Carretero Y, Dunner S, et al. (2003) Genetic characterization of southwestern European bovine breeds: a historical and biogeographical reassessment with a set of 16 microsatellites. J Hered 94: 243–250.
49. Ginja C, Telo Da Gama L, Penedo MC (2010) Analysis of STR markers reveals high genetic structure in Portuguese native cattle. J Hered 101: 201–210. 50. Bollongino R, Edwards CJ, Alt KW, Burger J, Bradley DG (2006) Early history
of European domestic cattle as revealed by ancient DNA. Biol Lett 2: 155–159. 51. Stock F, Edwards CJ, Bollongino R, Finlay EK, Burger J, et al. (2009) Cytochrome b sequences of ancient cattle and wild ox support phylogenetic complexity in the ancient and modern bovine populations. Anim Genet 40: 694–700.
52. Waterbolk HT (1968) Food production in prehistoric Europe. Science 162: 1093–1102.
53. Zilha˜o J (2001) Radiocarbon evidence for maritime pioneer colonization at the origins of farming in west Mediterranean Europe. Proc Natl Acad Sci U S A 98: 14180–14185.
54. Tresset A, Vigne JD (2007) Substitution of species, techniques and symbols at the Mesolithic/Neolithic transition in Western Europe. In: Whittle A, Cummings V, eds. Going Over: the Mesolithic/Neolithic Transition in NW Europe: Proc Brit Acad. pp 189–210.
55. Marchand G, Tresset A (2005) Derniers chasseurs et premiers agriculteurs sur la fac¸ade Atlantique de l’Europe. In: Guilaine J, ed. Les Marges, De´bitrices ou Cre´atrices? La Mise en Place du Ne´olithique et de ses Prolongements a` la Pe´riphe´rie des ‘‘Foyers’’ Classiques. Paris: Errance. pp 255–280.
56. Cymbron T, Loftus RT, Malheiro MI, Bradley DG (1999) Mitochondrial sequence variation suggests an African influence in Portuguese cattle. Proc R Soc Lond B Biol Sci 266: 597–603.
57. Ginja C, Penedo MC, Sobral MF, Matos J, Borges C, et al. (2010) Molecular genetic analysis of a cattle population to reconstitute the extinct Algarvia breed. Genet Sel Evol 42: 18.
58. Pellecchia M, Negrini R, Colli L, Patrini M, Milanesi E, et al. (2007) The mystery of Etruscan origins: novel clues from Bos taurus mitochondrial DNA. Proc R Soc Lond B Biol Sci 274: 1175–1179.
59. Beja-Pereira A, Luikart G, England PR, Bradley DG, Jann OC, et al. (2003) Gene-culture coevolution between cattle milk protein genes and human lactase genes. Nat Genet 35: 311–313.
60. Jones HL (1924) The Loeb Classical Library: The geography of Strabo in eight volumes. London: William Heinemann Ltd.
61. Itan Y, Powell A, Beaumont MA, Burger J, Thomas MG (2009) The origins of lactase persistence in Europe. PLoS Comput Biol 5: e1000491.
62. Faber JA (1962) Cattle plague in the Netherlands during the 18th century. Mededelingen van de Landbouwhogeschool te Wageningen 12: 1–7. 63. Li MH, Kantanen J Genetic structure of Eurasian cattle (Bos taurus) based on
microsatellites: clarification for their breed classification. Anim Genet 41: 150–158.
64. Schibler J, Schlumbaum A (2007) History and economic importance of cattle (Bos taurus L.) in Switzerland from Neolithic to Early Middle Ages. Schweiz Arch Tierheilkd 149: 23–29.
65. Healy JF (1991) Pliny the Elder - Natural History. London: Penguin Classics. 66. Martin-Burriel I, Rodellar C, Lenstra JA, Sanz A, Cons C, et al. (2007) Genetic
diversity and relationships of endangered Spanish cattle breeds. J Hered 98: 687–691.
67. Edwards CJ, Gaillard C, Bradley DG, MacHugh DE (2000) Y-specific microsatellite polymorphisms in a range of bovid species. Anim Genet 31: 127–130.
68. Vaiman D, Mercier D, Moazami-Goudarzi K, Eggen A, Ciampolini R, et al. (1994) A set of 99 cattle microsatellites: characterization, synteny mapping, and polymorphism. Mamm Genome 5: 288–297.
69. Perez-Pardal L, Royo LJ, Alvarez I, de Leon FA, Fernandez I, et al. (2009) Female segregation patterns of the putative Y-chromosome-specific microsatel-lite markers INRA124 and INRA126 do not support their use for cattle population studies. Anim Genet 40: 560–564.
70. Econogene (2006) Marker-assisted conservation of European cattle breeds: An evaluation. Anim Genet 37: 475–481.
71. Nei M (1987) Molecular Evolutionary Genetics. New York, NY, USA: Columbia University Press.
72. Schneider S, Roessli D, Excoffier L (2000) Arlequin ver. 2.000: A software for population genetics data analysis. Switzerland: Genetics and Biometry Laboratory, University of Geneva.
73. Bandelt HJ, Forster P, Rohl A (1999) Median-joining networks for inferring intraspecific phylogenies. Genome Biol Evol 16: 37–48.
Y-Haplotype Distribution in European Cattle