Effect of cooling rate on properties of plasma nitrided AISI 1010 steel
C. Alves Jr.
a,⁎
, J.A. Lima
a, V. Hajek
a, J.B. Marimon da Cunha
b, C.A. dos Santos
b,ca
LabPlasma, Departamento de Engenharia Mecânica, Universidade Federal do Rio Grande do Norte (UFRN), Campus Universitário-Lagoa Nova, 59072-970 Natal, RN, Brazil
b
Instituto de Física, Universidade Federal do Rio Grande do Sul (UFRGS), C.P. 15051, Campus do Vale, 91501-970 Porto Alegre, RS, Brazil c
Núcleo de Educação a Distância, Universidade Estadual do Rio Grande do Sul (UERGS), Rua Gal. João Manoel, 50, 90010-030 Porto Alegre, RS, Brazil
Received 28 December 2005; accepted in revised form 15 February 2007 Available online 1 March 2007
Abstract
In this work, AISI 1010 steel samples were plasma nitrided into 20% N2plus 80% H2atmosphere at a pressure of 500 Pa (partial pressure of
100 Pa and 400 Pa for N2and H2, respectively), temperatures of 500 and 580 °C, during 2 h. Three different procedures for cooling were
accomplished after nitriding. In the first procedure the cooling occurred naturally, that is, the sample was kept on substrate holder. In the second one the sample was pulled off and cooling in a cold surface. Finally, in the third cooling process the sample was pulled off the substrate holder down into special reservoir filled with oil held at ambient temperature. The properties of the AISI 1010 steel samples were characterized by optical and electron microscopy, X-ray diffraction, Mössbauer spectroscopy and microhardness tests. Thermal gradient inside the sample kept on substrate holder during cooling process was measured by three inserted thermocouples at different depths. When samples were cooled rapidly the transformation ofϵ-Fe2−3N toγ′-Fe4N was inhibited. Such effect is indicated by the high concentration ofϵ-Fe2−3N phase observed in the
compound zone. To get solid state solution of nitrogen in the diffusion zone, instead of precipitates of nitride phases, the cooling rate should be higher than a critical value of about 0.95 °C/s. When this value is reached at any depth of the diffusion zone, two distinct diffusion zones will appear. Temperature gradients were measured inside the samples as a consequence of the plasma treatment. It's suggested the need for standardization of the term“treatment temperature”for plasma treatment because different nitrided layer properties could be reported for the same
“treatment temperature”.
© 2007 Elsevier B.V. All rights reserved.
Keywords:Plasma nitriding; Plasma nitrided AISI 1010; Cooling rate effect on plasma nitriding; Thermal gradient on plasma nitriding
1. Introduction
Advanced surface modification processes using plasma have undergone substantial industrial development over the past sev-eral decades[1,2]. One of the fields where these processes are widely used is machining. To increase productivity and efficiency, high speed and high load operating machines were developed. Components of such machines are exposed to severe conditions. They have to be tougher, more resistant to wear at high operating temperatures (when working without cooling emulsion) and be efficient during a long lifetime. Modification of the surface of such mechanical components leading to increased hardness and wear resistance comes to address those needs. One of the most
studied and industrially adopted processes is plasma nitriding. This process is used to introduce nitrogen to the surface of mechanical components. While the component is treated by plasma at elevated temperature nitrogen diffuses inside and forms various surface and subsurface nitrides [3–6]. The plasma nitriding has been intensively studied over the several decades and the basic principles of the process are already well known, so that the final results can be reproduced[7–10].
One of the less studied process parameters, which can signifi-cantly influence the resulting properties of plasma nitrided sam-ples, is their cooling rate after the treatment. Depending on the cooling rate different phases precipitate which means that different mechanical properties can be reached[3]. The cooling rate can be controlled in various ways, for example by decreasing the discharge voltage (till plasma turns off), the flux of the cooling gas, by introducing cooling liquid inside the substrate holder. One
⁎ Corresponding author. Tel.: +55 84 215 3800x210; fax: +55 84 215 3791. E-mail address:[email protected](C. Alves).
has to keep in mind that the cooling rate strongly depends also on geometry of the vacuum chamber, position of the sample inside the chamber, mass of the substrate holder and the sample, etc.
In this work AISI 1010 steel samples were used to study the influence of cooling rate obtained by various ways after the plasma is switched off on the structure and mechanical pro-perties of the nitrided layers.
2. Experimental setup
AISI 1010 steel disks, 16 mm in diameter and 4.5 mm high were polished to average surface roughness Ra = 0.05μm. They were cleaned ultrasonically in acetone for 20 min. For each condition nitriding run there was one sample placed on the substrate holder. Samples were plasma nitrided in an 20%N2 plus 80%H2atmosphere (total gases flow of 10 sccm) at pressure of 500 Pa (partial pressure of 100 Pa and 400 Pa for N2and H2, respectively), temperatures of 500 and 580 °C, during 2 h. This concentration was choose because is a typical mixing for plasma nitriding[11].
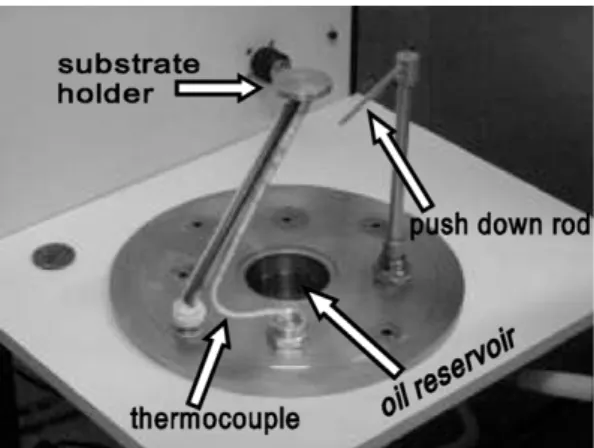
A typical running time of 30 min was necessary to stabilize the treatment temperature. During this time the surface sample is cleaned by plasma particle bombardment. No argon pretreatment was used. After the treatment the samples were cooled by three different ways: (a) the sample was kept on substrate holder, while plasma was turned off keeping the gases flow and pressure the same; (b) the sample was pulled off the substrate holder down to the bottom of the chamber where it cooled down (keeping the gases flow and pressure unchanged); (c) the sample was pulled off the substrate holder down into special reservoir filled with oil held at ambient temperature. In cases (b) and (c) a push down rod (Fig. 1) was used to pull the sample off the substrate holder. Mechanical vacuum pump oil E-15 from Edwards company with vapor pressure of 4.5 × 10⁻²Pa (at 100 °C) was used in case (c).
The temperature of the oil was held at 25 ± 2 °C. It was controlled by chromel–alumel thermocouple connected to the bottom of the reservoir.
The temperature of the plasma treatment in cases (b) and (c) was measured by chromel–alumel thermocouple inserted inside the substrate holder 4 mm from the upper holder surface. In case of cooling procedure (a), three chromel–alumel thermocouples
were inserted in the sample at different distances from the top surface (Fig. 2): (1) 0.1 mm, (2) 2 mm and (3) 4 mm. The values from thermocouple (3) was considered as a reference temper-ature of the treatment process. Holes in which the thermo-couples were inserted were 1.5 mm in diameter and were made by high precision Denford Triac PC CNC machine in drilling mode with a resolution of 0.005 mm (5 μm). The three ther-mocouples inserted in the sample allow obtaining information about the temperature gradient existing in the sample during plasma treatment and also during cooling rate when the plasma is switched off. The thermal gradient is originated by the inter-mittent ion bombardment in the surface. Sample temperature The average cooling rate was calculated from three measure-ments for each thermocouple. To get information about the cooling rate at different depths the three averaged cooling rate points were interpolated by exponential curve.
To derive information about the nitrided layer thickness the samples were cut and the cross-section was chemically treated by nital 2% reagent and then observed by using optical microscope Olympus BX60-M. Structure was observed by optical and scan-ning electron microscopy (SEM, Philips XL-30).
The existing phases in the top nitrided surface were deter-mined by Siemens D500 X-ray diffractometer in Bragg-Bretano geometry using CuKα (λ= 0.15406 nm) radiation. Diffraction spectra were obtained in an angular range of 2θbetween 30° and
100° with counting during 2 s per point. To get the depth phase profile the surface was worn by SiC sand papers (400, 600 and 1000 mesh). Phases were then obtained from three different depths (surface, 35 m and 65 μm) using glancing angle dif-fraction geometry. The glancing angle was set to 1 (depth detection limit of 0.2μm). Diffraction spectra were obtained in an angular range of 2θbetween 30 and 100 with counting during
4 s per point. The worn depth was controlled by micrometer (measuring the height of the sample) with a resolution of 1μm. The phases were determined also using conversion electron Mössbauer spectroscopy (CEMS) with57Co (in a Rh matrix) as radiation gamma source of nominal activity of 50 mCi. As a detector a proportional counter was used with internal flowing gas made of 5% of CH4and 95% of He. All measurements were performed at room temperature. CEMS spectra were fitted using sub-spectra corresponding toγ′-Fe4N andϵ-Fe2−3(C, N) and
using hyperfine parameters similar to those published[4,6].
Fig. 1. Internal part of the plasma nitriding system showing detail of oil reservoir, holder and push down rod.
Microhardness of the top nitrided surface of samples and also the microhardness profile in the cross-section was characterized by Shimadzu HMV-2 using load of 25 g during 20 s. Five indentations were made on the top surface and the average value was calculated. Each value of the microhardness profile in the cross-section was averaged from three measurements at same depth.
3. Results and discussion
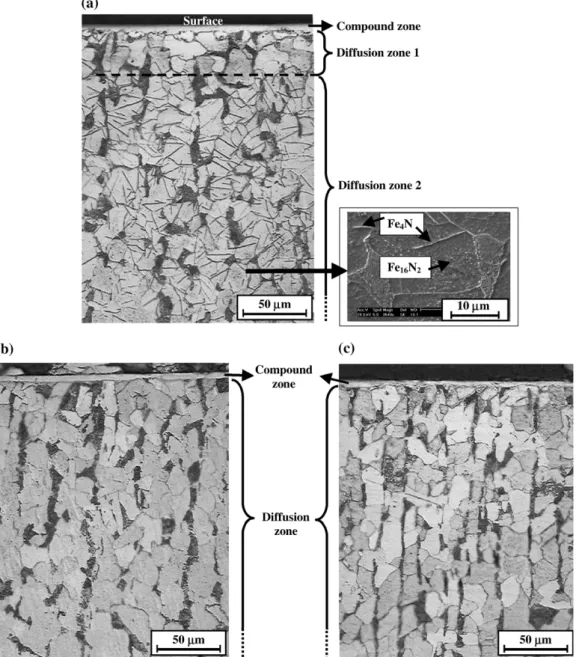
In samples nitrided at temperature of 500 °C and cooled (a) on the substrate holder, (b) at the bottom of the chamber and (c) in oil reservoir two distinct nitrided layer zones were identified in their cross-section micrographies (Fig. 3a,b,c): the compound zone, of about 4μm, close to the surface, and the diffusion zone. The total nitriding layer thickness of about 300μm was
mea-sured for sample cooled on the substrate holder, which is in good agreement with results obtained by Berg et al.[11]. For rapidly cooled samples (b) and (c), no interface was observed between the diffusion zone and the untreated bulk. The diffusion zone of the sample, which cooled slowly on the substrate holder (Fig. 3a), can be divided into two: the first one showing no precipitation of any nitride (diffusion zone 1) with thickness of about 30 μm and another one, deeper in the sample, char-acterized byγ′-Fe4N precipitation. Near the bulk interface we have detected small precipitates, possibly ofα″-Fe16N2, Rapidly cooled samples (Fig. 3b and c) exhibit only one diffusion zone with the same characteristics as diffusion zone 1 of the sample cooled on the substrate holder.
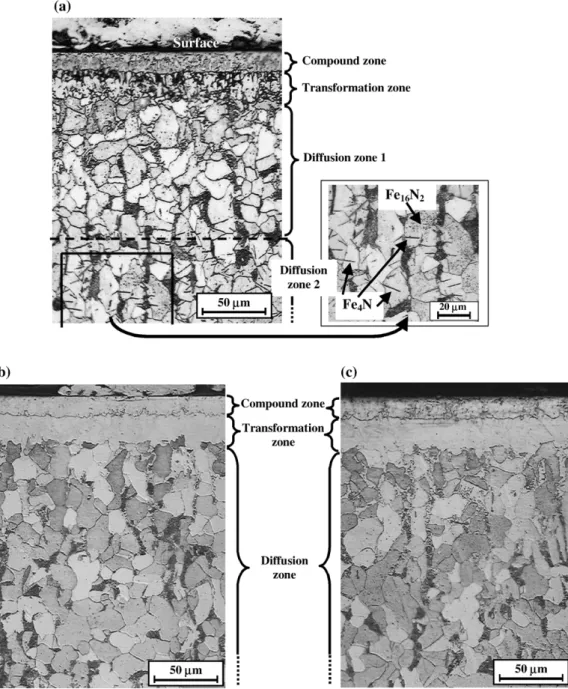
The cross-sections of samples nitrided at 580 °C and cooled slowly on substrate holder and rapidly (at the bottom of the chamber and in the oil reservoir) are shown inFig. 4a, b and c.
The compound zone in all three samples has thickness of about 17 μm. Another zone was identified between the compound zone and the diffusion zone. According to Alves Jr. [3], this zone, whose thickness is about 23 μm for all three samples, was named transformation zone. Such zone exhibits, precipitates of nitrides at grain boundaries of the sample slowly cooled. It is interesting to mention that no indication of precipitates was observed on the transformation zone of the samples rapidly cooled.
The diffusion zone of the sample nitrided at 580 °C and cooled on the substrate holder (Fig. 4a) can be divided in two: diffusion zone 1, which extends approximately to the depth of 110 μm, followed by diffusion zone 2, whose thickness was difficult to estimate, because no interface with the bulk has been observed. While in the diffusion zone 1 no precipitation of any
nitride was detected, the diffusion zone 2 is characterized by the presence ofγ′-Fe4N precipitates in form of large needles (mostly 5 to 10 μm in length) and possibly α″-Fe16N2precipitates in form of small needles (less than 1μm).
X-ray diffraction patterns of the top surface of samples ni-trided at 500 °C and 580 °C followed by the cooling procedures are shown inFig. 5a and b, respectively.γ′-Fe4N andϵ-Fe2−3N
phases were detected in the compound zone of all samples. Concentrations of these phases were found to depend on the cooling process. Deconvolution were made of peaks at 41°; 43.9° and 47.9° for samples nitrided at 500 °C and cooled on substrate holder and in the oil reservoir. As shown inTable 1the compound zone of the sample cooled at substrate holder contains 10% ofϵphase and 90% ofγ′phase, while for the sample cooled in oil reservoir it was observed 17% ofϵphase and 83% ofγ′
phase. In addition, XRD and CEMS measurements of the surface of these two samples revealed again the presence ofϵ-Fe2−3N
andγ′-Fe4N phases. Fitted CEMS spectra for samples nitrided at 500 °C are shown inFig. 6. Quantitatively (seeTable 1) it can be seen that in the first 0.2μm of depth the amount ofϵ-Fe2−3N
is two to three times higher than that obtained from XRD. Table 1also shows that the amount ofϵ-Fe2−3N phase is higher
in rapidly cooled sample. This phase is a precursor toγ′-Fe4N phase[12]. If the cooling process is fast, no transformation of ϵ-Fe2−3N toγ′-Fe4N occurs and the concentration ofϵ-Fe2−3N
remains high in the sample, while during slow cooling the trans-formation ofϵ-Fe2−3N toγ′-Fe4N continues and the amount of ϵ-Fe2−3N decreases.
Fig. 5. XRD (Bragg–Brentano geometry) of samples nitrided at (a) 500 °C and (b) 580 °C, and cooled on the substrate holder, at the bottom of the chamber and in oil reservoir.
Table 1
Concentration of phases presented in samples nitrided at 500 °C and cooled on the substrate holder and in oil reservoir (obtained from deconvolution of XRD, glancing angle XRD and CEMS spectra)
XRD Glancing angle XRD
CEMS
γ′
-Fe4N
ϵ-Fe2
−3N
γ′
-Fe4N
ϵ-Fe2
−3N
γ′
-Fe4N
ϵ-Fe2
−3N
Sample cooled on substrate holder
90% 10% 74% 26% 76% 24%
Sample cooled in oil reservoir
83% 17% 66% 34% 63% 37%
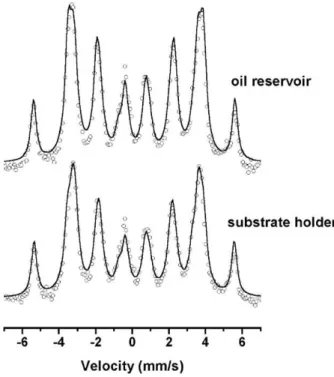
Fig. 6. CEMS spectra of samples nitrided at 500 °C and cooled on the substrate holder and in oil reservoir. The continuous curves represent fitted spectra.
Fig. 7. XRD (Glancing angle) of the surface, at the depths of 35μm and 65μm of
To evaluate the existence of phases at different depths, pro-gressive wear followed by polishing and XRD in glancing angle geometry were undertaken.Fig. 7shows glancing angle XRD spectra from surface and from depths of 35μm and 65μm of samples nitrided at temperature of 580 °C (summarized in the Table 2). It can be seen that on the surface as well as in the depth of 35μm (transformation zone) the quantity ofγ′-Fe4N phase is relatively lower for sample cooled rapidly in oil reservoir, while the quantity ofϵ-Fe2−3N phase is higher, which again confirms
results discussed above. Furthermore, for the sample cooled in oil reservoir it can be observed that the quantity of γ′-Fe4N phase at depth of 35μm is relatively lower than on the surface, while the quantity ofϵ-Fe2−3N phase is higher. According to
Fe–C–N diagram at 600 °C we can relate this increased quantity ofϵ-Fe2−3N phase at this depth with carbon presence in steel,
which makesϵ-Fe2−3N phase more stable[7].
At depths of 35 and 65μmα(ferrite) andγ(austenite) phases were detected for sample cooled in oil reservoir as well as for sample cooled on substrate holder. The amount of austenite is relatively higher for sample cooled rapidly. Once again it is shown that phase transformation (from γ to α) during slow cooling process occurs. However, the cooling rate when sample is left on the substrate holder is not sufficiently slow for the full phase transformationγ→α+γ′. The existence of precipitates of γ′-Fe4N and α¢¢-Fe16N2 in diffusion zone 2, while no pre-cipitates were detected in diffusion zone 1 in this sample (Fig. 4a), means that diffusion zone 1 is formed by solid solution of nitrogen inγand α-Fe. As the nitriding conditions are the same for sample cooled in oil reservoir (Fig. 4c), we can assume that the whole diffusion zone of this sample is made up of solid solution of nitrogen inγandα-Fe.
The existence of γ-Fe phase in depths of 35 and 65 μm (Fig. 7) reveals that the samples reached and possibly surpassed austenization temperature of about 590 °C during treatment, while the nominal nitriding process temperature was 580 °C. To get an idea about the temperature gradient inside the samples, three thermocouples at different depths were inserted in two of them, which were nitrided at 500 °C and 580 °C and cooled on the substrate holder (Fig. 2). These temperature gradients are shown inFig. 8. It can be clearly seen that 100μm below the surface the measured temperature is about 550 °C and 640 °C, respectively. In case of sample treated at nominal temperature of 580 °C, we can see that the real temperature during of plasma process in compound and diffusion zone was above the austenitization temperature of about 590 °C (system Fe–N).
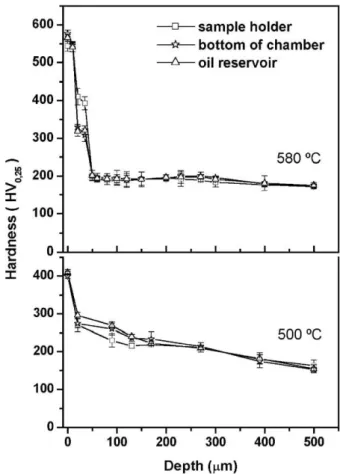
InFig. 9, microhardness profiles of the nitrided layers of all samples treated at 500 °C and 580 °C are shown. For samples nitrided at 580 °C the microhardness abruptly falls down after surpassing the compound zone, while for samples treated at 500 °C the microhardness decreases gradually from compound zone to the diffusion one.
The results above demonstrate that caution has to be taken with process temperature measurement. In our case, there is a
Table 2
Phases obtained during a progressive wear in surface of nitrided samples for depths of 35μm and 65μm at temperature of 580 °C
Position Cooling Phases
Diffusion zone 1 (65μm)
Substrate holder γ-Fe andα-Fe
Oil reservoir γ-Fe andα-Fe
Transformation zone (35μm)
Substrate holder γ′-Fe4N;ϵ-Fe2−3N;γ-Fe andα-Fe
Oil reservoir γ′-Fe4N;ϵ-Fe2−3N;γ-Fe andα-Fe
Compound zone (surface)
Substrate holder γ′-Fe4N andϵ-Fe2−3N
Oil reservoir γ′-Fe4N andϵ-Fe2−3N
Fig. 8. The temperature gradient inside samples during nitriding at nominal temperature of 500 °C and 580 °C.
difference of about 10% between the nominal temperature of the process (thermocouple 3 inserted at depth of 4 mm from surface) and the temperature measured at depth of 100μm from surface. The nitrided samples will different properties depend-ing on the definition of the nominal process temperature and can be very different from those expected. For example, works of Marchev et al.[13,14]; Li[15]and Sun et al.[16]disagree as concerning to the relation between surface composition in nitrided austenitic AISI 316 steel and treatment temperature. In this way it is very difficult to compare results from one work to another. Taking into accounting that such a variety of possible relationships make difficult the nitriding process modeling task, we suggest that certain standardization of the working tem-perature measurement should be adopted.
To determine the effect of cooling rate on the structural char-acteristics of the obtained diffusion zone of the sample treated at 580 °C and cooled on substrate holder, the medium cooling rate (for each thermocouple) was calculated and displayed as a function of the depth (Fig. 10). The dashed line roughly separates diffusion zone 1 and from 2. It crosses cooling rate curve at point A, which corresponds to medium cooling rate of about 0.95 °C/s. It means, that in order to obtain solid state solution of nitrogen inγ andα-Fe, the cooling rate should be higher than 0.95 °C/s.
Because in case of samples cooled rapidly at the bottom of chamber and in oil reservoir were not observed precipitates of any nitrides in whole diffusion zone, it can be concluded that the cooling rate in that zone was well above a critical value of 0.95 °C/s.
4. Conclusions
During plasma processing, mainly dc plasma, a thermal gradient happens due to the ionic bombardment. This work shows the
implications when samples of carbon steel are submitted to dif-ferent cooling rates after plasma nitriding. Difdif-ferent cooling pro-cedures after plasma treatment of AISI 1010 steel samples have great influence on the characteristics of the obtained nitrided layers:
1. Morphologically, different structure zones were obtained. At 500 °C, samples cooled slowly on substrate holder exhibited two diffusion zones, one without precipitates and another with precipitates γ′-Fe4N and α¢¢-Fe16N2. For samples cooled rapidly on the bottom of the chamber, as well as in oil reservoir, the diffusion zone is unique with nitrogen in solid solution at the matrix.
2. At 580 °C, besides the structures observed at 500 °C, another zone, named transformation zone, was obtained in all the samples. For sample cooled slowly on the substrate holder γ′-Fe4N andϵ-Fe2−3N precipitates on the grain boundaries
were detected in this zone.
3. The compound zone is formed byγ′-Fe4N andϵ-Fe2−3N.
Concentration ofϵ-Fe2−3N phase in this zone was found to
be higher when the sample is cooled rapidly in oil reservoir. There is no sufficient time for ϵ-Fe2−3N toγ′-Fe4N phase
transformation. Directly on the surface the concentration of ϵ-Fe2−3N was detected to be higher too.
4. To get solid state solution of nitrogen in the diffusion zone of AISI 1010 steel, instead of precipitates of nitride phases, the cooling rate should be higher than critical value of 0.95 °C/s, which is responsible for existence of two distinct diffusion zones.
5. Temperature gradient was obtained inside the samples during the process of nitriding. The difference between the near surface temperature and defined process temperature at depth of 4 mm was approximately 10%. In case of sample nitrided at 580 °C the real treatment temperature reached and possibly surpassed austenization temperature of about 590 °C, which was confirmed by existence ofγ-Fe phase at depths of 35 and 65 μm. To get smooth microhardness depth profile, the treatment temperature should be maintained below this tem-perature. It is difficult to compare results from various authors without proper standardization of treatment temperature, because different nitrided layer properties will be reported for one“treatment temperature”.
Acknowledgements
This work has been partially supported by the Brazilian agencies, PROCAD/CAPES, PADCT/FINEP and CNPq.
References
[1] J.R. Roth, Industrial Plasma Engineering Volume 1: Principles, IOP Publishing Ltd, Bristol, 1995.
[2] M. Ohring, The Material Science of Thin Films, Academic Press, San Diego, 1992.
[3] C. Alves Jr., Nitretação a Plasma: Fundamentos e Aplicações, Edufrn, Natal, 2001, pp. 13–86.
[4] E.J. Miola, S.D. de Souza, M. Olzon-Dionysio, D. Spinelli, M.R.F. Soares, M.A.Z. Vasconcellos, C.A. dos Santos, Mater. Sci. Eng., A Struct. Mater.: Prop. Microstruct. Process. 256 (1998) 60.
[5] P. Schaaf, Prog. Mater. Sci. 47 (2002) 1. Fig. 10. (a) cross-section and (b) cooling rate as a function of depth of sample
[6] G. Simon, M.A.Z. Vasconcellos, C.A. dos Santos, Surf. Coat. Technol. 102 (1998) 90.
[7] B. Edenhofer, Heat Treat. Met. (1974) 59 part II.
[8] B.-Y. Jeong, M.-H. Kim, Surf. Coat. Technol. 141 (2001) 182. [9] E. Metin, O.T. Inal, J. Mater. Sci. 22 (1987) 2783.
[10] A. Sokolowska, J. Rudnicki, P. Beer, L. Maldzinski, J. Tacikowski, J. Baszkiewicz, Surf. Coat. Technol. 142–144 (2001) 1040.
[11] M. Berg, C.V. Budtz-Jørgensen, H. Reitz, K.O. Schweitz, J. Chevallier, P. Kringhøj, J. Bøttiger, Surf. Coat. Technol. 124 (2000) 25.
[12] A. Bogaerts, E. Neyts, R. Gijbels, J.V. Der Mullen, Spectrochim. Acta, Part B: Atom. Spectrosc. 57 (2002) 609.
[13] K. Marchev, J.-T. Blucher, C.V. Cooper, B.C. Giessen, Surf. Coat. Technol. 99 (1998) 225.
[14] K. Marchev, R. Hidalgo, M. Landis, R. Vallerio, C.V. Cooper, B.C. Giessen, Surf. Coat. Technol. 112 (1999) 67.
[15] X.Y. Li, Surf. Eng. 17 (2001) 147.