Diagnosing Active Tuberculosis in Children and Adults in
a High Burden Setting
Michala V. Rose1,2*, Godfather Kimaro3, Thomas N. Nissen2, Inge Kroidl4,5, Michael Hoelscher5, Ib C. Bygbjerg1, Sayoki G. Mfinanga3, Pernille Ravn6
1Department of International Health, Immunology and Microbiology, University of Copenhagen, Copenhagen, Denmark,2Clinical Research Centre, University Hospital Hvidovre, Hvidovre, Denmark,3Muhimbili Medical Research Centre, National Institute for Medical Research, Dar es Salaam, Tanzania,4NIMR-Mbeya Medical Research Programme, Mbeya, Tanzania,5Department of Infectious Diseases and Tropical Medicine, Klinikum of the University of Munich, Munich, Germany,6Department for Infectious Diseases, University Hospital Odense, Odense, Denmark
Abstract
Aim:To determine whether QuantiFERONH-TB Gold In-Tube (QFT) can contribute to the diagnosis of active tuberculosis (TB) in children in a high-burden setting and to assess the performance of QFT and tuberculin skin test (TST) in a prospective cohort of TB suspect children compared to adults with confirmed TB in Tanzania.
Methods:Sensitivity and specificity of QFT and TST for diagnosing active TB as well as indeterminate QFT rates and IFN-c
levels were assessed in 211 TB suspect children in a Tanzanian district hospital and contrasted in 90 adults with confirmed pulmonary TB.
Results:Sensitivity of QFT and TST in children with confirmed TB was 19% (5/27) and 6% (2/31) respectively. In adults sensitivity of QFT and TST was 84% (73/87) and 85% (63/74). The QFT indeterminate rate in children and adults was 27% and 3%. Median levels of IFN-c were lower in children than adults, particularly children ,2 years and HIV infected. An indeterminate result was associated with age,2 years but not malnutrition or HIV status. Overall childhood mortality was 19% and associated with an indeterminate QFT result at baseline.
Conclusion: QFT and TST showed poor performance and a surprisingly low sensitivity in children. In contrast the performance in Tanzanian adults was good and comparable to performance in high-income countries. Indeterminate results in children were associated with young age and increased mortality. Neither test can be recommended for diagnosing active TB in children with immature or impaired immunity in a high-burden setting.
Citation:Rose MV, Kimaro G, Nissen TN, Kroidl I, Hoelscher M, et al. (2012) QuantiFERONH-TB Gold In-Tube Performance for Diagnosing Active Tuberculosis in Children and Adults in a High Burden Setting. PLoS ONE 7(7): e37851. doi:10.1371/journal.pone.0037851
Editor:Lorenz von Seidlein, Menzies School of Health Research, Australia ReceivedJanuary 15, 2012;AcceptedApril 27, 2012;PublishedJuly 12, 2012
Copyright:ß2012 Rose et al. This is an open-access article distributed under the terms of the Creative Commons Attribution License, which permits unrestricted use, distribution, and reproduction in any medium, provided the original author and source are credited.
Funding:The study was financially supported by the KNCV Tuberculosis Foundation, Reinholdt Jorck’s Fund, Cluster in International Health, Justesen’s Fund, Danish Research Council and Danish International Development Assistance (74-08-UHH DANIDA). The funders had no role in study design, data collection and analysis, decision to publish, or preparation of the manuscript.
Competing Interests:The authors have read the journal’s policy and have the following conflicts to declare: Pernille Ravn has been an invited speaker by Cellestis and has received QFT-IT kits at a reduced price for nonprofit research. Hvidovre Hospital has filed patents on the use of IP-10 as a marker for infection with Mycobacterium tuberculosis. Pernille Ravn is one of the registered co-inventors. This does not alter the authors’ adherence to all the PLoS ONE policies on sharing data and materials.
* E-mail: [email protected]
Introduction
The aim of this study was to investigate the potential of the interferon-crelease assay (IGRA) QuantiFERONH-TB Gold
In-Tube (QFT) (Cellestis Limited Chadstone, Australia) as a reliable diagnostic tool for physicians in Tanzania, a high TB burden country, with considerable prevalence of HIV and malnutrition, for diagnosing active TB in children.
TB is a major contributor to childhood morbidity and mortality, with children ,5 years at highest risk and 40–50% of infected infants developing disease within 1–2 years [1,2]. However childhood TB is notoriously difficult to confirm, due to its pauci-bacillary nature, and existing tools have limited performance [3].
In TB endemic countries, diagnosis is usually a clinical diagnosis, relying on recognition of clinical features, suggestive chest x-ray (CXR) and if available a positive tuberculin skin test (TST) [4]. However it can be difficult to distinguish between the signs and symptoms of TB, HIV and malnutrition, and CXRs and TST results can be difficult to interpret [5,6].
QFT relies on M.tuberculosis (MTB) specific T-cell responses,
measuring levels of interferon-gamma (IFN-c) released in whole
blood in response to stimulation with the MTB specific antigens: ESAT-6, CFP-10 and TB7.7, indicating past or present infection. IGRAs are generally more specific than TST, since they do not cross-react with the BCG vaccine, M.avium or most other
used worldwide as an alternative to, or in conjunction with, TST [7] for diagnosing latent TB and although not directly diagnostic for active TB, IGRAs are often used by clinicians as an additional tool in the diagnosis of active TB [8]. However there is a lack of evidence of the performance in children, especially in young children in a high burden setting [9].
In this study the performance of QFT was assessed in terms of sensitivity, specificity, indeterminate rates, median IFN-c levels
and risk factor analysis for positive and indeterminate results. Performance of TST for diagnosing active TB was included for comparison. Considering the diagnostic challenges in children and difficulties in assuring a gold standard of confirmed TB, adults with confirmed active TB, from the same location, were included as a measure of contrast.
Methods
Ethics Statement
The study protocol was approved by the Tanzanian Medical Research Coordinating Committee (NIMR/HQ/R.8a/Vol IX/ 584) and was evaluated by the Danish Central Ethical Committee without any objections. Written informed consent was obtained from the immediate caretaker, or next of kin, prior to inclusion, on behalf of children participating in the study. The standards for reporting diagnostic accuracy studies (STARD) criteria were followed in reporting the results.
Study Setting and Population
The study participants were recruited prospectively at Muheza designated district hospital, Tanga, Tanzania. Muheza is a rural district with a population of 209.480, where 90% are engaged in peasantry, fishery and small-scale business [10]. The TB notification rate in the district in 2009 was 431/100.000 [11].
Children,15 years with TB suspect signs and symptoms were included consecutively from the paediatric ward and outpatients departments, including the HIV, TB, and mother-child clinics. Adults with active TB were included consecutively from the TB clinic. Inclusion criteria are listed in Box S1.
A standardized questionnaire was used to record demographic and clinical details of the participants, including age, weight, height, TB specific signs and symptoms and presence of BCG scar. For the children additional information was collected about history of BCG vaccine, TB exposure, response to prior antibiotic treatment and history of health facility visits.
All the study participants provided blood for QFT and HIV testing. Chest x-rays and TST were performed and either sputum or gastric wash samples were sent for microscopy and culture examination. Follow-up of the children was conducted 2 and 6 months after inclusion, involving a standardised clinical examina-tion and quesexamina-tionnaire concerning health status since last examination. Children who did not return for follow-up were traced within 7–12 months of inclusion.
Interferon Gamma Release Assay (IGRA)
Venous blood was collected in a syringe and immediately dispensed into the QFT tubes, Nil (negative control coated with saline), TB-Ag (coated with MTB specific antigens) and Mitogen (positive control coated with phytohaemaggluttin), according to the manufacturer’s instructions (Cellestis Ltd). The tubes were taken to the laboratory within 4 hours and incubated at 37uC for 16–24 hours.
Immediately after incubation the samples were centrifuged and the supernatants stored at minus 70uC, until IFN-cwas measured
using the QFT ELISA at the NIMR-Mbeya Medical Research Programme laboratory, Tanzania. The results were reported as positive, negative or indeterminate according to the manufactur-er’s instructions. In addition the raw quantitative results were recorded.
The results of the first 61 QFT tests revealed that 82% of the results were indeterminate with poor response in all the QFT tubes. Thorough quality assurance of all the test procedures indicated that the tubes had been stored under conditions with temperatures reaching above 30uC. This was considered to be the most likely the reason for the high number of indeterminate results. All the tubes were replaced and new tubes were stored at 5–10uC, until the time they were used.
Tuberculin Skin Testing (TST)
Two units of purified protein derivate RT23 from Staten Serum Institute, Denmark, were administered intradermally using the mantoux technique recommended by the manufac-turer. The transverse diameter of the induration was recorded in millimetres after 48–72 hours. An induration of$5 mm was
considered positive in HIV positive children and adults whilst an induration of$10 mm was considered positive for all others.
Chest X-Ray (CXR)
The children were chest x-rayed at inclusion. The CXRs were read by three experts; the hospital radiologist and two independent senior radiologists, who were unaware of the clinical status of the child. Using a standardised recording form, the CXRs were classified as either certain TB, highly suggestive TB, uncertain or not TB, based on TB specific or suggestive features. CXRs from 202 children were included.
Microbiology
Sputum or gastric wash samples were collected from the children on three consecutive mornings. Gastric wash samples were collected in containers containing 100 mg sodium carbonate. Ascites samples were included for 2 patients, whilst no cerebro-spinal fluid or lymph node samples were included. The adults were initially diagnosed with smear positive TB at the Muheza district hospital laboratory using the Ziehl-Neelsen staining technique for acid fast bacteria. An extra sputum sample was collected from the adults for confirmation of diagnosis. All the gastric wash and sputum samples were refrigerated, on average 4 days, until they were sent for confirmatory microscopy and culture at the Central TB Reference Lab, Dar es Salaam (CTRL) where auramine staining was used for fluorescence microscopy and Lo¨wenstein-Jensen media for culture. Para-nitrobenzoic acid, which inhibits MTB but not NTMs, was added in positive samples to exclude NTMs.
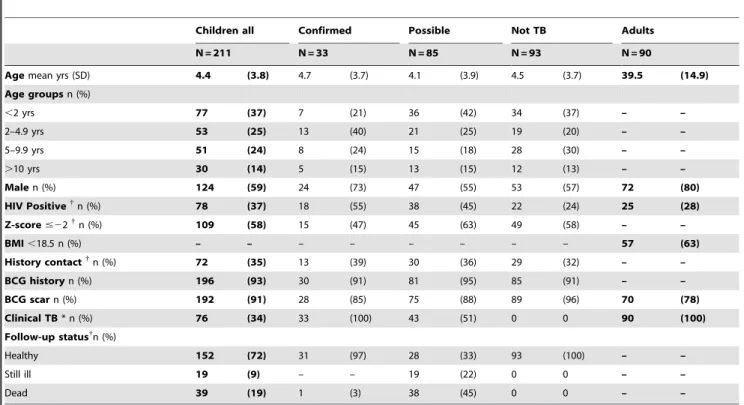
Table 1.Characteristics of study population.
Children all Confirmed Possible Not TB Adults
N = 211 N = 33 N = 85 N = 93 N = 90
Agemean yrs (SD) 4.4 (3.8) 4.7 (3.7) 4.1 (3.9) 4.5 (3.7) 39.5 (14.9)
Age groupsn (%)
,2 yrs 77 (37) 7 (21) 36 (42) 34 (37) – –
2–4.9 yrs 53 (25) 13 (40) 21 (25) 19 (20) – –
5–9.9 yrs 51 (24) 8 (24) 15 (18) 28 (30) – –
.10 yrs 30 (14) 5 (15) 13 (15) 12 (13) – –
Malen (%) 124 (59) 24 (73) 47 (55) 53 (57) 72 (80)
HIV Positive{
n (%) 78 (37) 18 (55) 38 (45) 22 (24) 25 (28)
Z-score#22{
n (%) 109 (58) 15 (47) 45 (63) 49 (58) – –
BMI,18.5 n (%) – – – – – – – – 57 (63)
History contact{
n (%) 72 (35) 13 (39) 30 (36) 29 (32) – –
BCG historyn (%) 196 (93) 30 (91) 81 (95) 85 (91) – –
BCG scarn (%) 192 (91) 28 (85) 75 (88) 89 (96) 70 (78)
Clinical TB* n (%) 76 (34) 33 (100) 43 (51) 0 0 90 (100)
Follow-up status{ n (%)
Healthy 152 (72) 31 (97) 28 (33) 93 (100) – –
Still ill 19 (9) – – 19 (22) 0 0 – –
Dead 39 (19) 1 (3) 38 (45) 0 0 – –
{
TB Diagnosis and Classification
The clinical TB diagnosis in children and the decision to start anti-TB treatment was made by the district TB medical doctor or the medical doctor in charge of the paediatric ward. The study team was not involved other than ensuring that the TB medical
doctor was consulted on each case and providing the results of CXR, TST and HIV test. The results of the QFT test were not available to the physicians responsible for diagnosing or treating the children.
Each child was assigned to one of four predefined diagnostic classifications; ‘‘Microbiologically confirmed TB’’, ‘‘Highly prob-able TB’’, ‘‘Possible TB’’ and ‘‘Not TB’’. The classifications were based on microscopy and culture data, CXR results, clinical examination and follow-up data (Box S2). For data analysis children with microbiologically confirmed TB and highly probable TB were considered to have confirmed TB. Children without follow-up data were excluded, unless they had microbiologically confirmed TB. Adults with either positive culture or positive fluorescence microscopy were classified as confirmed TB.
Data Management and Statistical Analysis
Data were double-entered into a data entry database using MS-Access (Microsoft Corp, VA, USA) including error, range and consistency check programs. Statistical analyses were performed using StataTM v 10.0 (Stata Corp, TX, USA). Epi InfoTM3.5.2 (CDC, USA) was used to generate weight-for-age z-scores to assess nutritional status in children.
Indeterminate results were excluded in the sensitivity and specificity analysis as well as in the risk factor analysis for a positive QFT result. Student’s t-test was used to compare means, Wilcoxon’s rank-sum test for comparing medians, using log transformation for data that was not normally distributed.
Logistic regression analysis was used for univariable and multivariable analysis of risk factors’ association with positive
Table 2.Median IFN-cU/ml in all three Quantiferon TB Gold
In-Tube tubes in children and adults.
Children Negative control Positive control TB antigens
IFN-cU/ml (IQR) IFN-cU/ml (IQR)
IFN-cU/ml (IQR) All (TB suspect) 0.15* (0.09–0.35) 2.05* (0.6–7.53) 0.19* (0.1–0.55)
Confirmed TB 0.15* (0.12–0.26) 3.8 (1.08–7.26) 0.17* (0.10–0.48)
Possible TB 0.13* (0.08–0.27) 1.69* (0.44–7.33) 0.17* (0.10–0.56)
Not TB 0.19* (0.09–0.38) 2.26 (0.80–7.61) 0.19* (0.11–0.55)
Adults
Confirmed TB 0.36 (0.22–0.59) 2.63 (1.29–8.09) 3.28(0.99–6.58)
Comparison of median IFN-cvalues in the three QFT tubes in children and adults according to diagnostic TB classificaiton. There were significantly lower levels* (p,0.05) in all subgroups of children compared to adults, except in the positive control where median levels in children with confirmed and not TB were not significantly different to levels in adults.
Wilcoxon’s rank-sum test used to test difference between median IFN-cin children and adults.
IQR: interquartile range.
doi:10.1371/journal.pone.0037851.t002
Table 3.Comparison of median IFN-cresponses in all TB suspect children.
Negative control Positive control TB antigens
IFN-cU/ml (IQR) p-value{
IFN-cU/ml (IQR) p-value{
IFN-cU/ml (IQR) p-value{
Age ,2 yrs 0.14 (0.07–0.21) – 1.32 (0.4–8.05) – 0.14 (0.08–0.35) –
$2 yrs 0.16 (0.1–0.44) 0.01 2.37 (1.01–7.33) 0.09 0.21 (0.12–0.64) 0.01
Sex Male 0.17 (0.09–0.45) – 2.18 (0.73–7.54) – 0.21 (0.12–0.57) –
Female 0.14 (0.09–0.24) 0.08 1.48 (0.49–7.53) 0.27 0.15 (0.09–0.39) 0.04
HIV status Pos 0.14(0.09–0.24) – 1.4 (0.47–5.61) – 0.15 (0.09–0.29) –
Neg 0.17 (0.09–0.52 0.09 2.49 (0.8–8.89) 0.07 0.2 (0.1–0.84) 0.01
Z-score #22 0.14 (0.09–0.37) – 1.75 (0.6–6.46) – 0.18 (0.09–0.49) –
.–2 0.15 (0.09–0.45) 0.45 2.49 (0.78–9–87) 0.32 0.21 (0.11–0.79) 0.20
History contact yes 0.17 (0.10–0.–36) 2.48 (0.99–7.39) 0.19 (0.10–0.56)
no 0.15 (0.09–0.37) 0.56 1.77 (0.53–8.18) 0.37 0.19 (0.10–0.54) 0.77
Living PTB+* yes 0.12 (0.1–0.25) 1.91 (0.63–4.35) 0.17 (0.09–0.55)
no 0.15 (0.09–0.37) 0.51 1.77 (0.53–8.18) 0.51 0.19 (0.1–0.54) 0.79
Clinical TB** yes 0.15 (0.10–0.41) 2.28 (0.73–7.45) 0.18 (0.1–0.56)
no 0.15 (0.08–0.34) 0.69 1.91 (0.52–7.53) 0.56 0.19 (0.1–0.53) 0.68
Follow–up status Healthy*** 0.16(0.09–0.39) – 2.65 (0.95–8.8) – 0.19(0.11–0.55) –
Ill 0.16 (0.08–0.35) 0.59 1.08 ((0.33–2.68) 0.04 0.24 (0.1–0.58) 0.37
Died 0.11 (0.05–0.2) 0.01 1.02 (0.19–4.39) ,0.01 0.15 (0.07–0.4) 0.18
Comparison of median IFN-cin subgroups of children, finding lower median levels in response to specific TB antigens in children,2 years, girls and HIV infected and lower median mitogen responses in children who subsequently died.
{Wilcoxon’s rank-sum test used to test differences in median
IFN-cbetween subgroups of children, p,0.05 considered significant. IQR: interquartile range.
*Living PTB+defined as living in the same household as a person with smear positive pulmonary TB. **Clinically diagnosed with TB and put on anti-TB therapy.
and indeterminate QFT results, using 95% confidence intervals to quantify uncertainty. Risk factors that could potentially be associated with the performance of the test were identified from previous studies (age, sex, HIV status, nutritional status and contact history).
Kaplan Meier failure estimates, odds ratios and log-rank test were used to illustrate and quantify the difference in mortality according to QFT results. A p-value of ,0.05 was considered statistically significant.
Results
Study Population
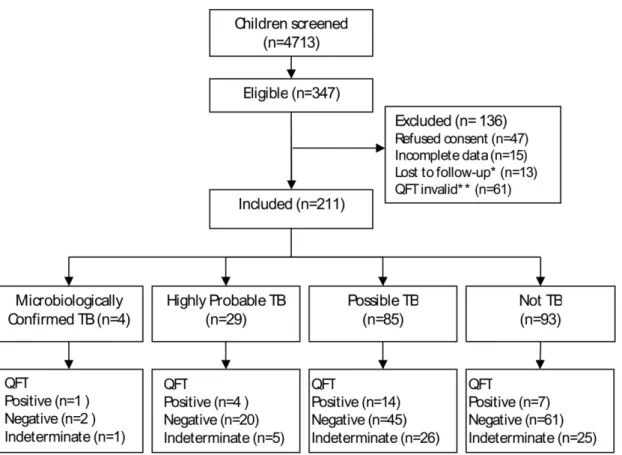
From April 2008 to June 2010 4713 children were screened, 347 children were eligible according to our inclusion criteria and 211 children with TB suspect signs and symptoms were included (figure 1). 107 Ziehl-Neelsen smear microscopy positive adults were screened, 90 with either positive culture and/or positive fluorescence microscopy were included. Characteristics of the study populations are shown in table 1.
Four children were culture positive, two of whom were also fluorescence microscopy positive. In adults 70 were culture and fluorescence microscopy positive, whilst an additional 4 were positive by culture only and 16 by microscopy only.
Based on the above and the criteria in box S2, 33/211 (16%) of children were classified as ‘‘confirmed TB’’, 85/211 (40%) ‘‘possible TB’’ and 93/211 (44%) ‘‘not TB’’. All 90 adults were classified as ‘‘confirmed TB’’.
TST Results
TST results were available for 197 children (6% positive) and 74 adults (85% positive). Two of four children with TST indurations measuring 5–9 mm were considered TST positive because they were HIV positive. The one adult with an induration of 5–9 mm was HIV negative.
QFT Results
QFT results were positive in 26 (12%), negative in 128 (61%) and indeterminate in 57 (27%) children. Amongst adults 73 (81%) were QFT positive, 14 (16%) negative and 3 (3%) indeterminate. One of the indeterminate results in children was due to high negative control (.8 U/ml), the remaining indeterminate results in children and adults were due to low response in the positive control.
The median levels of IFN-cwere significantly lower in children
compared to adults, especially in response to the TB antigens (table 2). Even children with a positive QFT result had a lower median IFN-cafter antigen stimulation (2.08 U/ml) than adults
with a positive QFT (4.09 U/ml), p = 0.03 (data not shown). The median IFN-cin response to TB antigens was significantly lower
in children under 2 years, in girls and HIV positive children (table 3). Amongst children with a positive QFT test, HIV positive children still had a significantly lower median IFN-cresponse to
TB antigens than HIV negative children (data not shown). Children who died before discharge or during the follow-up period, as well as those who were still ill at 6 month follow-up had lower median IFN-cin the positive control at base-line compared to those who had regained their health.
Sensitivity of QFT and TST for Diagnosing Active TB Amongst children, clinically diagnosed with TB and started on anti-TB treatment by the local physician, we found a sensitivity of QFT and TST of only 18% and 12% respectively. Amongst children with ‘‘confirmed TB’’ we found a sensitivity of QFT and TST of 19% and 6% respectively. The sensitivity of QFT and TST in children with ‘‘possible TB’’ was 24% and 9%, and in children with ‘‘not TB’’ 10% and 3% (table 4).
The specificity of QFT and TST in children was 90% and 98% respectively. The positive predictive value of QFT and TST in children for having confirmed TB was 42% and 40%, whilst the negative predictive value was 73% and 75% respectively.
In contrast, the diagnostic sensitivity of QFT and TST amongst adults with confirmed TB was notably higher than in children at 86% and 89% (table 4). Sensitivity of QFT was significantly lower in HIV positive adults 67% (16/24), compared to HIV negative adults 91% (57/63), p = 0.007 (data not shown). The sensitivity of TST in adults was not affected by HIV status. The specificity in adults was not calculated since the inclusion criteria was confirmed TB.
Risk Factors Association with Positive and Indeterminate QFT Results
Logistic regression analysis was used in order to identify possible causes for the low positivity rate and high indeterminate rate of QFT in children (Table 5 and 6).
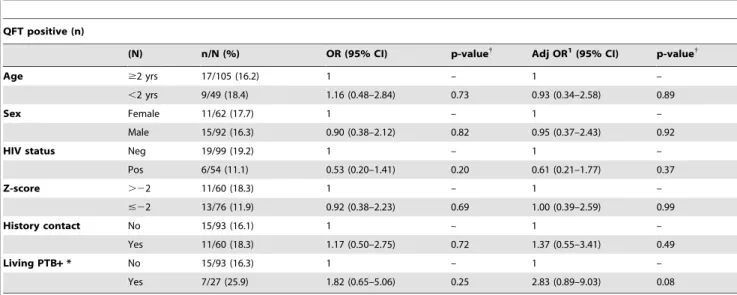
Neither sex, malnutrition nor HIV infection, were associated with either positive or indeterminate QFT results in the unadjusted or adjusted analysis. Surprisingly, history of TB
Table 4.Sensitivity of Quantiferon TB Gold In-Tube test and Tuberculin Skin test in children and adults.
QFT positive TST positive p-value{
Children n/all tested* (%) 95% CI n/all tested (%) 95% CI
Clinical TB diagnosis 11/60 (18.3) 8.4–28.3 8/69 (11.6) 3.9–19.3 0.28
Confirmed TB 5/27 (18.5) 3.4–33.6 2/31 (6) 22.4–15.3 0.16
Possible TB 14/59 (23.7) 12.7–34.8 7/77 (9.1) 2.6–15.6 0.02
Not TB 7/68 (10.3) 3.0–17.6 3/89 (3.4) 20.4–7.2 0.03
Adults
Confirmed TB 73/87 (83.9) 76.0–91.8 63/74 (85.1) 76.8–93.4 0.85
Sensitivity of QFT and TST according to TB status in children and adults, showing low sensitivity of both T-cell based test in children, irrespective of TB classification, compared to adults with confirmed TB.
*Sensitivity analysis of QFT excludes indeterminate results.
contact was not associated with a positive QFT result, even after adjusting for confounders in the multivariable analysis.
Age seemed to influence the test performance as children,2 years were more likely to have an indeterminate result (adjusted OR 2.39, p = 0.01).
In adults HIV infection was negatively associated with a positive QFT result (adjusted OR 0.25, p = 0.04) (table 7), whilst we found no effect of age, sex or HIV status when analysing risk factors for an indeterminate result (table 8). We were unable to determine association with BMI as none with a BMI.18.5 had an indeterminate result.
Mortality
Eleven children died during admission, whilst an additional 28 children died during the follow up period, resulting in an overall
mortality of 19%. An indeterminate QFT result at baseline was associated with subsequent high childhood mortality (adjusted OR 3.87, p = 0.003, data not shown) and the cumulative mortality was significantly higher in children with an indeterminate QFT result (33%) compared to a determinate result (13%), p,0.001 (figure 2).
Discussion
The main findings of this study were a low sensitivity of both QFT and TST for diagnosing active TB in children as well as a high QFT indeterminate rate which was associated with high subsequent mortality.
We found a surprisingly low sensitivity of QFT in children with confirmed TB (19%) compared to adults with confirmed TB (84%). The sensitivity of TST was similarly poor in children (6%) compared to adults (85%). Using other criteria for
Table 5.Risk factors association with positive QFT results in children.
QFT positive (n)
(N) n/N (%) OR (95% CI) p-value{
Adj OR1(95% CI) p-value{
Age $2 yrs 17/105 (16.2) 1 – 1 –
,2 yrs 9/49 (18.4) 1.16 (0.48–2.84) 0.73 0.93 (0.34–2.58) 0.89
Sex Female 11/62 (17.7) 1 – 1 –
Male 15/92 (16.3) 0.90 (0.38–2.12) 0.82 0.95 (0.37–2.43) 0.92
HIV status Neg 19/99 (19.2) 1 – 1 –
Pos 6/54 (11.1) 0.53 (0.20–1.41) 0.20 0.61 (0.21–1.77) 0.37
Z-score .22 11/60 (18.3) 1 – 1 –
#22 13/76 (11.9) 0.92 (0.38–2.23) 0.69 1.00 (0.39–2.59) 0.99
History contact No 15/93 (16.1) 1 – 1 –
Yes 11/60 (18.3) 1.17 (0.50–2.75) 0.72 1.37 (0.55–3.41) 0.49
Living PTB+* No 15/93 (16.3) 1 – 1 –
Yes 7/27 (25.9) 1.82 (0.65–5.06) 0.25 2.83 (0.89–9.03) 0.08
Risk factor analysis using logistic regression analysis found no association between known risk factors and a positive QFT result in children. OR: unadjusted odds ratio from univariable analysis.
Adj OR: adjusted odds ratio, adjusted for age, sex, HIV, z-score and contact TB case. {
p-value for the odds ratios.
*Compares living with a case of smear positive TB case to those reporting no contact at all. doi:10.1371/journal.pone.0037851.t005
Table 6.Risk factors association with indeterminate QFT results in children.
QFT indeterminate (n)
(N) n/N (%) OR (95% CI) p-value{
Adj OR (95% CI) p-value{
Age $2 yrs 29/134 (21.6) 1 – 1 –
,2 yrs 28/77 (36.4) 2.07 (1.11–3.85) 0.02 2.39 (1.22–4.68) 0.01
Sex Female 25/87 (28.7) 1 – 1 –
Male 32/124 (25.8) 0.86 (0.47–1.59) 0.64 0.79 (0.40–1.54) 0.49
HIV status Neg 32/131 (24.4) 1 – 1 –
Pos 24/78 (30.8) 1.38 (0.74–2.57) 0.32 1.28 (0.63–2.63) 0.50
Z-score .22 19/79 (24.1) 1 – 1 –
#22 33/109 (30.3) 1.37 (0.71–2.65) 0.35 1.09 (0.53–2.21) 0.82
Risk factor analysis using logistic regression analysis found increased odds of an indeterminate result in children,2 years. OR: unadjusted odds ratio from univariable analysis.
Adj OR: adjusted odds ratio, adjusted for age, sex, HIV and z-score. {p-value for the odds ratios.
diagnosing TB, such as the clinical TB diagnosis or by including children with possible TB in the group of TB cases, did not alter the overall picture of an extremely low sensitivity. In addition the positive and negative predictive values of QFT in children were low.
We found a high specificity ($90%) for both QFT and TST, either suggesting that false positive results due to latent TB or BCG vaccination did not influence the performance of the tests or reflecting the overall poor performance of the test, with low proportions of positive results in this population.
The few existing previous paediatric studies have reported QFT sensitivity for active TB varying from 50%–100% [12]. To our knowledge only one other study has evaluated QFT in a high burden setting and they found only 8 children with confirmed TB and a sensitivity of 63% [13]. Studies evaluating T-SpotH-TB, another commercially available IGRA (Oxford Immunotec, Abingdon, UK), in children in a high endemic setting are equally few, one study in South Africa study with 10 culture confirmed cases of TB, found a sensitivity of 50% [14].
We found only 12 children with a positive TST, which is surprising given that 72 (35%) reported contact to person with TB
and 92.9% were BCG vaccinated. The sensitivity of TST (6%) was even lower than QFT.
Infants are known to have poor production of cytokines, such as IFN-c, even beyond infancy [15] and there is evidence that an
effective antigen specific response to the MTB infection is delayed and less effective in infants compared to adults [16] which could explain our comparatively low positivity rate. Not only young age [13] but also HIV infection [17] and malnutrition, [18] were expected to affect test sensitivity, due to immature immune response or suppression of T-cell response. We found no clear association in our risk factor analysis between these factors and the QFT positivity rate, possibly due to small sample size, however we did find reduced IFN-c responses in children ,2 years, HIV infected and children who were still ill or had died by 6 month follow-up. Children in low-income settings often present with severe TB after a long period of illness, and consequent suboptimal immune response [19,20]. These findings suggest that the performance of QFT as well as TST, in these children with chronic and severe illness, were affected by immature or impaired immunity and progressive exhaustion of T-cells ability to react adequately to antigen response [21].
Table 7.Risk factors association with positive QFT result in adults.
QFT positive (n)
(N) n/N (%) OR (95% CI) p-value{
Adj. OR (95% CI) p-value{
Ageyears* – 1.0 (0.96–1.04) 0.93 0.10 (0.95–1.04) 0.89
Sex Female 11/16 (68.8) 1 1
Male 62/71 (87.3) 3.13 (0.88–11.12) 0.08 2.07 (0.49–8.81) 0.33
HIV status Neg 57/63 (90.5) 1 1
Pos 16/24 (66.7) 0.21 (0.06–0.70) 0.01 0.25 (0.07–0.92) 0.04
BMI $18.5 28/33 (84.9) 1 1
,18.5 45/54 (83.3) 0.89 (0.27–2.94) 0.85 0.81 (0.23–2.84) 0.74
Risk factor analysis using logistic regression analysis found lower odds of a positive QFT result in HIV infected adults. OR: odds ratio from univariable analysis.
Adj. OR: adjusted odds ratio adjusted for age, sex, HIV infection and BMI. *Odds ratio calculated as per year increase in age.
{p-value for the odds ratios. doi:10.1371/journal.pone.0037851.t007
Table 8.Risk factors association with indeterminate QFT result in adults.
QFT indeterminate (n)
(N) n/N (%) OR (95% CI) p-value{
Adj. OR (95% CI) p-value{
Ageyears* – 1.06 (0.99–1.15) 0.10 1.10 (0.99–1.22) 0.07
Sex Female 2/18 (11.1) 1 – 1 –
Male 1/72 (1.4) 0.11 (0.01–1.32) 0.08 0.02 (0.00–1.28) 0.07
HIV status Neg 2/65 (3.1) 1 – 1 –
Pos 1/25 ((4) 1.31 (0.11–15.15) 0.83 0.47 (0.01–17.02) 0.68
BMI** $18.5 0/33 – – – –
,18.5 3/57 (5.3) – – – –
Risk factor analysis using logistic regression analysis found no association between suspected risk factors and an indeterminate QFT result in adults. OR: odds ratio from univariable analysis.
Adj. OR: adjusted odds ratio adjusted for age, sex, HIV infection and BMI. *Odds ratio calculated as per year increase in age.
**Logistic regression analysis not possible for association between BMI and indeterminate result, since there are no indeterminate results in those with BMI$18.5. {
Due to the lower levels of IFN-cin response to specific antigens
seen in HIV infected and young children it has been suggested that a lower cut-off value for a positive QFT for children may be relevant [22]. However applying a cut-off of 0.26 U/ml to our data only increased the number of positives by two, both of whom were classified ‘‘not TB’’. Thus our study does not indicate added value of a lower cut-off in terms of sensitivity of QFT for active TB.
The poor sensitivity of, not only QFT but also TST, could also be explained by misclassification and over-diagnosis of TB however we included microbiological confirmation, good clinical response to treatment, in addition to either typical CXR or clinical features, which is in accordance with the recommendations of the recent expert consensus report on evaluating TB diagnostics in children [23].
Like other studies including TB suspect children we found only a small proportion of culture confirmed cases (2%). In the four culture confirmed cases of TB there was only one QFT and one TST positive result (in the same child), indicating that, rather than a classification problem, the performance of T-cell based assays in this particular group of children is suboptimal. Two of the remaining children with culture confirmed TB, were both HIV positive and severely malnourished, and it reasonable to conclude that they were not able to mount an adequate immune response. Our results highlight the difficulties in diagnosing TB in children and we cannot conclude whether QFT suffers from extremely low sensitivity in young children with active TB in a high burden country or whether TB was over-diagnosed in these very sick children. However in light of the review by Mandalakas et al [12] which found that sensitivity of IGRAs and TST was lower in children ,5 years, HIV positive children and in low-middle income countries, our finding of low sensitivity is not unlikely.
In adults we found a sensitivity of 84% which compares to the pooled sensitivity of 80% in a recent review of IGRA studies [8]
and in line with another Tanzanian study [17] and the review by Metcalfe [24], we also found a lower sensitivity amongst HIV positive adults.
We found a high indeterminate rate in children (27%) compared to adults (3%) (p,0.01) with higher rates amongst children ,2 years and in children who subsequently died after inclusion. Surprisingly our data did not support a significant association with HIV infection or malnutrition possibly due to low numbers.
Indeterminate rates in other paediatric QFT studies range from 0–35% [13,25], high rates correlated with young age [26], immune suppression [25] and malnutrition [27]. Thomas et al [27] found, in a study in Bangladesh that indeterminate results were associated not only with malnutrition but also with helminth infection, suggesting that children in a generally poor nutritional state with added infections are less likely to have a determinate QFT result. Hook worm and schistosomiasis are known to be highly prevalent amongst school children in the study area [28] and we can reasonably assume that many of the study participants were co-infected, which may have influenced the performance of QFT [29].
In our study 58% of children were defined as being malnourished. Malnutrition leads to an impaired cellular immu-nity which could affect the performance of the IGRA tests [18,30] however several studies conducted in populations with significant malnutrition [13,31], including the current study, did not find malnutrition to be associated with reduced positivity rates or increased indeterminate results. It is possible that weight-for-age z-score is not the optimal measure for assessing the effect of malnutrition on IGRA responses. A study of Peruvian adults found that malnutrition as measured by corrected arm muscle area, but not BMI or body fat, was associated with decreased TST positivity [32].
No previous paediatric studies have shown that an indetermi-nate result is a risk factor for death. To our knowledge only one Figure 2. Childhood mortality according to Quantiferon TB Gold In-Tube result.Childhood mortality recorded during admission and at 6 month follow-up, according to QFT results. Children who did not attend scheduled follow-up at 6 months were traced and follow-up visits were conducted in their homes within 7–12 months of inclusion. Both the mortality during admission and the overall mortality in children with an indeterminate QFT result was significantly higher than in children with a determinate QFT result, p,0.001. * One of 154 children with a determinate QFT result did not have follow-up data.
study in TB-suspect HIV positive adults in Uganda has shown that mortality was higher in those with an indeterminate T-SPOT.TB result [33]. It is reasonable to hypothesise that the children who died after inclusion were severely ill and therefore unable to mount an appropriate immune response. Thus, we suggest that the care for children with indeterminate results should be intensified with extensive diagnosis and treatment.
We found a low indeterminate rate of 3% amongst adults. Even amongst the HIV positive adults, the indeterminate rate was only 4% which contrasts to other studies, including HIV infected participants, where indeterminate rates reach as high as 21% [34]. HIV infection is known to be associated with lower positivity rates [35] and our data support these findings.
The samples of both children and adults were taken and processed concurrently, at the same hospital using the same staff, procedures and equipment. As such, it is most unlikely that the poor performance in children was due to technical errors.
Our study suggests that T-cell based assays, such as QFT and TST, have poor performance in children with immature or impaired immune systems and that indeterminate results are a predictor for death. With a sensitivity of 19% amongst children with confirmed TB and indeterminate rate of 27%, QFT is not the answer for providing clinicians with a reliable tool for diagnosing childhood TB in a high burden setting. This conclusion is in line with recent reports that underline that IGRA cannot be used as a test to exclude active TB in children [36], that use of IGRAs is not recommended in children under 5 years [7] and according to WHO should not be used in low and middle income countries at all [37]. Whether low sensitivity is due to poor antigen response, misclassification or over-diagnosis remains a major challenge for the evaluation of any new diagnostic test for TB in children
however the evidence of high mortality in this vulnerable group serves to underline the continued importance of research in this field.
Supporting Information
Box S1 Inclusion criteria.
(DOC)
Box S2 Diagnostic classifications. Classifications in chil-dren in line with previous paediatric studies (Liebeschuetz 2004, Marais 2006, Bamford 2010) and in accordance with a recent expert consensus on TB classifications for the use in childhood TB research (Graham 2012).
(DOC)
Acknowledgments
The authors would like to thank Teule Hospital patients and caretakers, the staff and administration for facilitating the research, lab staff at Teule Hospital, CTRL and NIMR-Mbeya Medical Research Programme, with a special thank you to Ben Amos for invaluable help with laboratory issues, The Regional and District TB coordinators, Dr Kijazi and Dr Fadhili for assistance and supportive supervision throughout the study and the Joint Malaria Program for administrative support.
Author Contributions
Conceived and designed the experiments: MVR PR IB GK SGM. Performed the experiments: MVR GK IK TNN. Analyzed the data: MVR TNN GK IK SGM PR IB. Contributed reagents/materials/analysis tools: MVR PR IK MH GK SGM. Wrote the paper: MVR SGM IB PR. Final approval of the manuscript: MVR GK TNN IK MH SGM IB PR.
References
1. Chintu C, Mudenda V, Lucas S, Nunn A, Lishimpi K, et al. (2002) Lung diseases at necropsy in African children dying from respiratory illnesses: a descriptive necropsy study. Lancet 360: 985–990. S0140–6736(02)11082–8 [pii];10.1016/S0140–6736(02)11082–8 [doi].
2. McNally LM, Jeena PM, Gajee K, Thula SA, Sturm AW, et al. (2007) Effect of age, polymicrobial disease, and maternal HIV status on treatment response and cause of severe pneumonia in South African children: a prospective descriptive study. Lancet 369: 1440–1451. S0140–6736(07)60670–9 [pii];10.1016/S0140– 6736(07)60670–9 [doi].
3. Marais BJ, Gie RP, Schaaf HS, Beyers N, Donald PR, et al. (2006) Childhood pulmonary tuberculosis: old wisdom and new challenges. Am J Respir Crit Care Med 173: 1078–1090. 200511–1809SO [pii];10.1164/rccm.200511–1809SO [doi].
4. WHO/HTM/TB/2006/371 (2006) Guidance for national tubeculosis pro-grammes on the management of tuberculosis in children.
5. Van RP (2002) The use of the paediatric tuberculosis score chart in an HIV-endemic area. Trop Med Int Health 7: 435–441. 882 [pii].
6. Du TG, Swingler G, Iloni K (2002) Observer variation in detecting lymphadenopathy on chest radiography. Int J Tuberc Lung Dis 6: 814–817. 7. Mazurek M, Jereb J, Vernon A, LoBue P, Goldberg S, et al. (2010) Updated
guidelines for using Interferon Gamma Release Assays to detect Mycobacterium tuberculosis infection - United States, 2010. MMWR Recomm Rep 59: 1–25. rr5905a1 [pii].
8. Sester M, Sotgiu G, Lange C, Giehl C, Girardi E, et al. (2011) Interferon-{gamma} release assays for the diagnosis of active tuberculosis: a systematic review and meta-analysis. Eur Respir J 37: 100–111. 09031936.00114810 [pii];10.1183/09031936.00114810 [doi].
9. Lewinsohn DA, Lobato MN, Jereb JA (2010) Interferon-gamma release assays: new diagnostic tests for Mycobacterium tuberculosis infection, and their use in children. Curr Opin Pediatr 22: 71–76. 10.1097/MOP.0b013e3283350301 [doi].
10. Muheza District Council (2010) Muheza District Council Report 2009. 11. Mbago F (2010) Annual TB and Leprosy Report. Muheza District 2009. 12. Mandalakas AM, Detjen AK, Hesseling AC, Benedetti A, Menzies D (2011)
Interferon-gamma release assays and childhood tuberculosis: systematic review and meta-analysis. Int J Tuberc Lung Dis. 0631 [pii];10.5588/ijtld.10.0631 [doi].
13. Dogra S, Narang P, Mendiratta DK, Chaturvedi P, Reingold AL, et al. (2007) Comparison of a whole blood interferon-gamma assay with tuberculin skin testing for the detection of tuberculosis infection in hospitalized children in rural
India. J Infect 54: 267–276. S0163–4453(06)00147–2 [pii];10.1016/ j.jinf.2006.04.007 [doi].
14. Nicol MP, Davies MA, Wood K, Hatherill M, Workman L, et al. (2009) Comparison of T-SPOT.TB assay and tuberculin skin test for the evaluation of young children at high risk for tuberculosis in a community setting. Pediatrics 123: 38–43. 123/1/38 [pii];10.1542/peds.2008–0611 [doi].
15. Jaspan HB, Lawn SD, Safrit JT, Bekker LG (2006) The maturing immune system: implications for development and testing HIV-1 vaccines for children and adolescents. AIDS 20: 483–494. 10.1097/01.aids.0000210602.40267.60 [doi];00002030–200602280–00001 [pii].
16. Newton SM, Brent AJ, Anderson S, Whittaker E, Kampmann B (2008) Paediatric tuberculosis. Lancet Infect Dis 8: 498–510. S1473–3099(08)70182–8 [pii];10.1016/S1473–3099(08)70182–8 [doi].
17. Aabye MG, Ravn P, PrayGod G, Jeremiah K, Mugomela A, et al. (2009) The impact of HIV infection and CD4 cell count on the performance of an interferon gamma release assay in patients with pulmonary tuberculosis. PLoS One 4: e4220. 10.1371/journal.pone.0004220 [doi].
18. Pai M, Lewinsohn DM (2005) Interferon-gamma assays for tuberculosis: is anergy the Achilles’ heel? Am J Respir Crit Care Med 172: 519–521. 172/5/519 [pii];10.1164/rccm.2506003 [doi].
19. Bjerrum S, Rose MV, Bygbjerg IC, Mfinanga SG, Tersboel BP, et al. (2012) Primary health care staff’s perceptions of childhood tuberculosis: a qualitative study from Tanzania. BMC Health Serv Res 12: 6. 1472–6963–12–6 [pii];10.1186/1472–6963–12–6 [doi].
20. Marais BJ, Schaaf HS (2010) Childhood tuberculosis: an emerging and previously neglected problem. Infect Dis Clin North Am 24: 727–749. S0891– 5520(10)00031–0 [pii];10.1016/j.idc.2010.04.004 [doi].
21. Yi JS, Cox MA, Zajac AJ (2010) T-cell exhaustion: characteristics, causes and conversion. Immunology 129: 474–481. IMM3255 [pii];10.1111/j.1365– 2567.2010.03255.x [doi].
22. Lighter J, Rigaud M, Eduardo R, Peng CH, Pollack H (2009) Latent tuberculosis diagnosis in children by using the QuantiFERON-TB Gold In-Tube test. Pediatrics 123: 30–37. 123/1/30 [pii];10.1542/peds.2007–3618 [doi].
23. Graham SM, Ahmed T, Amanullah F, Browning R, Cardenas V, et al. (2012) Evaluation of Tuberculosis Diagnostics in Children: 1. Proposed Clinical Case Definitions for Classification of Intrathoracic Tuberculosis Disease. Consensus From an Expert Panel. J Infect Dis. jis008 [pii];10.1093/infdis/jis008 [doi]. 24. Metcalfe JZ, Everett CK, Steingart KR, Cattamanchi A, Huang L, et al. (2011)
adults in low- and middle-income countries: systematic review and meta-analysis. J Infect Dis 204 Suppl 4: S1120–S1129. jir410 [pii];10.1093/infdis/ jir410 [doi].
25. Haustein T, Ridout DA, Hartley JC, Thaker U, Shingadia D, et al. (2009) The likelihood of an indeterminate test result from a whole-blood interferon-gamma release assay for the diagnosis of Mycobacterium tuberculosis infection in children correlates with age and immune status. Pediatr Infect Dis J 28: 669– 673. 10.1097/INF.0b013e3181a16394 [doi];00006454–200908000–00001 [pii]. 26. Bergamini BM, Losi M, Vaienti F, D’Amico R, Meccugni B, et al. (2009) Performance of commercial blood tests for the diagnosis of latent tuberculosis infection in children and adolescents. Pediatrics 123: e419–e424. 123/3/e419 [pii];10.1542/peds.2008–1722 [doi].
27. Thomas TA, Mondal D, Noor Z, Liu L, Alam M, et al. (2010) Malnutrition and helminth infection affect performance of an interferon gamma-release assay. Pediatrics 126: e1522–e1529. peds.2010–0885 [pii];10.1542/peds.2010–0885 [doi].
28. Tatala SR, Kihamia CM, Kyungu LH, Svanberg U (2008) Risk factors for anaemia in schoolchildren in Tanga Region, Tanzania. Tanzan J Health Res 10: 189–202.
29. Hamm DM, Agossou A, Gantin RG, Kocherscheidt L, Banla M, et al. (2009) Coinfections with Schistosoma haematobium, Necator americanus, and Entamoeba histolytica/Entamoeba dispar in children: chemokine and cytokine responses and changes after antiparasite treatment. J Infect Dis 199: 1583–1591. 10.1086/598950 [doi].
30. Cegielski JP, McMurray DN (2004) The relationship between malnutrition and tuberculosis: evidence from studies in humans and experimental animals. Int J Tuberc Lung Dis 8: 286–298.
31. Liebeschuetz S, Bamber S, Ewer K, Deeks J, Pathan AA (2004) Diagnosis of tuberculosis in South African children with a T-cell-based assay: a prospective cohort study. Lancet 364: 2196–2203. S0140673604175922 [pii];10.1016/ S0140–6736(04)17592–2 [doi].
32. Pelly TF, Santillan CF, Gilman RH, Cabrera LZ, Garcia E, et al. (2005) Tuberculosis skin testing, anergy and protein malnutrition in Peru. Int J Tuberc Lung Dis 9: 977–984.
33. Cattamanchi A, Ssewenyana I, Davis JL, Huang L, Worodria W, et al. (2010) Role of interferon-gamma release assays in the diagnosis of pulmonary tuberculosis in patients with advanced HIV infection. BMC Infect Dis 10: 75. 1471–2334–10–75 [pii];10.1186/1471–2334–10–75 [doi].
34. Hoffmann M, Ravn P (2010) The use of Interferon-gamma release assays in HIV positive individuals. European Infectious Disease, 2010; 4(1): 23–29. 35. Raby E, Moyo M, Devendra A, Banda J, De HP, et al. (2008) The effects of HIV
on the sensitivity of a whole blood IFN-gamma release assay in Zambian adults with active tuberculosis. PLoS One 3: e2489. 10.1371/journal.pone.0002489 [doi].
36. European Centre for Disease Prevention and Control (2011) Use of interferon-gamma release assays in support of TB diagnosis.