ZHEN-JIA-LIU zhenjialiu@163.com
Doctor in Accounting and Finance from the Changzhou University, School of Business - Changzhou - Jiangsu, China
ARTICLES
Submitted 01.23.2014. Approved 04.28.2014
Evaluated by double blind review process. Scientiic Editor: Ricardo Ratner Rochman
CROSS-COUNTRY STUDY ON THE
DETERMINANTS OF BANK FINANCIAL DISTRESS
Estudo cross-country sobre os fatores determinantes da crise financeira bancária
Estudio cross-country sobre los factores determinantes de la crisis financiera bancaria
ABSTRACT
Bank failures afect owners, employees, and customers, possibly causing large-scale economic dis-tress. Thus, banks must evaluate operational risks and develop early warning systems. This study investigates bank failures in the Organization for Economic Co-operation and Development, the North America Free Trade Area (NAFTA), the Association of Southeast Asian Nations, the European Union, newly industrialized countries, the G20, and the G8. We use inancial ratios to analyze and explore the appropriateness of prediction models. Results show that capital ratios, interest income compared to interest expenses, non-interest income compared to non-interest expenses, return on equity, and provisions for loan losses have signiicantly negative correlations with bank failure. However, loan ratios, non-performing loans, and ixed assets all have signiicantly positive correlations with bank failure. In addition, the accuracy of the logistic model for banks from NAFTA countries provides the best prediction accuracy regarding bank failure.
KEYWORDS | Bank failure prediction, bank, distress, global, cross-country.
RESUMO
Falências bancárias afetam proprietários, funcionários e clientes, e têm potencial para causar crises econômicas de grande escala. Portanto, os bancos devem avaliar os riscos operacionais e desenvol-ver sistemas de alerta preventivo. O presente estudo investiga falências bancárias na Organização para a Cooperação e Desenvolvimento Econômico, nos países integrantes do Tratado de Livre Comér-cio da América do Norte (NAFTA, na sigla em inglês), na Associação de Nações do Sudeste Asiático, na União Europeia, em países recentemente industrializados, no G20 e no G8. Utilizamos indicadores inanceiros para analisar e explorar a adequação de modelos preditivos. Os resultados demons-tram que índices de capital, juros ativos comparados a despesas com juros, receitas excluindo juros comparadas a despesas excluindo juros, rentabilidade sobre o patrimônio e provisões para prejuí-zos sobre empréstimos têm correlações signiicantemente negativas com falências bancárias. No entanto, índices de empréstimos, créditos de liquidação duvidosa e ativos ixos têm correlações sig-niicantemente positivas com falências bancárias. Além disso, a exatidão do modelo logístico para os bancos dos países que fazem parte do NAFTA fornece melhor precisão em termos de previsão no que diz respeito à falência bancária.
PALAVRAS-CHAVE | Previsão de falência bancária, bancos, crise, global, cross-country.
RESUMEN
Las quiebras bancarias afectan a los propietarios, empleados y clientes, y pueden causar dificultades económicas a gran escala. Por lo tanto, los bancos deben evaluar los riesgos operativos y desarrollar sistemas de alerta temprana. Este estudio investiga las quiebras bancarias en la Organización para la Cooperación y el Desarrollo Económicos, el Área del Tratado de Libre Comercio de América del Norte (NAFTA, en inglés), la Asociación de Naciones del Sudeste Asiático, la Unión Europea, los países de reciente industrialización, el G20 y el G8. Usamos ratios financieros para analizar y explorar la ade-cuación de los modelos de predicción. Los resultados muestran que los ratios de capital, ingresos por intereses en comparación con los gastos por intereses, ingresos no por intereses en comparación con los gastos no por intereses, rentabilidad sobre recursos propios y provisiones por riesgos crediticios tienen correlaciones significativamente negativas con la quiebra bancaria. Por otro lado, los ratios de préstamos, préstamos morosos y activos fijos tienen correlaciones significativamente positivas con la quiebra bancaria. Además, la exactitud del modelo logístico de los bancos de los países del NAFTA ofrece la mayor exactitud en la predicción de quiebras bancarias.
PALABRAS CLAVE | Predicción de quiebra bancaria, banco, dificultades, mundial, cross-country.
INTRODUCTION
In contemporary economies, banks play a critical role in pro-viding inancing channels. Banks operate by obtaining interest from loans. Banks are a crucial medium for stabilizing the inan-cial order and promoting industrial development; consequently, bank failures negatively afect stockholders, employees, cus-tomers, and, in some cases, national economies, which may subsequently result in an international inancial crisis. The sub-prime mortgage crisis in the United States in 2007 was the most severe inancial crisis since the Great Depression of 1929. Because of the inadequate liquidity of the US banking industry, the Board of Governors of the Federal Reserve System bailed out banks in inancial distress. However, the inancial distress still afected other countries and led to a global inancial crisis that jeopardized the development of the global capital market. How to efectively evaluate bank operations and establish inancial early warning systems has been a primary responsibility of competent authori-ties at inancial institutions in all nations. Unpredictable failures frequently occur because the inancial status of a bank appears to be stable prior to its failure. The irst inancial warning system was developed in 1970. Min, Lee, and Han (2006) highlighted that banks’ inancial warning allowed bank operators to analyze lending decisions and proitability.
It is widely believed that the majority of existing studies on bank failure has relied too heavily on bank-level accounting data (Al-Saleh & Al-Kandari, 2012; Boyacioglu, Kara, & Baykan, 2009; Männasoo & Mayes, 2009; Ravisankar & Rav, 2010; Serra-no-Cinca & Gutiérrez-Nieto, 2013; Valahzaghard & Bahrami, 2013; Yildiz & Akkoc, 2010; Zaghdoudi, 2013). These solutions appear to have shown that inancial ratios are more capable of detect-ing bank distress than other factors. However, most of these studies have considered a single country for analysis (Al-Saleh & Al-Kandari, 2012; Boyacioglu et al., 2009; Erdogan, 2008; Lanine & Vennet, 2006; Serrano-Cinca & Gutiérrez-Nieto, 2013; Sinha, Taneja, & Gothi, 2009; Valahzaghard & Bahrami, 2013; Zaki, Bah, & Rao, 2011).
Diferent countries have diferent types of government, culture, laws, and economic development. Banks’ operational system and environment also difer substantially from one nation to another and, therefore, cannot be considered equiva-lent. Huang, Chang, and Liu (2012) irst analyzed regional groups’ early warning systems for bank inances. However, the results pre-sented only ive inancial ratios and did not include all countries in each regional group (instances where no data was available were excluded). In addition, Huang et al. (2012) did not conduct various diagnostic tests (such as, e.g., an accuracy evaluation). Thus, they could not conduct analyses regarding the ‘reliability’
and ‘comparability’ of banks and predict bank failure in difer-ent countries.
We developed an optimal model, evaluated it for accu-racy (Divsalar, Javid, Gandomi, Sooi, & Mahmood, 2011), and compared the early warning indicators of bank failure in the Orga-nization for Economic Co-operation and Development (OECD), the North America Free Trade Area (NAFTA), the Association of South-east Asian Nations (ASEAN), the European Union (EU), newly industrialized countries (NIC), the G20, and the G8, based on the logistic model (i.e., the variables statistically signiicant in the model were based on each model).
RELATED LITERATURE
Altman’s (1968) study was the irst to predict bankruptcy in banks. Since then, logistic regression (Al-Saleh & Al-Kandari, 2012; Valahzaghard & Bahrami, 2013; Zaghdoudi, 2013), genetic algo-rithms (Martin, Gayathri, Saranya, Gayathri, & Venkatesan, 2011), multivariate discriminant analysis (Canbas, Cabuk, & Kilic, 2005; Demyanyk & Hasan, 2009), multivariate regression analysis (Meyer & Pifer, 1970), artiicial neural networks (Ravi & Pramodh, 2008), and fuzzy models (Tung, Quek, & Cheng, 2004; Yildiz & Akkoc, 2010) have served as general models for predicting bankruptcies. Bank operations are monitored through inancial or oper-ational statuses. The US Federal Deposit Insurance Corporation proposes ive components for analyzing bank safety: (a) Capital adequacy is a key component of an operational rating intended to prevent unpredictable loan losses from causing damage to depositors and creditors. (b) Asset quality refers to the evalu-ation of debtors’ ability to repay loans. (c) Management quality refers the evaluation of managers’ management capability or structure. (d) Earnings ability refers the evaluation of earnings stability. (e) Liquidity refers to the capability of dealing with dis-tress when abrupt bank runs occur. The composite ratings are referred to as CAMELS.
Several previous studies have investigated whether var-ious inancial ratios are efective variables for predicting and explaining a bank failure. Al-Saleh and Al-Kandari (2012) analyzed the irst ratio (Investment in Securities to Total Assets), second ratio (Loans to Total Assets), and third ratio (Loans to Depos-its), which are considered the best predictors of bank distress.
healthy banks. Zaghdoudi (2013) also showed that the probabil-ity of failure in a bank is decreased when the bank’s abilprobabil-ity to repay its debt and its banking operations are better and its prof-itability per employee and leverage are higher.
Adeyeye, Fajembola, Olopete, and Adedeji (2012) indicated that the measures of proitability, liquidity, credit risk and capital adequacy are the key predictive inancial ratios. In other words, diferences in proitability, liquidity, credit risk (asset quality) and capital adequacy (sustenance) are found to be the major distin-guishing characteristics between non-failed (healthy) and failed banks. Overall, the CAMEL components (i.e., its related inancial ratios) have been shown to predict bank failures.
METHODOLOGY
Financial ratios from 2002 to 2012 were collected from the COM-PUSTAT database and used to predict failure in banks. The study comprises 772 banks and 6,773 samples and uses a logistic model to construct empirical models. The variables and research model are as follows:
Dependent variables: bank failures
The deinitions of bank distress are primarily based on inancial statements. The present study modiied the Huang et al. (2012)
model, in which a cash low value lower than the value of liabili-ties in the current year suggests bank distress. If a bank showed bank distress in year t, the value was 1; if a bank showed no bank distress in year t, the value was 0.
Independent variables: inancial ratios
Boyacioglu et al. (2009) showed that successful banks had a lower ratio of loans to assets, a higher ratio of net proits to average equity, and a higher ratio of ixed assets to long-term liabilities. Yildiz and Akkoc (2010) stated that healthy banks had higher interest incomes compared to interest expenses, greater non-interest income compared to non-interest expenses, fewer non-performing loans compared to loans, and lower provisions for loan losses compared to loans. However,the empirical results of
Serrano-Cinca and Gutiérrez-Nieto (2013) indicated that healthy banks had higher Tier 1 (core) capital compared to average assets.
Control variables: macroeconomic factors
Macroeconomic indicators can assist in explaining how the envi-ronment interacts with bank problems. A substantial drop in GDP
growth is a strong indicator that banking problems might emerge
(Hutchison & McDill, 1999). In addition, banking sector distress is increased by falling stock prices (Hutchison & McDill, 1999), and increasing inlation is accompanied by bank failures (Män-nasoo & Mayes, 2009).
Empirical model
The study used the logistic method. The proxy variables are as follows: CAPITALj,t is Tier 1 (core) capital compared to average assets in year t; LOANj,t represents loans compared to assets in year t; NPLj,t is non-performing loans compared to all loans in year t; PL j,t is the provision for loan losses compared to all loans in year t; FAj,t is ixed assets compared to long liabilities in year t; ROEj,t is net proit compared to average equity in year
t; IIIEj,t is interest income compared to interest expenses in year t; NINIEj,t is non-interest income compared to non-interest expenses in year t; variable RGDPj,t represents the change in gross domestic product divided by the consumer price index in year t; STOCKj,t denotes the average deviation of the stock index over ive years in year t; and CPIj,t denotes the consumer price index in year t. (all the macro variables in the country where the bank headquarters are located). On the other hand, we tested the predictive aspect of our model up to three years before a failure because we found that further information besides the inancial position alone is necessary for a good, fair assessment
(Meyer & Pifer, 1970).
Robustness test
RESULTS
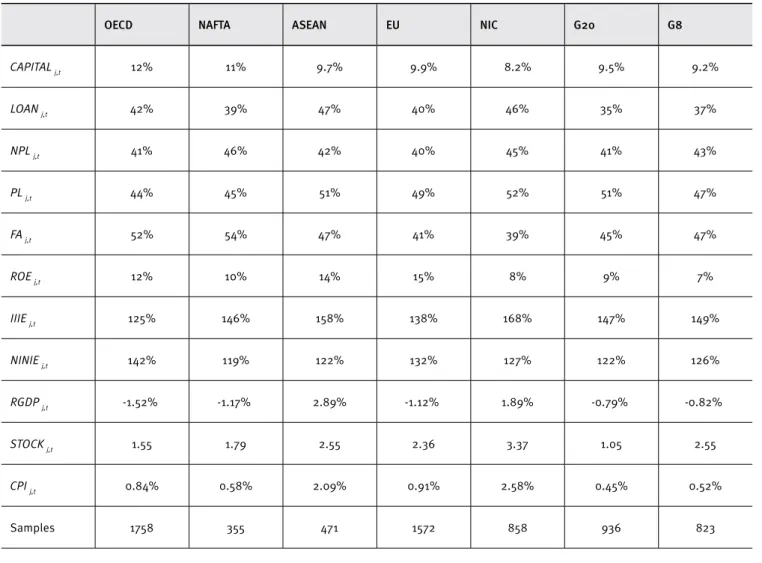
Table 1 lists the banks from OECD, NAFTA, ASEAN, EU, NIC, G20, and G8 countries. The capital ratios in these countries all exceed 6%, with the OECD at 12% (highest) and the NIC at 8.2% (lowest). Loans compared to assets ranged from 35% to 47%, non-perform-ing loans compared to loans averaged approximately 40%, and provision for loan losses compared to loans averaged from 40% to 50%. These results indicate that credit policies were robust and stable, and that appropriate loan losses are a suitable mea-sure for risk management.
In addition, ixed assets compared to long liabilities were more than 50% in the OECD and NAFTA, indicating that long lia-bilities were primarily used to purchase ixed assets, thereby adversely afecting capital movement. The return on equity had a positive value for all groups, with the EU at 15% (highest), and the G8 at 7% (lowest). Banks’ operating items (e.g., charging clients interest for loans and paying interest on deposits) had a positive value (interest income to interest expenses >100%),
with the NIC at 168% (highest) and the OECD at 125% (lowest). In addition, banks’ non-operating items (irrespective of interest payment/collection on deposits/loans) also had a positive value (non-interest income to non-interest expenses >100%), with the OECD at 142% (highest) and the NAFTA at 119% (lowest), indicat-ing that these two items were bank proit sources.
Compared to these variables, the change in real gross domestic product had a positive value in the ASEAN and NIC, indicating that these two groups experienced economic growth; however, the OECD had a negative value (the lowest of all seven groups), indicating an economic recession. Furthermore, the luctuation of the stock index was lower in the G20, thereby demonstrating a steady capital market. The NIC showed higher stock index luctuations, indicating that economic growth in the group caused capital from various countries to low into the stock market, or that transaction and exchange systems were incom-plete. Consumer price index in the NIC was high, indicating that the NIC experienced economic growth and a product demand increase.
Table 1.
Descriptive statistics: country samples (average values)
OECD NAFTA ASEAN EU NIC G20 G8
CAPITAL j,t 12% 11% 9.7% 9.9% 8.2% 9.5% 9.2%
LOAN j,t 42% 39% 47% 40% 46% 35% 37%
NPL j,t 41% 46% 42% 40% 45% 41% 43%
PL j,t 44% 45% 51% 49% 52% 51% 47%
FA j,t 52% 54% 47% 41% 39% 45% 47%
ROE j,t 12% 10% 14% 15% 8% 9% 7%
IIIE j,t 125% 146% 158% 138% 168% 147% 149%
NINIE j,t 142% 119% 122% 132% 127% 122% 126%
RGDP j,t -1.52% -1.17% 2.89% -1.12% 1.89% -0.79% -0.82%
STOCK j,t 1.55 1.79 2.55 2.36 3.37 1.05 2.55
CPI j,t 0.84% 0.58% 2.09% 0.91% 2.58% 0.45% 0.52%
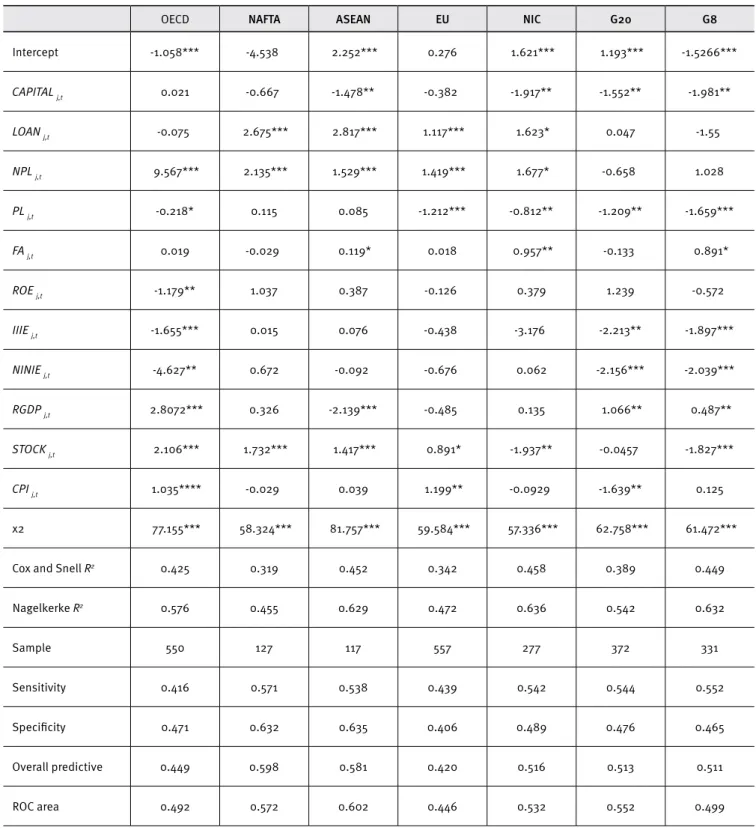
Table 2, Table 3 and Table 4 show that the capital ratio was signiicantly and negatively correlated to bank distress in banks from ASEAN, NIC, G20, and G8 countries. These results are consistent with those of Serrano-Cinca and Gutiérrez-Nieto (2013) and demon-strate that healthy inances do not occur when banks are experiencing bank distress. The loan ratio was signiicantly positively correlated with bank distress in the banks from NAFTA, ASEAN, EU, and NIC countries, which supports the results of Boyacioglu et al. (2009).
Table 2.
Relationships between inancial ratios and bank failure (one year before a failure)
OECD NAFTA ASEAN EU NIC G20 G8
Intercept -1.058*** -4.538 2.252*** 0.276 1.621*** 1.193*** -1.5266***
CAPITAL j,t 0.021 -0.667 -1.478** -0.382 -1.917** -1.552** -1.981**
LOAN j,t -0.075 2.675*** 2.817*** 1.117*** 1.623* 0.047 -1.55
NPL j,t 9.567*** 2.135*** 1.529*** 1.419*** 1.677* -0.658 1.028
PL j,t -0.218* 0.115 0.085 -1.212*** -0.812** -1.209** -1.659***
FA j,t 0.019 -0.029 0.119* 0.018 0.957** -0.133 0.891*
ROE j,t -1.179** 1.037 0.387 -0.126 0.379 1.239 -0.572
IIIE j,t -1.655*** 0.015 0.076 -0.438 -3.176 -2.213** -1.897***
NINIE j,t -4.627** 0.672 -0.092 -0.676 0.062 -2.156*** -2.039***
RGDP j,t 2.8072*** 0.326 -2.139*** -0.485 0.135 1.066** 0.487**
STOCK j,t 2.106*** 1.732*** 1.417*** 0.891* -1.937** -0.0457 -1.827***
CPI j,t 1.035**** -0.029 0.039 1.199** -0.0929 -1.639** 0.125
χ2 77.155*** 58.324*** 81.757*** 59.584*** 57.336*** 62.758*** 61.472***
Cox and Snell R2 0.425 0.319 0.452 0.342 0.458 0.389 0.449
Nagelkerke R2 0.576 0.455 0.629 0.472 0.636 0.542 0.632
Sample 550 127 117 557 277 372 331
Sensitivity 0.416 0.571 0.538 0.439 0.542 0.544 0.552
Speciicity 0.471 0.632 0.635 0.406 0.489 0.476 0.465
Overall predictive 0.449 0.598 0.581 0.420 0.516 0.513 0.511
ROC area 0.492 0.572 0.602 0.446 0.532 0.552 0.499
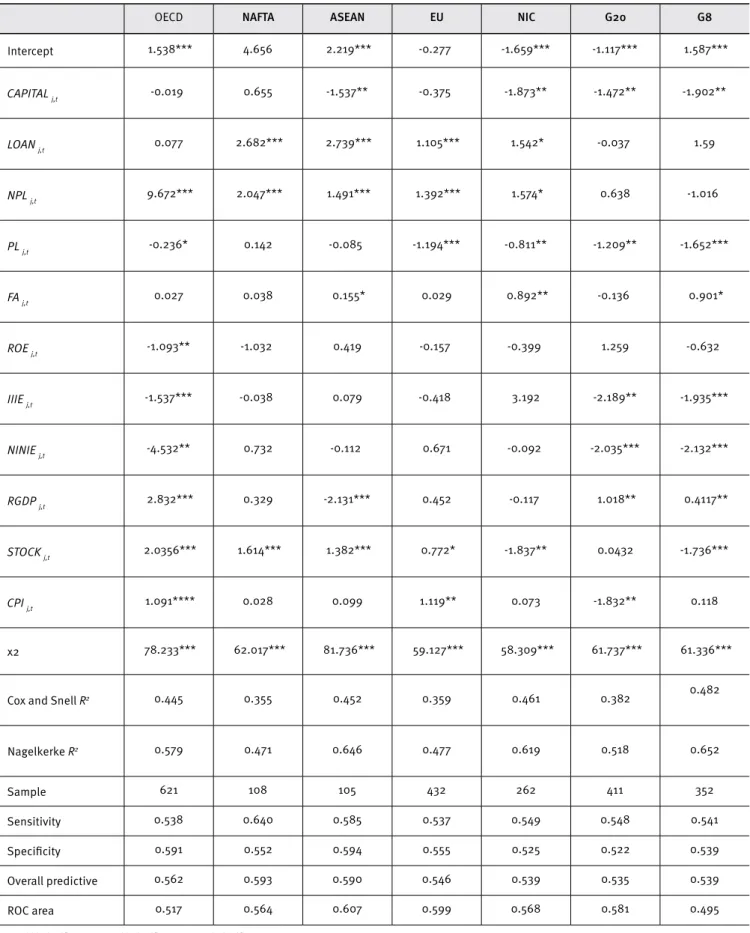
Table 3.
Relationships between inancial ratios and bank failure (two years before a failure)
OECD NAFTA ASEAN EU NIC G20 G8
Intercept 1.538*** 4.656 2.219*** -0.277 -1.659*** -1.117*** 1.587***
CAPITAL j,t -0.019 0.655 -1.537** -0.375 -1.873** -1.472** -1.902**
LOAN j,t 0.077 2.682*** 2.739*** 1.105*** 1.542* -0.037 1.59
NPL j,t 9.672*** 2.047*** 1.491*** 1.392*** 1.574* 0.638 -1.016
PL j,t -0.236* 0.142 -0.085 -1.194*** -0.811** -1.209** -1.652***
FA j,t 0.027 0.038 0.155* 0.029 0.892** -0.136 0.901*
ROE j,t -1.093** -1.032 0.419 -0.157 -0.399 1.259 -0.632
IIIE j,t -1.537*** -0.038 0.079 -0.418 3.192 -2.189** -1.935***
NINIE j,t -4.532** 0.732 -0.112 0.671 -0.092 -2.035*** -2.132***
RGDP j,t 2.832*** 0.329 -2.131*** 0.452 -0.117 1.018** 0.4117**
STOCK j,t 2.0356*** 1.614*** 1.382*** 0.772* -1.837** 0.0432 -1.736***
CPI j,t 1.091**** 0.028 0.099 1.119** 0.073 -1.832** 0.118
χ2 78.233*** 62.017*** 81.736*** 59.127*** 58.309*** 61.737*** 61.336***
Cox and Snell R2 0.445 0.355 0.452 0.359 0.461 0.382 0.482
Nagelkerke R2 0.579 0.471 0.646 0.477 0.619 0.518 0.652
Sample 621 108 105 432 262 411 352
Sensitivity 0.538 0.640 0.585 0.537 0.549 0.548 0.541
Speciicity 0.591 0.552 0.594 0.555 0.525 0.522 0.539
Overall predictive 0.562 0.593 0.590 0.546 0.539 0.535 0.539
ROC area 0.517 0.564 0.607 0.599 0.568 0.581 0.495
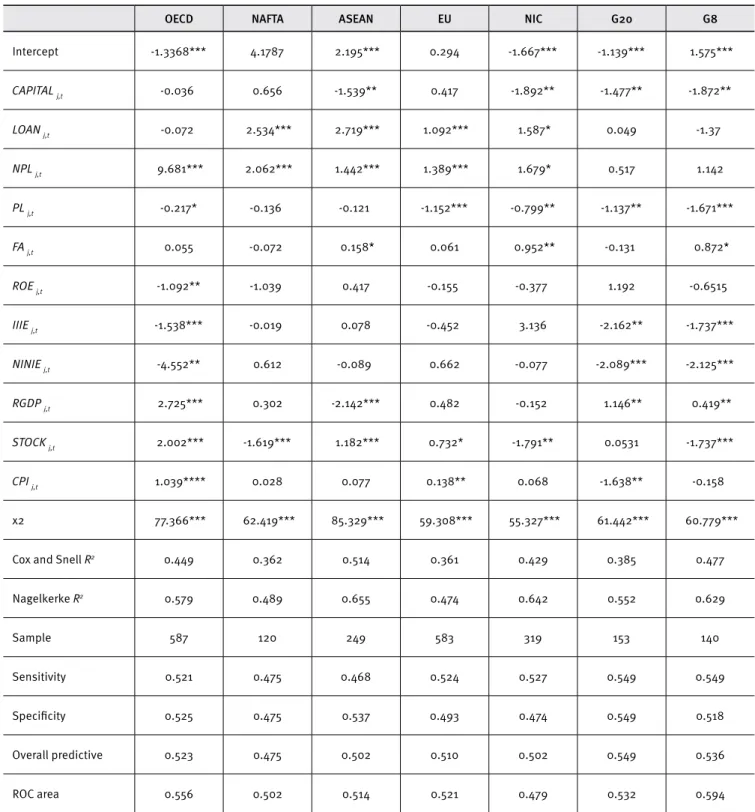
Table 4.
Relationships between inancial ratios and bank failure (three years before a failure)
OECD NAFTA ASEAN EU NIC G20 G8
Intercept -1.3368*** 4.1787 2.195*** 0.294 -1.667*** -1.139*** 1.575***
CAPITAL j,t -0.036 0.656 -1.539** 0.417 -1.892** -1.477** -1.872**
LOAN j,t -0.072 2.534*** 2.719*** 1.092*** 1.587* 0.049 -1.37
NPL j,t 9.681*** 2.062*** 1.442*** 1.389*** 1.679* 0.517 1.142
PL j,t -0.217* -0.136 -0.121 -1.152*** -0.799** -1.137** -1.671***
FA j,t 0.055 -0.072 0.158* 0.061 0.952** -0.131 0.872*
ROE j,t -1.092** -1.039 0.417 -0.155 -0.377 1.192 -0.6515
IIIE j,t -1.538*** -0.019 0.078 -0.452 3.136 -2.162** -1.737***
NINIE j,t -4.552** 0.612 -0.089 0.662 -0.077 -2.089*** -2.125***
RGDP j,t 2.725*** 0.302 -2.142*** 0.482 -0.152 1.146** 0.419**
STOCK j,t 2.002*** -1.619*** 1.182*** 0.732* -1.791** 0.0531 -1.737***
CPI j,t 1.039**** 0.028 0.077 0.138** 0.068 -1.638** -0.158
χ2 77.366*** 62.419*** 85.329*** 59.308*** 55.327*** 61.442*** 60.779***
Cox and Snell R2 0.449 0.362 0.514 0.361 0.429 0.385 0.477
Nagelkerke R2 0.579 0.489 0.655 0.474 0.642 0.552 0.629
Sample 587 120 249 583 319 153 140
Sensitivity 0.521 0.475 0.468 0.524 0.527 0.549 0.549
Speciicity 0.525 0.475 0.537 0.493 0.474 0.549 0.518
Overall predictive 0.523 0.475 0.502 0.510 0.502 0.549 0.536
ROC area 0.556 0.502 0.514 0.521 0.479 0.532 0.594
Note: *** signiicant at 1%, ** signiicant at 5%, * signiicant at 10%.
can be included in banks’ expected lending risks and can serve as a measure for risk management to reduce the possibility of banks distress.
Fixed assets had a signiicantly positive correlation with bank distress in the ASEAN, NIC, and G8. These results did not support those of Boyacioglu et al. (2009), suggesting that long liabilities are limited by ixed assets and thus detrimental for capital movement, resulting in bank distress. Return on equity had a signiicantly negative correlation to bank distress in the OECD, and these results were consistent with those of Boyacio-glu et al. (2009). Interest income to interest expense ratios and non-interest income to non-interest expense ratios were signii-cantly and negatively correlated to bank distress in the OECD, G20, and G8, and these results were consistent with those of
Yildiz and Akkoc (2010). Results show that bank distress does not occur when banks focus on primary operating items or non-pri-mary operating items.
With regard to macroeconomic factors, the changes in real gross domestic product, the stock index volatility, and consumer product index all had diferent relationships in the seven regional banking sectors. For example, changes in real gross domestic product showed a signiicant positive correlation with bank dis-tress in the OECD, G20, and G8, changes in real gross domestic product showed a signiicant negative correlation with bank dis-tress in the ASEAN and a non-signiicant relationship with bank distress in the NAFTA, EU, and NIC.
Conversely, the stock index volatility had a signiicant pos-itive correlation to bank distress in the OECD, NAFTA, ASEAN, and EU, a signiicant negative correlation to bank distress in the NIC and G8, and a non-signiicant relationship with bank distress in the G20.
In addition, the consumer product index was both signii-cantly and positively related to bank distress in the OECD and EU, signiicantly and negatively correlated to bank distress in the G20, and had a non-signiicant relationship with bank distress in the NAFTA, ASEAN, NIC, and G8. These results demonstrated the diferences in cultures, laws and regulations, and economic sys-tems under which various groups and diferent countries operate. The optimal results of the logistic model’s explicit equation regarding bank distress in regional groups can be expressed using the following inancial variables. OECD bank variables are ranked by non-performing loan to loan ratios, provisions for loan losses to loan ratios, ROE, interest income to interest expense ratios, and inally non-interest income to non-interest expense ratios. NAFTA bank variables are ranked by loan to asset ratios and non-perform-ing loan to loan ratios. ASEAN bank variables are ranked by Tier 1 (core) capital to average asset ratios, loan to asset ratios, non-per-forming loan to loan ratios, and inally, ixed asset to long liability
ratios. EU bank variables are ranked by loan to asset ratios, non-per-forming loan to loan ratios, and inally, provisions for loan losses to loan ratios. NIC bank variables are ranked using the Tier 1 (core) ratios of capital to average assets, loans to assets, nonperform-ing loans to loans, provisions for loan losses to loans, and ixed assets to long-term liabilities. G20 bank variables are ranked using Tier 1 (core) ratios of capital to average assets, provisions for loan losses to loans, interest income to interest expense, and noninter-est income to noninternoninter-est expense, whereas G8 bank variables are ranked by Tier 1 (core) capital to average asset ratios, provisions for loan losses to loan ratios, ixed asset to long liability ratios, interest income to interest expense ratios, and inally, non-inter-est income to non-internon-inter-est expense ratios. In addition, the variance inlation factors of variables in our logistic model indicate that the related variables were not collinear.
According to Cox & Snell R2 and Nagelkerke R2 , banks from
the NIC countries have a higher ability to explain the bank fail-ure model proposed in this study, whereas NAFTA banks have a lower ability to explain the model (one year before a failure); G8 banks have a higher ability to explain the bank failure model pro-posed in this study, whereas NAFTA banks have a lower ability to explain the model (two years before a failure); ASEAN banks have a higher ability to explain the bank failure model proposed in this study, whereas EU banks have a lower ability to explain the model (three years before a failure).
for the G20 at 54.9%. The ROC curve area was over 50% (exclud-ing NIC). Furthermore, based on regional groups and regard(exclud-ing the logistic model’s accuracy, G20 banks performed better (the logistic model’s accuracy was 54.9%) than other groups. By con-trast, NAFTA banks performed worse (the logistic model’s accuracy was 47.5%) compared to the other groups.
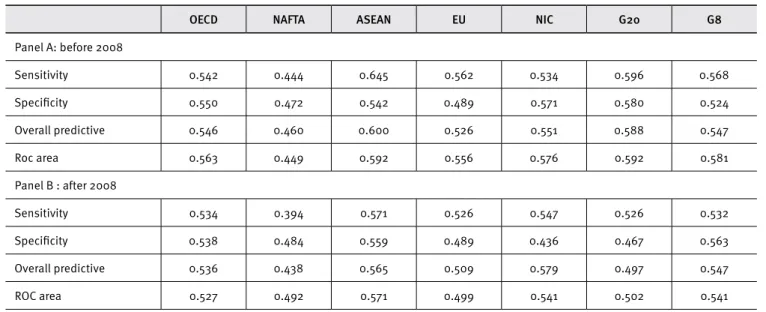
Because the inancial crisis of 2008 might have restruc-tured the global inancial market, we also separated pre- from post-2008 data to obtain the logistic model’s accuracy. The com-parisons of predicted and actual bankruptcy classiications are shown in Tables 5 to 7. As indicated in Table 5, panel A (one year before a failure), ASEAN banks had the highest value (the
logis-tic model’s accuracy was 60%), and NAFTA banks possessed the lowest value (the logistic model’s accuracy was 46%). Moreover, after 2008 (panel B), NIC banks had the highest value (the logis-tic model’s accuracy was 57.9%), and NAFTA banks showed the lowest value (the logistic model’s accuracy was 43.8%).
As indicated in Table 6, panel A (two years before a failure), NAFTA banks had the highest value (the logistic model’s accuracy was 54.00%), and EU banks possessed the lowest value (the logis-tic model’s accuracy was 46.9%). Moreover, after 2008 (panel B), NAFTA banks had the highest value (the logistic model’s accu-racy was 58.6%), and ASEAN banks presented the lowest value (the logistic model’s accuracy was 40.5%).
Table 5.
Robustness test: before and after 2008 (one year before a failure)
OECD NAFTA ASEAN EU NIC G20 G8
Panel A: before 2008
Sensitivity 0.542 0.444 0.645 0.562 0.534 0.596 0.568
Speciicity 0.550 0.472 0.542 0.489 0.571 0.580 0.524
Overall predictive 0.546 0.460 0.600 0.526 0.551 0.588 0.547
Roc area 0.563 0.449 0.592 0.556 0.576 0.592 0.581
Panel B : after 2008
Sensitivity 0.534 0.394 0.571 0.526 0.547 0.526 0.532
Speciicity 0.538 0.484 0.559 0.489 0.436 0.467 0.563
Overall predictive 0.536 0.438 0.565 0.509 0.579 0.497 0.547
ROC area 0.527 0.492 0.571 0.499 0.541 0.502 0.541
Table 6.
Robustness test: before and after 2008 (two years before a failure)
OECD NAFTA ASEAN EU NIC G20 G8
Panel A: before 2008
Sensitivity 0.491 0.520 0.514 0.478 0.548 0.472 0.552
Speciicity 0.535 0.560 0.464 0.458 0.524 0.504 0.505
Overall predictive 0.512 0.540 0.492 0.469 0.536 0.488 0.529
ROC area 0.495 0.584 0.506 0.512 0.509 0.492 0.554
Panel B : after 2008
Sensitivity 0.520 0.576 0.333 0.549 0.578 0.476 0.487
Speciicity 0.503 0.600 0.476 0.459 0.507 0.493 0.514
Overall predictive 0.512 0.586 0.405 0.506 0.540 0.484 0.500
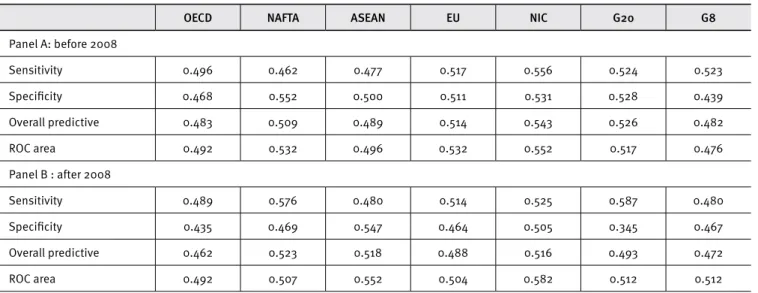
Compared to Table 5 and Table 6, as indicated in Table 7, Panel A (three years before a failure), NIC banks had the highest value (the logistic model’s accuracy was 54.3%), and G8 banks presented the lowest value (the logistic model’s accuracy was 48.2%). Moreover, after 2008 (Panel B), NAFTA banks had the highest value (the logistic model’s accuracy was 52.3%), and OECD banks pre-sented the lowest value (the logistic model’s accuracy was 46.2%).
Table 7.
Robustness test: before and after 2008 (three years before a failure)
OECD NAFTA ASEAN EU NIC G20 G8
Panel A: before 2008
Sensitivity 0.496 0.462 0.477 0.517 0.556 0.524 0.523
Speciicity 0.468 0.552 0.500 0.511 0.531 0.528 0.439
Overall predictive 0.483 0.509 0.489 0.514 0.543 0.526 0.482
ROC area 0.492 0.532 0.496 0.532 0.552 0.517 0.476
Panel B : after 2008
Sensitivity 0.489 0.576 0.480 0.514 0.525 0.587 0.480
Speciicity 0.435 0.469 0.547 0.464 0.505 0.345 0.467
Overall predictive 0.462 0.523 0.518 0.488 0.516 0.493 0.472
ROC area 0.492 0.507 0.552 0.504 0.582 0.512 0.512
Finally, we have also tested the predictive ability of our model out-of-sample. We repeated the same out-of-sample anal-yses to tackle any sample-speciic issues and get general robust results. The accuracy of the logistic model for NAFTA banks also provides the best prediction accuracy regarding bank failure (one year before a failure). ASEAN banks also had the highest value (one year before a failure, before 2008) or NAFTA banks had the highest value (two years before a failure, after 2008). Overall, the analysis of the prediction model shows all measures of predictive ability, with diferences between groups of banks – the Organi-zation for Economic Co-operation and Development (OECD), the North America Free Trade Area (NAFTA), the Association of South-east Asian Nations (ASEAN), the European Union (EU), the Newly industrialized countries (NIC), the G20, and the G8.
CONCLUSION
This study comprised 772 banks and used data from 2002 to 2012 to analyze the factors that inluence inancial early warn-ing systems. The results suggested that nonperformwarn-ing loans have a signiicantly positive correlation with bank distress in the OECD, whereas provisions for loan losses, return of equity, interest income to interest expenses, and non-interest income to non-interest expenses have a signiicantly negative correla-tion. The loan ratio and non-performing loans have a signiicantly positive correlation with bank distress in the NAFTA. Capital ratio
has a signiicantly negative correlation with bank distress in the ASEAN, whereas the loan ratio, non-performing loans, and ixed assets have a signiicantly positive correlation. The loan ratio and non-performing loans have a signiicantly positive correlation with bank distress in the EU, whereas provisions for loan losses have a signiicantly negative correlation. Capital ratio and pro-visions for loan losses have a signiicantly negative correlation with bank distress in the NIC, whereas loan ratio, non-performing loans, and ixed assets have a signiicantly positive correlation. Capital ratio, provisions for loan losses, interest income to interest expenses, and non-interest income to non-interest expenses have a signiicantly negative correlation with bank distress in the G20. Capital ratio, provisions for loan losses, interest income to inter-est expenses, and non-interinter-est income to non-interinter-est expenses have a signiicantly negative correlation with bank distress in the G8, whereas ixed assets have a signiicantly positive correlation. In addition, the logistic model’s accuracy is higher for NAFTA banks than for other regions (1 year before a failure vs. 2 years before a failure), and the accuracy is higher for G20 banks than for other regions (3 years before a failure). Thus, the empir-ical results show that the OECD, NAFTA, ASEAN, EU, NICs, G20, and G8 have diferent bank-sector environments.
in the development of contemporary economies and in protecting depositors’ funds. The major beneits of predicting bank failure may be that governments can optimize regulations regarding the assessment of bank risks and reduce potential international inancial distress.
In sum, we developed cross-country models in the bank-ing industry for forecastbank-ing bank failure. The outcomes showed accuracy and good goodness-of-it. The models and results can serve as a reference to regulators and policy makers regarding both sensitivity and goodness-of-it. In addition, we adopted a cut-of of under 0.5 points to classify bankrupt banks; however, this value was subjective, and an optimal cut-of should be deter-mined through future study.
REFERENCES
Adeyeye, P. O., Fajembola, O. D., Olopete, M. O., & Adedeji, D. B. (2012). Predicting bank failure in Nigeria using principal component analysis and D-Score Model. Research Journal of Finance and Accounting, 3(8), 159–170.
Al-Saleh, M. A., & Al-Kandari, A. M. (2012). Prediction of inancial distress for commercial banks in Kuwait. World Review of Business Research, 2(6), 26–45.
Altman, E. I. (1968). Financial ratios: Discriminant analysis and the prediction of corporate bankruptcy. Journal of Finance, 23(4), 589– 609. doi: 10.1111/j.1540-6261.1968.tb00843.x
Boyacioglu, M. A., Kara, Y., & Baykan, O. K. (2009). Predicting bank inancial failures using neural networks, support vector machines and multivariate statistical methods: A comparative analysis in the sample of savings deposit insurance fund (SDIF) transferred banks in Turkey. Expert System with Applications, 36(2), 3355–3366. doi:10.1016/j.eswa.2008.01.003
Canbas, S., Cabuk, A., & Kilic, S. B. (2005). Prediction of commercial bank failure via multivariate statistical analysis of inancial structure: The Turkish case. European Journal of Operational Research, 166(2), 528–546. doi:10.1016/j.ejor.2004.03.023
Demyanyk, Y., & Hasan, I. (2009). Financial crises and bank failures: A review of prediction methods. Omega, 38(5), 315–324. doi:10.1016/j. omega.2009.09.007
Divsalar, M., Javid, M. R., Gandomi, A. H., Sooi, J. B., & Mahmood, M. V. (2011). Hybrid genetic programming-based search algorithms for enterprise bankruptcy prediction. Applied Artificial Intelligence: An International Journal, 25(8), 669–692. doi:10.1080/08839514.2011.595975
Erdogan, B. E. (2008). Bankruptcy prediction of Turkish commercial banks using inancial ratios. Applied Mathematical Sciences, 60(2), 2973–2982.
Huang, D. T., Chang, B., & Liu, Z. C. (2012). Bank failure prediction models: For the developing and developed countries. Quality and Quantity, 46(2), 553–558. doi:10.1007/s11135-010-9386-9
Hutchison, M., & McDill, K. (1999). Are all banking crises alike? The Japanese experience in international comparison. Journal of the Japanese and International Economies, 13(3), 155–180. doi:10.1006/ jjie.1999.0427
Lanine, G., & Vennet, R. V. (2006). Failure predictions in the Russian bank sector with logit and trait recognition models. Expert Systems with Applications, 30(3), 463–478. doi:10.1016/j.eswa.2005.10.014 Männasoo, K., & Mayes, D. G. (2009). Explaining bank distress in
Eastern European transition economies. Journal of Banking and Finance, 33(2), 244–253. doi:10.1016/j.jbankin.2008.07.016 Martin, A., Gayathri, V., Saranya, G., Gayathri, P., & Venkatesan, P. (2011).
A hybrid model for bankruptcy prediction using genetic algorithm, fuzzy c-means and mars. International Journal on Soft Computing, 2(1), 12–24.
Meyer, P. A., & Pifer, H. W. (1970). Prediction of bank failures. Journal of Finance, 25(4), 853–868. doi: 10.1111/j.1540-6261.1970.tb00558.x
Min, S. H., Lee, J., & Han, I. (2006). Hybrid genetic algorithms and support vector machines for bankruptcy prediction. Expert Systems with Applications, 31(3), 652–660. doi:10.1016/j.eswa.2005.09.070 Ravi, V., & Pramodh, C. (2008). Threshold accepting trained principal
component neural network and feature subset selection: Application to bankruptcy prediction in banks. Applied Soft Computing, 8(4), 1539–1548.
Ravisankar, P., & Rav, V. (2010). Financial distress prediction in banks using group method of data handling neural network, counter propagation neural network and fuzzy ARTMAP. Knowledge-Based Systems, 23(8), 823–831.
Samad, A. (2011). Is capital inadequacy a factor for bank failure? Evidence from US Banking. Journal of Accounting & Finance, 11(4), 105–110.
Serrano-Cinca, C., & Gutiérrez-Nieto, B. (2013). Partial least square discriminant analysis for bankruptcy prediction. Decision Support Systems, 54(3), 1245–1255. doi:10.1016/j.dss.2012.11.015
Sinha, P., Taneja, V. S., & Gothi, V. (2009). Evaluation of riskiness of Indian banks and probability of book value insolvency. International Research Journal of Finance and Economics, 38, 7–12.
Tung, W. L., Quek, C., & Cheng, P. (2004). GenSo-EWS: A novel neural-fuzzy based early warning system for predicting bank failures. Neural Networks, 17(4), 567–587. doi:10.1016/j.neunet.2003.11.006 Valahzaghard, M. K., & Bahrami, M. (2013). Prediction of default
probability in banking industry using CAMELS index: A case study of Iranian banks. Management Science Letters, 3(4), 1113–1118. doi:10.5267/j.msl.2013.03.016
Yildiz, B., & Akkoc, S. (2010). Bankruptcy prediction using neuro fuzzy: An application in Turkish banks. International Research Journal of Finance and Economics, 60, 114–126.
Zaghdoudi, T. (2013). Bank failure prediction with logistic regression.
International Journal of Economics and Financial Issues, 3(2), 537– 543.