www.nat-hazards-earth-syst-sci.net/15/315/2015/ doi:10.5194/nhess-15-315-2015
© Author(s) 2015. CC Attribution 3.0 License.
Geological and geophysical characterization of the southeastern side
of the High Agri Valley (southern Apennines, Italy)
A. Giocoli1,2, T. A. Stabile1, I. Adurno1,†, A. Perrone1, M. R. Gallipoli1, E. Gueguen1, E. Norelli1, and S. Piscitelli3
1CNR-IMAA, Tito, Potenza, Italy 2ENEA, Rome, Italy
3Eni Spa, San Donato Milanese, Milan, Italy †deceased
Correspondence to:A. Giocoli (alessandro.giocoli@enea.it)
Received: 9 July 2014 – Published in Nat. Hazards Earth Syst. Sci. Discuss.: 1 October 2014 Revised: – – Accepted: 14 January 2015 – Published: 20 February 2015
Abstract. In the frame of a national project funded by Eni S.p.A. and developed by three institutes of the National Research Council (the Institute of Methodologies for Envi-ronmental Analysis, the Institute of Research for Hydrogeo-logical Protection and the Institute for Electromagnetic Sens-ing of the Environment), a multidisciplinary approach based on the integration of satellite, aero-photogrammetric and in situ geophysical techniques was applied to investigate an area located in the Montemurro territory in the southeastern sector of the High Agri Valley (Basilicata Region, southern Italy).
This paper reports the results obtained by the joint anal-ysis of in situ geophysical surveys, aerial photos interpre-tation, morphotectonic investigation, geological field survey and borehole data. The joint analysis of different data al-lowed us (1) to show the shallow geological and structural setting, (2) to detect the geometry of the different litholog-ical units and their mechanlitholog-ical and dynamlitholog-ical properties, (3) to image a previously unmapped fault beneath suspected scarps/warps and (4) to characterize the geometry of an ac-tive landslide affecting the study area.
1 Introduction
The origin and development of landslides may be influenced by several geologic, biologic, climatic and topographic fac-tors such as rock strength, precipitation rate and intensity, hillslope gradient, vegetation type and density, bedrock frac-ture density, uplift rate, etc. The tectonic lineaments may rep-resent preferential plans along which landslides can be
trig-gered (Guzzetti et al., 1996; Martino et al., 2004). So, the definition of the litho-structural setting is one of the basic aspects in landslide hazard assessment.
The study of landslide areas requires a multidisciplinary approach based on the integration of different techniques, providing a significant number of information, that can help to overcome the intrinsic limitations and drawbacks of each technique. The best choice is represented by the combined application of satellite, airborne and ground-based tech-niques (Perrone et al., 2006; de Bari et al., 2011). The first two techniques allow obtaining a synoptic view of the inves-tigated area providing information from a small to a medium spatial scale. They can provide indication on superficial char-acteristics of the investigated area like the presence of geo-logical structures and geomorphogeo-logical features, land use, vegetation cover, etc. (Simoniello et al., 2008; Roering et al., 2009; Strozzi et al., 2010). Ground-based techniques give di-rect and indidi-rect information on the subsurface characteris-tics in a specific point of the area (Petley et al., 2005; Marcato et al., 2012).
the geometry and the mechanical properties of the superficial litho-stratigraphic units (Mucciarelli et al., 2011; Albarello et al., 2011; Gallipoli et al., 2013), to delineate landslide body (Gallipoli et al., 2000; Perrone et al., 2004; Mainsant et al., 2012) and to study coseismic liquefaction phenomena (Gio-coli et al., 2014).
In the frame of the project “Development and integra-tion of innovative techniques of Earth Observaintegra-tion for land-slides monitoring in a test site of the Agri Valley”, funded by Eni S.p.A., a multidisciplinary approach based on the joint application of satellite and ground-based Differential Inter-ferometric Synthetic Aperture Radar (DInSAR) technique, aero-photogrammetric analysis and in situ geophysical mea-surements was employed to study an area located in the Mon-temurro territory in the southeastern sector of the High Agri Valley (Basilicata Region, southern Italy). This area repre-sents a high seismogenic and hydrogeological hazard area, as testified by theM7, 1857 Basilicata earthquake that pro-duced a big landslide and 5000 causalities (Almagià, 1910).
This paper reports the results obtained by the joint analy-sis of in situ geophysical surveys, aerial photo interpretation, morphotectonic investigation, geological field survey and borehole data. The joint analysis of different data allowed us to (1) show the shallow geological and structural setting, (2) detect the geometry of the different lithological units and their mechanical and dynamical properties, (3) image a pre-viously unmapped fault beneath suspected scarps/warps and (4) characterize the geometry of an active landslide that is still causing damage to structures and infrastructure.
2 Geological setting
The High Agri Valley (HAV) is a Quaternary NW–SE trend-ing intermontane basin located in the axial zone of the South-ern Apennines thrust belt (southSouth-ern Italy) (Fig. 1). Brittle tectonics has strongly controlled the formation and evolu-tion of the HAV up to the present. The deformaevolu-tion is tes-tified by seismic activity and by loose slope deposits and pa-leosols involved in faulting in the last 40 ka (Giano et al., 2000; D’Addezio et al., 2006). The HAV was hit by the
M7, 1857 Basilicata earthquake. A seismogenic structure capable of producing large events is alternatively associated with: (1) the Monti della Maddalena Fault System (MMFS) (Pantosti and Valensise, 1988; Maschio et al., 2005; Improta et al., 2010) and (2) the Eastern Agri Fault System (EAFS) (Benedetti et al., 1998; Cello et al., 2003; Giano et al., 2000). The MMFS bounds the HAV to the SW and runs for about 25 km between Pergola and Moliterno villages, whereas the EAFS, which is associated with mature fault-line scarps, bounds the HAV to the NE. No detailed definition exists on the length of the EAFS that, based on mapped faults between Pergola and Viggiano villages, is about 25 km (Cello et al., 2003; Maschio et al., 2005).
Figure 1.Schematic geological map of the High Agri Valley.
The study area falls in the southeastern part of the HAV, in the territory of Montemurro (Fig. 2). The pre-Quaternary substratum of this area consists of Tertiary siliciclastic sedi-ments of the Gorgoglione Flysch (GF) that crop out mainly in the northern sector of Montemurro. Downslope, the Gor-goglione Flysch is covered by Quaternary continental de-posits (QD) related to both Vallone dell’Aspro and Torrente Casale Alloformations (Zembo et al., 2010).
The morphology of the Montemurro territory is the result of different concomitant factors, such as the Quaternary re-gional uplift and the consequent fluvial erosion. Land mod-elling is also controlled by lithology and the structural set-ting. General features of the area are the occurrence of steep slopes, encased streams within narrow and deep land inci-sions and abrupt acclivity change, which could correspond to tectonic structures or lithological variations.
The Montemurro territory is affected by extensive hydro-geological instability phenomena. Active and quiescent land-slides involve both the QD and the GF. In particular, our anal-ysis shows an active landslide, which is still causing damage to residences, anthropic buildings and, especially, to the main road (SP11) leading to the urban area of Montemurro. The identified active landslide was termed Verdesca landslide. It is approximately 750 m long, 320 m wide and extends be-tween 675 and 590 m a.s.l. and has a mean inclination of about 7◦(Fig. 2).
Figure 2.Simplified geological map of the study area showing the distribution of the NW–SE scarps observed in the field, the Verdesca landslide, the location of the surveys and the three simplified bore-hole logs.
3 Geophysical surveys
Geophysical methods provide an efficient tool for imaging the subsurface. The suitability of a particular geophysical technique or a combination of them manly depends on the physical property contrast between the target and the host material, depth extent of the target, and the nature and thick-ness of the overburden. Generally speaking, the investiga-tions of as many properties as possible by various geophys-ical methods enable a double-check of results and enhance the reliability of interpretation. In this paper, we focused our attention on two complementary techniques, the elec-trical resistivity tomography (ERT) and the horizontal-to-vertical spectral ratio (HVSR) by earthquakes and ambient noise measurements. These two techniques are among the most non-invasive, fastest and cheapest geophysical meth-ods. All the surveys were carried out in an area located in the Montemurro territory between April 2010 and May 2012 (Fig. 2) and were aimed at: (1) imaging the structural and sedimentary setting, (2) verifying the nature of the NW–SE scarps in order to interpret them either as a tectonic landform (i.e. fault scarp) or as a geomorphic feature (i.e. erosional scarp) and (3) characterizing the Verdesca landslide (e.g. ge-ometry, thickness).
The ERT and HVSR results were supported by interpreta-tion of aerial photos, morphotectonic investigainterpreta-tion, geologi-cal field survey and were compared with the stratigraphigeologi-cal
data obtained by three geognostic wells reported in Fig. 2 as GB1 (20 m deep), GB2 (48 m deep) and GB3 (66 m deep) (Fig. 2).
3.1 Electrical resistivity tomography
Three NE-SW ERT were carried out across the NW–SE scarps observed in the Montemurro territory (S1–S3 in Fig. 2). Only the ERT2 profile runs across the Verdesca land-slide.
To acquire resistivity data, a resistivimeter Syscal R2 (Iris Instruments) connected to a multielectrode system with 48 electrodes, arranged according to the Wenner–Schlumberger array and spaced 20 m, was used. The ERT1 and ERT3 were performed along 940 m long profiles and have reached an in-vestigation depth of about 150 m. ERT2 was realized along a 1100 m long profile using roll-along technique and reaching the same investigation depth.
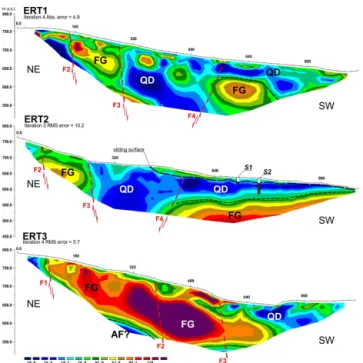
Apparent resistivity data were inverted using the RES2DINV software (Loke, 2001). Each resistivity model was chosen at the interaction after which the root mean square (rms) did not change significantly. This occurred be-tween the third and fourth interactions. In all cases, the rms error was less than 11 % and the resistivity values range from 10 to more than 128m (Fig. 3).
Taking into account the data gathered through geologi-cal surveys, aerial photo interpretation and exploratory bore-holes, we were able to calibrate the resistivity models and to directly correlate resistivity values with lithostratigraphic characteristics. Thus, the higher resistivity values (> 35m) can be associated with the Gorgoglione Flysch (GF) and the lower resistivity values (< 30m) are related to the Quater-nary continental deposits (QD) or to the Albidona Forma-tion (AF).
From a structural viewpoint, the major features of the re-sistivity models are the sharp lateral variations of rere-sistivity F1, F2 and F3 (Fig. 3), which fit at the surface with the NW– SE scarps S1, S2 and S3 (Fig. 2), respectively. In addition, these scarps are aligned to the main trend of the EAFS and are perpendicular to the strike of the streams. Thus, we can speculate that the scarps are a surface expression of an addi-tional strand of the EAFS. The identified strand was termed Montemurro Fault (MF). The resistivity models (ERT1 and ERT2) also show a NE dipping splay (F4) of the MF with no geomorphic signature (e.g. scarp). F4 was inferred also by Stabile et al. (2014) based on the joint analysis of seismic-ity data, geological observations, fluid injection data, strati-graphic log of the Costa Molina 2 injection well, and ERT survey.
re-Figure 3. Resistivity models (see Fig. 2 for the location of ERT profiles).
sistivity values (25–70m) are associated with the body of the Verdesca landslide. The estimated thickness of the slide deposits, as derived from borehole data (GB1–GB3 in Fig. 2) and resistivity contrast observed in the ERT2, varies from less than 10 up to 30 m.
3.2 Earthquake and ambient noise horizontal-to-vertical spectra ratio
In the study area we carried out 35 ambient noise measure-ments, each one with duration of 12–16 min, with a digi-tal tri-directional tromometer, a high-resolution seismome-ter whose 24-bit dynamic is aimed at the very low ampli-tude range, starting from the Brownian motion of the sensor (Tromino©Micromed).
Moreover, in February 2011 we installed two ETNA ac-celerometers: one in the landslide body (accelerometric sta-tion C, Fig. 2) and the other one outside the landslide, on the sandstones of the Gorgoglione Flysch (GF, bedrock) (ac-celerometric station A, Fig. 2). Due to logistic problems, on October 2011 the accelerometer installed on the bedrock was moved from the site A to the site B (see Fig. 2). During all the period we recorded 44 local and regional earthquakes with local magnitude (Ml)ranging between 1.1 and 6.0 (regional
event).
Figure 2 shows the location of the seismic ambient noise measurement points, the accelerometric stations and the available down-hole survey.
Table 1 reports the list of earthquakes recorded by ac-celerometers with their principal seismological parameters.
Figure 4. Comparison between waveforms of the Ml=2.7 18 February 2011 Potenza earthquake recorded inside the landslide body (green curve, accelerometric station C) and on the bedrock (red curve, accelerometric station A).
In particular, the last column reports indication of stations that recorded the earthquakes acquired during February 2011 to March 2012. Figure 4 shows the waveforms of theMl=
2.7 Potenza earthquake of 18 February 2011 recorded inside the landslide body (green curve) and on the bedrock (red curve). It is possible to observe the clear site amplification inside the landslide body with respect to the site A (bedrock), with evident higher peak ground acceleration amplitudes and longer signal duration.
The earthquakes and ambient noise recordings have been analysed by the HVSR techniques (Lermo and Chavez-Garcia, 1993; Castro et al., 1996). The HVSR functions were calculated by averaging the HVSR obtained by dividing the signal into non-overlapping windows of 20 s. Each win-dow was detrended, tapered, padded, FF-Transformed and smoothed with triangular windows with a width equal 5 % of the central frequency. The average was used to combine E–W and N–S components in the single horizontal (H) spec-trum. Average single-component spectra were obtained from the same procedure. For each HVSR curve the relative±2σ
confidence interval is given. Some authors suggest that tran-sient can affect estimates of fundamental frequency of soils, but a simple variation of amplitude never caused this problem according to Parolai and Galiana-Merino (2006) and Muccia-relli (2007). The ambient noise recordings and HVSR anal-ysis have been estimated according SESAME (Chatelain et al., 2008) and Albarello et al. (2011) guidelines.
Table 1.List of earthquakes recorded from February 2011 to March 2012 by the accelerometric stations A, B, and C installed in Montemurro.
Data Origin time (yyyy-mm-dd) Lat (◦N) Long (◦E) Depth (km) Place Mag. Stations
2011-02-18 06.36.32 40.626 15.804 11.1 Potenza 2.7Ml A and C
2011-03-10 – – – – Local event – A and C
2011-03-11 – – – – Local event – A and C
2011-04-01 13.29.11 35.540 26.630 60.0 Crete (Greece) 6.0Mw A and C
2011-04-02 16.25.38 39.921 16.006 6.8 Pollino 2.7Ml A and C
2011-04-12 03.32.55 41.663 16.117 10.1 Gargano 3.9Ml A and C
2011-04-25 15.32.07 40.310 16.268 26.0 Lucanian Apennine 1.9Ml A and C
2011-07-07 – – – – Local event – A and C
2011-07-12 – – – – Local event – A and C
2011-08-05 15.43.54 40.479 15.612 8.6 Le Murge 3.1Ml A and C
2011-09-20 03.08.02 40.243 15.674 Diano Valley 2.4Ml A and C
2011-09-21 03.26.21 40.247 15.671 9.3 Diano Valley 2.3Ml A and C
2011-11-23 14.12.33 39.915 16.018 6.3 Pollino 3.6Ml B and C
2011-11-24 02.13.05 39.904 16.014 8.5 Pollino 2.8Ml B and C
2011-11-30 06.21.23 40.339 15.992 10.0 Viggiano 1.0Ml B and C
2011-11-30 – – – – Local event – B and C
2011-11-30 21.07.21 39.921 16.021 8.4 Pollino 2.5Ml B and C
2011-12-01 14.01.20 39.932 16.002 6.8 Pollino 3.3Ml B and C
2011-12-01 18.02.47 39.921 16.015 9.1 Pollino 2.5Ml B and C
2011-12-01 – – – – Local event – B and C
2011-12-02 09.31.10 39.917 16.011 8.9 Pollino 2.6Ml B and C
2011-12-02 19.38.44 39.920 16.005 9.2 Pollino 2.5Ml B and C
2011-12-02 21.25.38 39.914 16.013 8.8 Pollino 3.2Ml B and C
2011-12-03 06.16.24 39.939 16.015 8.0 Pollino 2.5Ml B and C
2011-12-04 – – – – Local event – B and C
2011-12-08 04.58.34 39.937 16.017 7.7 Pollino 2.5Ml B and C
2011-12-10 14.53.25 39.915 15.983 8.6 Pollino 2.6Ml B and C
2011-12-15 – – – – Local event – B and C
2011-12-17 23.20.15 39.373 16.175 5.5 Valle del Crati 3.4Ml B and C
2011-12-19 – – – – Local event – B and C
2011-12-20 10.38.07 40.474 15.792 10.2 Lucanian Apennine 1.9Ml B and C
2011-12-23 21.54.09 39.942 16.021 9.6 Pollino 2.3Ml B and C
2011-12-24 20.17.50 39.914 16.037 8.3 Pollino 3.3Ml B and C
2012-01-12 20.28.53 39.932 16.014 8.6 Pollino 2.5Ml B and C
2012-01-15 06.32.27 40.246 15.902 9.2 Agri Valley 2.4Ml B and C
2012-01-15 12.35.36 40.243 15.912 9.5 Agri Valley 1.7Ml B and C
2012-01-15 22.36.18 39.912 16.003 7.4 Pollino 2.6Ml B and C
2012-01-16 01.42.41 40.247 15.910 9.4 Agri Valley 1.5Ml B and C
2012-01-22 10.04.02 39.288 15.599 22.1 West Calabrian Coast 3.5Ml B and C
2012-01-24 07.42.56 40.321 15.983 9.8 Agri Valley 1.1Ml B and C
2012-01-25 – – – – Local event – B and C
2012-03-09 23.26.46 40.168 15.992 10.1 Agri Valley 1.9Ml B and C
2012-03-12 02.10.09 40.469 16.076 28.4 Lucanian Apennine 2.7Ml B and C 2012-03-17 04.54.51 40.537 15.892 23.0 Lucanian Apennine 2.2Ml B and C
In all the three cases considered, the ambient noise HVSRs (blue lines in Fig. 5) are in agreement with the earthquake HVSRs (pink lines in Fig. 5). The availability of accelero-metric recordings on a bedrock site (station A) allowed us to also perform standard spectral ratio (SSR) analyses be-tween waveforms recorded on the landslide body and those recorded at the same time on the reference site. The SSR
analysis confirms the resonance peak at about 1.8 Hz in the landslide body.
Figure 5. HVSR curves obtained from earthquake data (pink curves) and the ambient noise measurement (blue curves) for both horizontal components (HNS/V, left panels; HWE/V, right panels).
seismic data available in the area. The stratigraphic sequence is characterized by the Quaternary continental deposits (QD) (see also GB3 in Fig. 2) withSwave velocity (Vs) increasing
with depth from 380 m s−1 in the first 15 m to 600 m s−1at
depth > 15 m. At the bottom, theVsof the Gorgoglione
Fly-sch (GF) is more than 800 m s−1(seismic bedrock) (Fig. 6a). The inversion model provided a synthetic HVSR in good agreement with the experimental one (Fig. 6b). The resonant peak at about 1.8 Hz is related to the depth of the seismic impedance contrast between the GF and the overlying QD with 80 m thick (resonant layer).
Subsequently, we have extended the seismic ambient noise measurements along all the ERT profiles in order to improve the interpretation of the results by using the joint analysis. Figure 6 shows ambient noise average HVSRs superimposed along ERT2. The HVSRs 12 and 13 show a clear resonance peak at 2.2 Hz. This peak shifts to lower frequency (1.5 Hz) for the site 14 to the site 15 (central part of the profile); the northern HVSRs (sites 21 and 22) show flat curves because they lay on the outcropping seismic bedrock (Gorgoglione Flysch). Thus, the results summarized in Fig. 6 point out that the fundamental frequency is related to the depth variation of the seismic impedance contrast between the high-resistive GF and the overlying low-resistive QD.
Finally, it is possible to observe in Fig. 6 a little lower-ing of the average HVSR in correspondence of 1.7 Hz at sites 18–21. The disturbance is attributable to the presence of
Figure 6.Comparison between the ambient noise HVSRs and the ERT2. 12 to 22 indicate the HVSR curves from seismic noise measurements.(a)Value of Vs used to constrain the H/V curve.
(b)Comparison between the synthetic HVSR curve and the ambi-ent noise HVSR curve at the site 33.
in-service wind turbine towers (Saccorotti et al., 2011) near those sites, and it is principally evident on the HVSR ob-tained for the E–W component. Since such frequency is near the resonance peak, in these four sites we reconstructed the HVSR function by considering only the N–E component.
4 Discussions and conclusions
In the frame of the project “Development and integration of innovative techniques of Earth Observation for landslides monitoring in a test site of the Agri Valley” funded by Eni S.p.A. a multidisciplinary approach based on the inte-gration of satellite, aero-photogrammetric and in situ geo-physical techniques was applied to investigate an area lo-cated in the Montemurro territory in the southeastern sector of the HAV. In this paper we focused our attention on the results obtained by the joint application of two in situ geo-physical techniques, the ERT and the earthquake and ambient noise HVSR. The interpretation of results was supported by morphotectonic investigation, interpretation of aerial photos, geological field survey and borehole data. In particular, the joint application of these two in situ geophysical techniques allowed us to infer a good correspondence between the re-sistivity contrast and the seismic impedance interface. Both interfaces coincide with the boundary between the GF and the overlying QD characterized by different resistivity and mechanical behaviour.
Figure 7.3-D surface digital elevation model of the Montemurro area showing the faults and the location of ERT profiles and HVSR.
(Fig. 7) and (4) verify the nature of the NW–SE scarps and to interpret them as the surface expression of the MF.
The HVSR technique does not show resonance peaks re-lated to the depth of the sliding surface of the Verdesca land-slide due to a negligible impedance contrast between the QD and the material of the Verdesca landslide. Thus, only ERT and exploratory boreholes were integrated to: (1) character-ize the geometry of the Verdesca landslide, (2) locate the slid-ing surface and (3) estimate the thickness of the landslide body.
We think that the results presented in this study provide new basic data for hydrogeological and seismic hazard as-sessment of the HAV. In particular, the HAV is one of the areas of Italy with the highest seismogenic potential. In ad-dition, the seismic risk is amplified by the presence of two important human activities, namely the exploitation of the largest productive on-shore oil field in West Europe, man-aged by the Eni company, and the artificial Pertusillo wa-ter reservoir (Stabile et al., 2014a, b). The recognition of the Montemurro Fault, which increases longitudinal extent of the EAFS previously mapped by Cello et al. (2003) and Maschio et al. (2005), may indeed have significant implications for the local seismic hazard. However, our data do not show whether the EAFS is the seismogenic structure of the High Agri Val-ley, which remains undefined.
Acknowledgements. This research activity was funded by Eni S.p.A.
Edited by: V. Lapenna
Reviewed by: P. Soupios, G. P. Prosser, and one anonymous referee
References
Albarello, D., Cesi, C., Eulilli, V., Guerrini, F., Lunedei, E., Paolucci, E., Pileggi, D., and Puzzilli, L. M.: The contribu-tion of the ambient vibracontribu-tion prospecting in seismic microzon-ing: an example from the area damaged by the 6th April 2009 l’Aquila (Italy) earthquake, B. Geofis. Teor. Appl., 52, 513–538, doi:10.4430/bgta0013, 2011.
Almagià, R.: Studi geografici sulle frane in Italia, Società Ge-ografica Italiana, 14, 44–47, 1910.
Benedetti, L., Tapponier, P., King, G. C. P., and Piccardi, L.: Surface rupture of the 1857 southern Italian earthquake, Terra Nova, 10, 206–210, 1998.
Boncio, P., Pizzi, A., Cavuoto, G., Mancini, M., Piacentini, T., Miccadei, E., Cavinato, G. P., Piscitelli, S., Giocoli, A., Fer-retti, G., De Ferrari, R., Gallipoli, M. R, Mucciarelli, M., Di Fiore, V., Naso, G., Giaccio, B., Moscatelli, M., Spadoni, M., Romano, G., Franceschini, A., Spallarossa, D., Pasta, M., Pavan, M., Scafidi, D., Barani, S., Eva, C., Pergalani, F., Compagnoni, M., Campea, T., Di Berardino, G. R., Mancini, T., Marino, A., Montefalcone, R., and Mosca, F.: Geological and geophysical characterization of the Paganica – San Gregorio area after the April 6, 2009 L’Aquila earthquake (Mw 6.3, central Italy): im-plications for site response, B. Geofis. Teor. Appl., 52, 491–512, doi:10.4430/bgta0014, 2011.
Castellaro, S. and Mulargia, F.: Vs30 estimates using constrained H/V measurements, Bull. Seism. Soc. Am., 99, 761–773, doi:10.1785/0120080179, 2009.
Castro, R. R., Mucciarelli, M., Pacor, F., and Petrungaro, C.: S-waves response estimates using Nakamura’s technique, B. Seis-mol. Soc. Am., 87, 256–260, 1996.
Cello, G., Tondi, E., Micarelli, L., and Mattioni, L.: Active tecton-ics and earthquake sources in the epicentral area of the 1857 Basilicata earthquake (southern Italy), J. Geodyn., 36, 37–50, doi:10.1016/S0264-3707(03)00037-1, 2003.
Chatelain, J. L., Guillier, B., Cara, F., Duval, A. M., Atakan, K., and Bard, P. Y.: Evaluation of the influence of experimental con-ditions on H/V results from ambient noise recordings, B. Earthq. Eng., 6, 33–74, doi:10.1007/s10518-007-9040-7, 2008. D’Addezio, G., Karner, D. B., Burrato, P., Insinga, D., Maschio, L.,
Ferranti, L., and Renne P. R.: Faulted Middle Pleistocene tephra layer in the Val d’Agri area (Southern Italy), Ann. Geophys.-Italy, 49, 1029–1040, 2006.
de Bari, C., Lapenna, V., Perrone, A., Puglisi, C., and Sdao, F.: Digital photogrammetric analysis and electrical resistiv-ity tomography for investigating the Picerno landslide (Basil-icata region, southern Italy), Geomorphology, 133, 34–46, doi:10.1016/j.geomorph.2011.06.013, 2011.
Galli, P. A. C., Giocoli, A., Peronace, E., Piscitelli, S., Quadrio, B., and Bellanova, J.: Integrated near surface geophysics across the active Mount Marzano Fault System (southern Italy): seismo-genic hints, Int. J. Earth Sci., 103, 315–325, doi:10.1007/s00531-013-0944-y, 2014.
Gallipoli, M. R., Lapenna, V., Lorenzo, P., Mucciarelli, M., Perrone, A., Piscitelli, S., and Sdao, F.: Comparison of geological and geophysical prospecting techniques in the study of a landslide in southern Italy, J. Environ. Eng. Geoph., 4, 117–128, 2000. Gallipoli, M. R., Giocoli, A., and Piscitelli, S.: Joint application
L’Aquila (Italy) earthquake, in: Proceedings of the 4th Interna-tional Conference on Site Characterization 4 – ISC-4, Pernam-buco, Brazil, 18–21 September 2012, 2, 1477–1484, 2013. Giano, S. I., Maschio, L., Alessio, M., Ferranti, L., Improta, S.,
and Schiattarella M.: Radiocarbon dating of active faulting in the Agri high valley, southern Italy, J. Geodyn., 29, 371–386, doi:10.1016/S0264-3707(99)00058-7, 2000.
Giocoli, A., Magrì, C., Piscitelli, S., Rizzo, E., Siniscalchi, A., Bur-rato, P., Vannoli, P., Basso, C., and Di Nocera, S.: Electrical Re-sistivity Tomography Investigations in the Ufita Valley (Southern Italy), Ann. Geophys.-Italy, 51, 213–223, 2008.
Giocoli, A., Galli, P., Giaccio, B., Lapenna, V., Messina, P., Per-onace, E., Piscitelli, S., and Romano, G.: Electrical Resistiv-ity Tomography across the Paganica-San Demetrio fault sys-tem (April 2009 L’Aquila earthquake,Mw6.3), B. Geofis. Teor.
Appl., 52, 457–469, doi:10.4430/bgta0029, 2011.
Giocoli, A., Quadrio, B., Bellanova, J., Lapenna, V., and Piscitelli, S.: Electrical resistivity tomography for studying liquefaction induced by the May 2012 Emilia-Romagna earthquake (Mw
= 6.1, northern Italy), Nat. Hazard Earth Sys., 14, 731–737, doi:10.5194/nhess-14-731-2014, 2014.
Guzzetti, F., Cardinali, M., and Reichenbach, P.: The influence of structural setting and lithology on landslide type and pattern, En-viron. Eng. Geosci., 2, 4, 531–555, 1996.
Improta, L., Ferranti, L., De Martini, P. M., Piscitelli, S., Bruno, P. P., Burrato, P., Civico, R., Giocoli, A., Iorio, M., D’addezio, G., and Maschio, L.: Detecting young, slow-slipping active faults by geologic and multidisciplinary high-resolution geophysical in-vestigations: A case study from the Apennine seismic belt, Italy, J. Geophys. Res., 115, B11307, doi:10.1029/2010JB000871, 2010.
Lermo, J. and Chavez Garcia, F. J.: Site effect evaluation using spec-tral ratios with only one station, B. Seismol. Soc. Am., 83, 1574– 1594, 1993.
Loke, M. H.: Tutorial: 2-D and 3-D electrical imaging surveys, available at: http://www.geoelectrical.com (last access: June 2013), 2001.
Mainsant, G., Larose, E., Brönnimann, C., Jongmans, D., Michoud, C., and Jaboyedoff, M.: Ambient seismic noise monitoring of a clay landslide: Toward failure prediction, J. Geophys. Res., 117, F01030, doi:10.1029/2011JF002159, 2012.
Marcato, G., Mantovani, M., Pasuto, A., Zabuski, L., and Borgatti, L.: Monitoring, numerical modelling and hazard mitigation of the Moscardo landslide (Eastern Italian Alps), Eng. Geol., 128, 95–107, doi:10.1016/j.enggeo.2011.09.014, 2012.
Martino, S., Moscatelli, M., and Scarascia Mugnozza, G.: Quater-nary mass movements controlled by a structurally complex set-ting in the Central Apennines (Italy), Eng. Geol., 72, 33–55, 2004.
Maschio, L., Ferranti, L., and Burrato, P.: Active extension in Val d’Agri area, Southern Apennines, Italy: implications for the ge-ometry of the seismogenic belt, Geophys. J. Int., 162, 591–609, doi:10.1111/j.1365-246x.2005.02597.x, 2005.
Moscatelli, M., Pagliaroli, A., Mancini, M., Stigliano, F., Cavuoto, G., Simionato, M., Peronace, E., Quadrio, B., Tommasi, P., Cav-inato, G. P., Di Fiore, V., Angelino, A., Lanzo, G., Piro, S., Za-muner, D., Di Luzio, E., Piscitelli, S., Giocoli, A., Perrone, A., Rizzo, E., Romano, G., Naso, G., Castenetto, S., Corazza, A., Marcucci, S., Cecchi, R., and Petrangeli, P.: Integrated subsoil
model for seismic microzonation in the Central Archaeological Area of Rome (Italy), Disaster Advances, 5, 109–124, 2012. Mucciarelli, M.: Jumpin’ Joy Quake, Seismol. Res. Lett., 77, 744–
745, doi:10.1785/gssrl.77.6.744, 2007.
Mucciarelli, M., Bianca, M., Ditommaso, R., Vona, M., Gallipoli, M. R., Giocoli, A., Piscitelli, S., Rizzo, E., and Picozzi, M.: Pe-culiar earthquake damage on a reinforced concrete building in San Gregorio (L’Aquila, Italy): site effects or building defects?, B. Earthq. Eng., 9, 825–840, doi:10.1007/s10518-011-9257-3, 2011.
Pantosti, D. and Valensise, G.:, La faglia sud-appenninica: identificazione oggettiva di un lineamento sismogenetico nell’Appennino meridionale, in: Proceedings of the 7th Meeting Gruppo Nazionale di Geofisica della Terra Solida, Rome, Italy, 205–220, 1988.
Parolai, S. and Galiana Merino, J. J.: Effect of Transient Seismic Noise on Estimates of H/V Spectral Ratios, B. Seismol. Soc. Am., 96, 228–236, doi:10.1785/0120050084, 2006.
Perrone, A., Iannuzzi, A., Lapenna, V., Lorenzo, P., Piscitelli, S., Rizzo, E., and Sdao, F.: High-resolution electrical imaging of the Varco d’Izzo earthflow (southern Italy), J. Appl. Geophys., 56, 17–29, doi:10.1016/j.jappgeo.2004.03.004, 2004.
Perrone, A., Zeni, G., Piscitelli, S., Pepe, A., Loperte, A., Lapenna, V., and Lanari, R.: Joint analysis of SAR inter-ferometry and Electrical Resistivity Tomography surveys for investigating ground deformation: the case-study of Satri-ano di Lucania (Potenza, Italy), Eng. Geol., 88, 260–273, doi:10.1016/j.enggeo.2006.09.016, 2006.
Perrone, A., Lapenna, V., and Piscitelli, S.: Electrical resistivity to-mography technique for landslide investigation: a review, Earth Sci., 135, 65–82, doi:10.1016/j.earscirev.2014.04.002, 2014. Petley, D. N., Mantovani, F., Bulmer, M. H., and Zannoni, A.:
The use of surface monitoring data for the interpretation of landslide movement patterns, Geomorphology, 66, 133–147, doi:10.1016/j.geomorph.2004.09.011, 2005.
Roering, J. J., Stimely, L. L., Mackey, B. H., and Schmidt, D. A.: Using DInSAR, airborne, LiDAR, and archival air photos to quantify landsliding and sediment transport, Geophys. Res. Lett., 36, L19402, doi:10.1029/2009GL040374, 2009.
Saccorotti, G., Piccinini, D., Cauchie, L., and Fiori, I.: Seismic Noise by Wind Farms: A Case Study from the Virgo Gravita-tional Wave Observatory, Italy, Bull. Seism., Soc. Am., 101, 568– 578, doi:10.1785/0120100203, 2011.
Simoniello, T., Lanfredi, M., Liberti, M., Coppola, R., and Mac-chiato, M.: Estimation of vegetation cover resilience from satellite time series, Hydrol. Earth Syst. Sc., 12, 1053–1064, doi:10.5194/hess-12-1053-2008, 2008.
Siniscalchi, A., Tripaldi, S., Neri, M., Giammanco, S., Piscitelli, S., Balasco, M., Behncke, B., Magrì, C., Naudet, V., and Rizzo, E.: Insights into fluid circulation across the Per-nicana Fault (Mt. Etna, Italy) and implications for flank instability, J. Volcanol. Geoth. Res., 193, 137–142, doi 10.1016/j.jvolgeores.2010.03.013, 2010.
Stabile, T. A., Giocoli, A., Perrone, A., Piscitelli, S., and Lapenna,V.: Fluid injection induced seismicity reveals a NE dipping fault in the southeastern sector of the High Agri Valley (southern Italy), Geophys. Res. Lett., 41, 5847–5854, doi:10.1002/2014GL060948, 2014b.
Strozzi, T., Delaloye, R., Kääb, A., Ambrosi, C., Perruchoud, E., and Wegmüller, U.: Combined observations of rock mass movements using satellite SAR interferometry, differ-ential GPS, airborne digital photogrammetry, and airborne photography interpretation, J. Geophys. Res., 115, F01014, doi:10.1029/2009JF001311, 2010.
Tropeano, M., Cilumbriello, A., Sabato, L., Gallicchio, S., Grippa, A., Longhitano, S. G., Bianca, M., Gallipoli, M. R., Muc-ciarelli, M., and Spilotro, G.: Surface and subsurface of the Metaponto Coastal Plain (Gulf of Taranto-southern Italy): Present-day- vs LGM-landscape, Geomorphology, 203, 115– 131, doi:10.1016/j.geomorph.2013.07.017, 2013.