Original Article
Non-uniformity of Clinical Head, Head and Neck, and Body Coils in Magnetic
Resonance Imaging (MRI)
Mahmood Nazarpoor1*
Abstract
Introduction
Signal intensity uniformity in a magnetic resonance (MR) image indicates how well the MR imaging (MRI) system represents an object. One of the major sources of image non-uniformity in high-field MRI scanners is inhomogeneity of radio-frequency coil. The aim of this study was to investigate non-uniformity in head, head and neck, and body coils and compare the obtained results to determine the best clinical coil for future clinical application.
Materials and Methods
A phantom was designed to investigate the non-uniformity of coils. All evaluations were carried out using a 1.5 T clinical MRI scanner. T1-weighted inversion recovery sequence (linear phase encoding) and turbo fast low angle shot (TurboFLASH) images were used to find non-uniformity in the clinical coils. For testing the uniformity of coils, signal intensity profiles in parts of the coronal image of phantom were measured over X and Y axes.
Results
The results showed that body coil was the most uniform coil of all; in addition, the head and neck coil was more uniform than the head coil. The results also indicated that signal-to-noise ratio (SNR) of the head and neck coil was higher than the head and body coils. Moreover, SNR of the head coil was higher than that of the body coil.
Conclusion
In order to accurately find or apply an image signal intensity for measuring organ blood flow or perfusion, coil non-uniformity corrections are required.
Keywords: Coil; MRI; Prospective Studies; Signal-To-Noise Ratio
1-Department of Radiology, Faculty of Paramedicine, Tabriz University of Medical Sciences, Tabriz, Iran *Corresponding author: Tel & Fax: +984133368733;
1. Introduction
Signal intensity (SI) uniformity in a magnetic resonance (MR) image indicates how well the MR imaging (MRI) system represents an object. Numerous sources can cause non-uniformity in MR intensity including receiver filter, incomplete gradient eddy current compensation, radio frequency (RF) standing-wave effects, non-uniform static field and gradient, size and shape of image planes, and patient’s anatomy and position.Non-uniformity changes pixel intensity of one object at different positions of the coil and hence modifies the contrast between normal tissues and lesions. It also interferes with image post-processing (e.g., tissue segmentation, functional MRI, volume quantification, and MR angiography) [1-4].
There are two common methods for correcting MRI intensity. The first method, called the prospective method, involves the generation of a correction matrix from images of a uniform flood phantom. The second (retrospective method) uses digital filtering to remove low-frequency components with non-uniformity [1, 5].
In addition, Hou described three main different models (low-frequency, hypersurface, and statistical models) and summarized other techniques to correct intensity inhomogeneity, based on different principles [6]. Goto et al. investigated non-parametric non-uniform intensity normalization in reduced system dependency, using an atlas-based method [7]. For correcting coil non-uniformity, we used a method similar to uniform flood phantom or prospective method, in consistence with previous studies [8-14].
The vials (25) in the phantom with constant concentration (1.20 mmol/L) were placed in exactly the same positions of the vials (25) with different concentrations (0 -19.77 mmol/L) for measurement of coil uniformity. The non-uniformity of the coil was calculated from the SI of the each vial with constant concentration, and it was normalized to give a correction factor. For calculating the corrected SI for different concentrations, the SI of each vial was multiplied by its correction. However,
attempting to explain these correction methods is beyond the scope of this study.
In summary, one of the major sources of image non-uniformity in high-field MRI scanners is RF coil inhomogeneity. Therefore, for measuring the precise image SI, the response of RF coils should be uniform. The aim of this study was to investigate non-uniformity in head, head and neck, and body coils and compare the obtained results to determine the best uniform coil for future application.
2. Materials and Methods
2.1. PhantomA phantom was designed to investigate the non-uniformity of different coils and assess the relationship between SI and constant concentration of vials, similar to previous studies [8-11, 13-15].
The shape of the phantom was approximately cubic and it was made of Perspex. Its length, width, and height were 20, 18, and 20 cm, respectively.
We investigated the use of adding 1% NaCl to the water inside the phantom to better simulate water in tissues [16]; however, no difference was found in image quality, compared to using tap water only. Therefore, NaCl was not added to the phantom during subsequent experiments, and the phantom was only filled with water.
For testing the uniformity of coils, SI profiles in parts of the coronal image of the phantom, which did not contain vials (with only normal water between the vials), were measured; ideally these should all give the same constant value were measured over X and Y axes. The profiles were obtained from the mean of 10 acquisitions to improve signal-to-noise ratio (SNR).
2.2. Image acquisition
fast low angle shot (TurboFLASH) images were used to evaluate the non-uniformity of the coils. In addition, magnetization preparation with a non-selective inversion pulse was performed.
TurboFLASH imaging parameters were as follows: matrix size= 64×64, interpolated to 128×128; time for one FLASH line= 8.5 ms; echo time [TE]= 4 ms; effective inversion time [TI] = 1400 ms; pixel size = 2×2 mm; slice thickness = 10 mm; and flip angle= 15º. Each imaging process was repeated 10 times by the MRI scanner with a slice thickness of 10 mm and a flip angle of 15º.
2.3. Image analysis
Data were transferred from the MRI scanner to a Unix workstation. An image processing software, called Interactive Data Language (IDL, Research Systems, Inc.), was used for data processing. [17]
Computer programs were written to automatically find: 1) the mean of 10 acquisitions to increase SNR; 2) the mean SI of ten pixels over X and Y axes; and 3) SI profiles at the region of interest across the X and Y axes for different coils. These programs could be run from either a Unix workstation or a personal computer.
3. Results
Uniformity was obtained at different coil positions across X and Y axes. SI was measured where there was just normal water between vials; ideally, these vials should all have the same constant value.
Figure 1 shows the top, middle, and bottom positions of head, head and neck, and body coils and demonstrates the profiles at these positions across the X-axis.
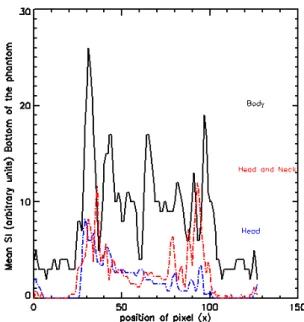
Mean SI profiles of ten pixels in the head, head and neck, and body coils on top of the phantom across the X-axis are shown in figure 2. SI was obtained where there was normal water between the vials. In addition, figures 3 and 4 show the mean SI profile of ten pixels across the X-axis in the bottom and middle of the phantom for three different coils.
Figure 1. The position of the top, middle, and bottom of the head coil across the X-axis in coronal T1-weighted imaging of the phantom; SI was obtained at these positions.
Figure 2. Uniformity of the head, head and neck, and body coils for top of the phantom across the X-axis; the mean SI was obtained from ten pixels across the X-axis.
Figure 3. Uniformity of the head, head and neck, and body coils for the bottom of the phantom across the X-axis; mean SI was obtained from ten pixels across the X-axis.
Figure 4. Uniformity of the head, head and neck, and body coils for the middle of the phantom, across the X-axis; mean SI was obtained from ten pixels across the X-axis.
In general, SNR is the ratio of the amplitude of the signal received to the average amplitude of the noise [10]. SNRs, obtained from 81 pixels in the middle of the phantom, were 80.27, 94.48, and 50.13 for the head, head and neck, and body coils, respectively.
Figure 5. The lines show the position of the head, head and neck, and body coils, where SI is plotted on the left, middle, and right of Y-axis from coronal T1-weighted imaging of the phantom.
Figure 7. Mean SI was obtained from ten pixels across the Y-axis for the middle of the head, head and neck, and body coils; the dip SI in the figure is related to different parts of the inside and outside phantom (from bottom to the top).
Figure 8. Mean SI was obtained from ten pixels across the Y-axis for the right of the head, head and neck, and body coils; the dip SI in the figure is related to different parts of the inside and outside phantom (from bottom to the top).
4. Discussion
Pixel intensity in MRI is a function of proton density, relaxation times, and sequence timing parameters. It is also a function of pixel position in the image due to the effects of coil non-uniformity [1-4]. It is impossible to
compare pixel intensity either qualitatively or quantitatively if the coil is not uniform.
Many studies have been performed using different techniques for the correction of SI in case of coil non-uniformity [5-8, 12-14]. However, to the best of our knowledge, no previous studies have shown which clinical coil has the highest uniformity for measuring SI (without any non-uniformity corrections). The aim of this study was to introduce the most uniform FR clinical coil for measuring SI, without any corrections.
The SI across X and Y axes of the three coils is presented in figures 2, 3, and 4.
The results show that head and head and neck coils are slightly uniform, compared to body coil, across the X axis at the top and bottom of the phantom (see figures 2 and 3). The dips SI in figures are due to different part of the inside and outside phantom (from left to the right). Figure 4 indicates that the head and body coils are more uniform than the head and neck coil across the X axis in the middle of the phantom. According to the results, the body coil is more uniform than the other two coils across the Y-axis on the left of the phantom (see figure 6). In addition, the results showed that the body coil is more uniform than the head and head and neck coils across the Y-axis in the middle and on the right of the phantom (see figures 7 and 8). The dips SI in the figures are due to different parts of the inside and outside phantom (from bottom to the top). The differences in SI profiles across X and Y axes between the three coils are due to the non-uniformity of the coils.
5. Conclusion
Acknowledgment
The authors gratefully acknowledges to Tabriz University of Medical Sciences for their valuable support for this study.
References
1. Mohamed FB, Vinitski S, Faro SH, Ortega HV, Enochs S. A simple method to improve image nonuniformity of brain MR images at the edges of a head coil. J Comput Assist Tomogr. 1999 Nov-Dec;23(6):1008-12. 2. Tofts PS, Barker GJ, Simmons A, MacManus DG, Thorpe J, Gass A, et al. Correction of nonuniformity in
images of the spine and optic nerve from fixed receive-only surface coils at 1.5 T. J Comput Assist Tomogr. 1994 Nov-Dec;18(6):997-1003.
3. Condon BR, Patterson J, Wyper D, Jenkins A, Hadley DM. Image non-uniformity in magnetic resonance imaging: its magnitude and methods for its correction. Br J Radiol. 1987 Jan;60(709):83-7.
4. Simmons A, Tofts P S, Barker G J, et al. Sources of intensity non uniformity in spin echo images at 1.5 T. Magn Reson Med 1994; 32:121–8
5. Likar B, Viergever MA, Pernus F. Retrospective correction of MR intensity inhomogeneity by information minimization. IEEE Trans Med Imaging. 2001 Dec;20(12):1398-410.
6. Hou Z. A Review on MR Image Intensity Inhomogeneity Correction. Int J Biomed Imaging. 2006;2006:49515. DOI 10.1155/IJBI/2006/49515
7. Goto M, Abe O, Miyati T, Kabasawa H, Takao H, Hayashi N, et al. Influence of signal intensity non-uniformity on brain volumetry using an atlas-based method. Korean J Radiol. 2012 Jul-Aug;13(4):391-402. 8. Nazarpoor M. The effect of repetition time on the maximum linear relationship between contrast agent
concentration and signal intensity on T1 weighted image using inversion recovery (IR) sequence. Iran J Radio. 2009; 6(4): 247-52.
9. Nazarpoor M. Effect of phase-encoding scheme on the relationship between contrast agent concentration and signal intensity on inversion recovery Turbo Fast Low-Angle Shot T1-weighted images. Radiol Phys Technol. 2014; 7(2):262-70.
10. Nazarpoor M. Effects of inversion and saturation times on relationships between contrast agent concentrations and signal intensities of T1-weighted magnetic resonance images. Radiol Phys Technol. 2010; 3: 120-6.DOI 10.1007/s12194-010-0087-9
11. Nazarpoor M. Evaluation of flow measurement from the first pass bolus T1 weighted images using inversion recovery sequence. Br J Radiol. 2011 Apr;84(1000):342-9.
12. Nazarpoor M, Mayabi Z, Shfaie A, Pesianian E, Aghaverdizadeh D. Maximum Relationship between Signal Intensity and Concentration of Contrast Agent in 0.3 T and 1.5 T using T1-weighted Spin Echo Sequence. Medical Journal of Tabriz University of Medical Sciences & Health services 2011; 32(6): 72-6 (Farsi).
13. Nazarpoor M, Organ Blood Flow Measurement with T1 and T2*-Weighted MRI Techniques (book, chapter 4 and 5). (LAP LAMBERT Academic Publishing GmbH & Co. KG) 2012; ISBN 978-3-8484-3648-4.
14. Nazarpoor M, Poureisa M, Daghighi MH. Comparison of maximum signal intensity of contrast agent on T1 weighted images using spin echo, fast spin echo and inversion recovery sequences. Iran J Radiol. 2013; 10(1): 27-32.
15. Nazarpoor M, Poureisa M, Daghighi MH. Effect of Echo Time on the Maximum Relationship between Contrast Agent Concentration and Signal Intensity Using FLAIR Sequence. Iran J Med Phys. 2013; 10(1-2):59-67.
16. Holland S K, Williams P M, Dunn R S, Wansapura J P, and Ball W S. A capillary phantom for testing dynamic perfusion weighted MRI. Proceeding of the ISMRM, 2(6th Scientific meeting and exhibition, Sedny Australia):1456, April 1998.
17. Interactive Data Language (IDL) Research Systems, Inc., of Boulder, CO Available from: