The Effect of Disease Modifying Therapies on
Brain Atrophy in Patients with
Relapsing-Remitting Multiple Sclerosis: A Systematic
Review and Meta-Analysis
Georgios Tsivgoulis1,2,3*, Aristeidis H. Katsanos1,4, Nikolaos Grigoriadis5, Georgios M. Hadjigeorgiou6, Ioannis Heliopoulos7, Constantinos Kilidireas8,
Konstantinos Voumvourakis1
1Second Department of Neurology,“Attikon”Hospital, School of Medicine, University of Athens, Athens, Greece,2Department of Neurology, The University of Tennessee Health Science Center, Memphis, Tennessee, United States of America,3International Clinical Research Center, Department of Neurology, St. Anne’s University Hospital in Brno, Brno, Czech Republic,4Department of Neurology, School of Medicine, University of Ioannina, Ioannina, Greece,5Second Department of Neurology,“AHEPA”University Hospital, Aristotelion University of Thessaloniki, Thessaloniki, Macedonia, Greece,6Department of Neurology, University Hospital of Larissa, University of Thessaly, Larissa, Greece,7Department of Neurology, Alexandroupolis University Hospital, Democritus University of Thrace, Alexandroupolis, Greece,
8First Department of Neurology,“Eginition”Hospital, School of Medicine, University of Athens, Athens, Greece
*tsivgoulisgiorg@yahoo.gr
Abstract
Background
The aim of the present meta-analysis was to evaluate the effect of disease-modifying drugs (DMD) on brain atrophy in patients with relapsing-remitting multiple sclerosis (RRMS) using available randomized-controlled trial (RCT) data.
Methods
We conducted a systematic review and meta-analysis according to PRISMA guidelines of all available RCTs of patients with RRMS that reported data on brain volume measurements during the study period.
Results
We identified 4 eligible studies, including a total of 1819 RRMS patients (71% women, mean age 36.5 years, mean baseline EDSS-score: 2.4). The mean percentage change in brain volume was found to be significantly lower in DMD versus placebo subgroup (stan-dardized mean difference: -0.19; 95%CI: -0.27–-0.11; p<0.001). We detected no evidence of heterogeneity between estimates (I2= 30%, p = 0.19) nor publication bias in the Funnel plots. Sensitivity analyses stratifying studies according to brain atrophy neuroimaging proto-col disclosed no evidence of heterogeneity (p = 0.16). In meta-regression analyses, the per-centage change in brain volume was found to be inversely related with duration of
observation period in both DMD (meta-regression slope = -0.03; 95% CI: -0.04–-0.02; OPEN ACCESS
Citation:Tsivgoulis G, Katsanos AH, Grigoriadis N, Hadjigeorgiou GM, Heliopoulos I, Kilidireas C, et al. (2015) The Effect of Disease Modifying Therapies on Brain Atrophy in Patients with Relapsing-Remitting Multiple Sclerosis: A Systematic Review and Meta-Analysis. PLoS ONE 10(3): e0116511. doi:10.1371/ journal.pone.0116511
Academic Editor:Sreeram V. Ramagopalan, University of Oxford, UNITED KINGDOM
Received:October 14, 2014
Accepted:December 10, 2014
Published:March 10, 2015
Copyright:© 2015 Tsivgoulis et al. This is an open access article distributed under the terms of the
Creative Commons Attribution License, which permits unrestricted use, distribution, and reproduction in any medium, provided the original author and source are credited.
Data Availability Statement:All relevant data are within the paper and its Supporting Information files.
p<0.001) and placebo subgroups (meta-regression slope = -0.05; 95% CI: -0.06–-0.04; p<0.001). However, the rate of percentage brain volume loss over time was greater in pla-cebo than in DMD subgroup (p = 0.017, ANCOVA).
Conclusions
DMD appear to be effective in attenuating brain atrophy in comparison to placebo and their benefit in delaying the rate of brain volume loss increases linearly with longer
treatment duration.
Introduction
Longitudinal studies have shown that brain atrophy is a significant predictor of subsequent long-term neurologic deterioration, impaired life quality and sustained disability in patients
with multiple sclerosis (MS) [1]. Brain atrophy was also found to be related to cognitive deficits
(even in the early stages of the disease) mood disturbances, sexual dysfunction and personality
disorders [1–3].
Brain atrophy may occur in early disease stages, progresses more rapidly than in healthy indi-viduals and appears to advance relentlessly throughout the course of MS, independent of the
un-derlying disease subtype when adjusted for baseline volume [4,5]. A recent meta-analysis
underlined that the treatment effect of available immunomodulatory therapies on brain atrophy was related to the effect on disability progression in patients with relapsing-remitting MS (RRMS). Interestingly, the former association was independent of the treatment effect on active
lesions in magnetic resonance imaging (MRI) [6]. Prospective cohort studies and randomized
controlled trials (RCTs) have reported variable results regarding the potential protective effects
of different disease modifying drugs (DMD) on brain atrophy [7–10, References 1–13 inS1 File].
To the best of our knowledge the efficacy of DMD in attenuating brain atrophy in MS pa-tients has not been investigated systematically using a meta-analytical approach. In view of the former considerations we conducted a systematic review and meta-analysis to evaluate the ef-fect of available DMD on brain atrophy in patients with RRMS using available RCT data.
Methods
Trial identification and data abstraction
This meta-analysis has adopted the Preferred Reporting Items for Systematic Reviews and
Meta-Analyses (PRISMA) guidelines for systematic reviews and meta-analyses [11]. Eligible
placebo-control randomized clinical trials (RCTs) of patients with RRMS that reported changes in brain volume during the study period were identified by searching MEDLINE, SCOPUS and the CENTRAL Register of Controlled Trials. The combination of search strings that was
used in all database searches included the terms:“relapsing-remitting multiple sclerosis”,
“RRMS”,“brain atrophy”and“brain volume”. The complete search algorithm that was used in
MEDLINE search is available in theS1 File. No language or other restrictions were imposed.
Last literature search was conducted on August 23th, 2014. Reference lists of all articles that met the criteria and of relevant review articles were examined to identify studies that may have been missed by the database search.
All retrieved studies were scanned independently by two reviewers (GT & AHK) to include only placebo-control RCTs of RRMS patients that reported changes in brain volume during
Pharma. Dr. Hadjigeorgiou reports no sources of funding. Dr. Heliopoulos reports no sources of funding. Dr. Kilidireas reports no sources of funding. Dr. Voumvourakis has received research support (not related to this project) from Teva Pharmaceutical Hellas, Merck Hellas, Genesis Pharma and Novartis Hellas. The funders had no role in study design, data collection and analysis, decision to publish, or preparation of the manuscript.
the study period. We excluded from the final analysis: 1. Observational studies, 2. case series, 3. case reports, 4. RCTs without placebo subgroups, 5. studies reporting the use of drugs that are still not officially approved (e.g. laquinimod, cladribine), and 6. studies reporting brain vol-ume data with median values or not providing measures of dispersion in the form of standard deviation (SD). We considered that including trials reporting brain volume loss both in medi-ans (with corresponding confidence intervals) and in memedi-ans (with corresponding SDs would constitute another source of heterogeneity in our meta-analysis that could probably lead to in-correct pooled outcomes, given the differences in dispersion measures between comparison groups in the other studies. Thus we decided in our study protocol and analysis plan that was
formulated according to PRISMA guidelines [11] and Cochrane Handbook for Systematic
Re-views of Interventions [12] to exclude per se studies that did not provide the corresponding
SDs for both treatment and placebo groups. In case of disagreement regarding the literature search results between the two coauthors, the senior coauthor was consulted (KV) and dis-agreement was resolved with consensus.
In each study that met the inclusion criteria for the quantitative analysis a predefined 7-point quality control was used to address for biases. For each quality item the corresponding risk of
bias was categorized as low, high or unclear according to the suggestions by Higgins et al [12].
Quality control and bias identification was performed by three independent reviewers (GT, AHK, KV) and all emerging conflicts were resolved with consensus.
Data on brain volume changes in all subgroups between time points, or during time inter-vals within studies were extracted independently by the two authors, who performed the litera-ture search (GT, AHK).
Statistical analyses
Unadjusted mean differences of percentage changes in brain volumes between treatment and placebo subgroups were pooled as standardized mean differences (SMDs). SMD estimates were calculated as the mean differences divided by the corresponding pooled standard deviations and were subsequently interpreted using a general rule of thumb reported by Cohen, in which an SMD of 0.2 represents a small effect, an SMD of 0.5 represents a medium effect, and an
SMD of 0.8 or larger represents a large effect [13]. A random-effects model (DerSimonian
Laird) was used to calculate the pooled SMDs.
Heterogeneity between studies was assessed with the Cochran Q and I2statistics. For the
qualitative interpretation of heterogeneity, I2values of at least 50% were considered to
repre-sent substantial heterogeneity, while values of at least 75% indicated considerable
heterogene-ity, as per the Cochrane Handbook [14]. Publication bias (i.e. assessment of bias across studies)
was graphically evaluated using a funnel plot, given that the Cochrane Handbook for Systemat-ic Reviews of Interventions dSystemat-ictates as a rule of thumb that tests for funnel plot asymmetry
should be used only when there are at least ten studies included in the meta-analysis [15].
Finally, we performed post-hoc meta-regression analyses to evaluate both time alone (in pla-cebo subgroups) and time-on-treatment (in treatment subgroups) as possible moderators of the percentage brain volume change. Univariate meta-regression analyses were performed using the random-effects model (Method of Moments). The regression lines derived from the aforemen-tioned univariate meta-regression analyses were compared using the analysis of covariance (ANCOVA) to determine the effect of treatment on percentage brain volume change over time.
Statistical analyses were conducted using Review Manager (RevMan) Version 5.2 software (Copenhagen: The Nordic Cochrane Centre, The Cochrane Collaboration, 2012) and Compre-hensive Meta-analysis Version 2 software (Borenstein M, Hedges L, Higgins J, Rothstein H, Biostat, Englewood NJ, 2005).
Results
Study selection and study characteristics
Systematic search of MEDLINE and SCOPUS databases yielded 60 and 57 results respectively. Subsequent search in the CENTRAL Register of Controlled Trials retrieved no additional RCTs. After removing duplicates, the titles and abstracts from the remaining 75 studies were screened and 17 potentially eligible studies for the meta-analysis were retained. After retriev-ing the full-text version of the aforementioned 17 studies, 4 studies were excluded because they did not include a placebo subgroup and 2 studies because they were not RCT (cohort studies), 6 studies because they reported the brain volume changes in median values and 1
study because it did not report the SDs or other measures of dispersion (Table A inS1 File).
In the final presentation of the literature search results, there was no conflict or disagreement between the 2 reviewers and the 4 studies that met the study protocol’s inclusion criteria
(IMPROVE [7], FREEDOMS [8], E/C GASG [9], MSCRG [10]) were included both in the
qualitative and quantitative synthesis (Fig. 1). The characteristics of the included studies,
com-prising 1819 patients (71% women, mean age: 36.5 years, mean baseline EDSS score: 2.4) are
summarized inTable 1.
Two of the studies [9,10] evaluating brain atrophy by means of the brain parenchymal
frac-tion (BPF), a normalized measure of atrophy calculated as the ratio of brain parenchymal tissue volume to the total volume contained within the brain surface contour. More specifically, the neuroimaging protocol used an automated image analysis method that incorporates a three-dimensonal segmentation algorithm designed for brain surface detection and brain volume
cal-culation [16]. The other two studies [12,13] used the Structural Image Evaluation using
Nor-malization of Atrophy (SIENA) method, which provides an automated brain volume change
analysis from baseline [17].
Risk of bias for independent studies
Risk of bias in the included studies is summarized in Figs. A&B inS1 File. Overall, a low risk of
bias was found within individual studies, except for the uncertainty of bias related to funding
source according to Cochrane recommendations [18]. All study protocols were supported
fi-nancially partly [10] or solely [7–9] by the pharmaceutical companies that produce and market
the drug under consideration in each study. In one of them it was clearly stated in the methods section that the study data were collected by the investigators and analyzed by the sponsor
pharmaceutical company [8], increasing thus the susceptibility to a possible bias. Allocation
concealment was not clearly stated in the methods section of one study protocol [9], providing
Overall analysis and subgroup analyses
The mean percentage change in brain volume was found to be significantly lower in DMD
treated patients versus placebo treated subgroup (SMD = -0.19, 95%CI: -0.27–-0.11; p<0.001;
Fig. 2). No evidence of heterogeneity was found between estimates (I2= 30%, p = 0.19 by Cochran Q statistics). In the sentitivity analysis stratifying patients according to MRI protocol that was used for the measurement of the brain volume change, there was no evidence of het-erogeneity in the estimates between the studies using the SIENA or the BPF method (Fig. C in
S1 File).
Fig 1. Flow chart presenting the selection of eligible studies.
In the subgroup analysis of the two studies that provided data on brain volume changes for
both the first (0–12 months) and second (12–24 months) treatment year [8,10], the difference
in percentage brain volume change between RRMS patients under treatment with Fingolimod (0.5 mg or 1.25 mg) or INFb-1a (30mcg) and RRMS patients randomized to placebo was great-er (p = 0.03) in the second (SMD = -0.30; 95%CI: -0.40, -0.19) than in the first year of treatment
(SMD = -0.14; 95%CI: -0.24, -0.03;Fig. 3), indicating that the beneficial effect of DMD on
brain atrophy is enhanced during the second year of treatment.
Publication bias was evaluated using inspection of funnel plot asymmetry in view of the small number (n = 4) of included studies. The slight asymmetry observed on the funnel plot in-spection can be attributed to the existing differences among studies with regard to
neuroimag-ing protocols (Fig. D inS1 File) and treatment duration (Fig. E inS1 File), rather than in the
presence of publication bias. To further investigate potential publication bias we also estimated Egger’s statistical test that did not reach the level of statistical significance (p = 0.09).
Meta-regression analyses
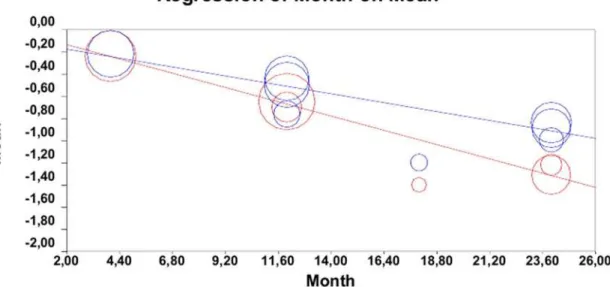
In meta-regression analyses, the percentage change in brain volume was found to be inversely associated with duration of observation period in both DMD (regression slope = -0.03; 95%
CI: -0.04–-0.02; p<0.001;Fig. 4, blue lines) and placebo subgroups (regression slope: -0.05;
95% CI: -0.06–-0.04; p<0.001;Fig. 4, red lines). By comparing the two meta-regression slopes,
Table 1. Characteristics of the included in meta-analysis randomized clinical trials of patients with relapsing-remitting multiple sclerosis.
Author Study name Subgroup Dose No patients Females Age bEDSS
De Stefano[7] IMPROVE INFb-1a (44 mcg) 3/ week (sc) 120 - -
-Placebo 3/ week (sc) 60 - -
-Kappos[8] FREEDOMS Fingolimod (1.25mg) 1/ daily (pos) 429 68.8% 37.4±8.9 2.4±1.4
Fingolimod (0.5mg) 1/ daily (pos) 425 69.6% 36.6±8.8 2.3±1.3
Placebo 1/ daily (pos) 418 71.3% 37.2±8.6 2.5±1.3
Rovaris[9] E/C GASG GA (20mg) 1/ daily (sc) 113 77.0% 34.4±7.4 2.3±1.1
Placebo 1/ daily (sc) 114 72.8% 34.0±7.6 2.4±1.2
Rudick[10] MSCRG INFb-1a (30 mcg) 1/ week (im) 68 76.5% 36.5±7.2 2.32±0.79
Placebo 1/ week (im) 72 75% 36.4±7.1 2.38±0.91
(sc: subcutaneously, pos: per os, im: intramuscularly, bEDSS: baseline Expanded Disability Status Scale)
doi:10.1371/journal.pone.0116511.t001
Fig 2. Percentage changes in mean brain volume in patients with relapsing-remitting multiple sclerosis receiving disease modifying therapy compared and those receiving placebo.
the rate of percentage brain volume loss over time was higher in placebo-treated patients than in patients receiving DMD (p = 0.017, ANCOVA).
Discussion
The findings from the current systematic review and meta-analysis indicate that DMD appear to attenuate brain atrophy over time when compared with placebo. Moreover, their efficacy ap-pears to be greater during the second year of treatment (in comparison to the first year) and linearly increases with longer treatment duration.
In untreated MS patients receiving placebo, the rate of atrophy is about 1%-1.5% of brain
volume per year [19]. Given the fact that brain volume loss can be non-invasively and
Fig 3. Subgroup analysis of the randomized clinical trials on percentage brain volume changes between the first and second year of the study.
doi:10.1371/journal.pone.0116511.g003
Fig 4. Meta-regression analyses of the percentage change in brain volume over time between treatment subgroups (blue lines) and placebo subgroups (red lines).
reproducibly detected and quantified by MRI [20], whole brain atrophy has recently emerged as an attractive measure of long-term tissue loss and as a substrate for clinical disability and
therapy effectiveness [21,22]. In particular, brain volume loss has been correlated with
disabili-ty progression and cognitive impairment in MS, the loss of grey matter volume being more
closely correlated with clinical measures than loss of white matter volume [23]. However, for
the time being brain volume loss may hardly be used as a decision making biological marker in the everyday clinical practice. Our analyses documented a modest beneficial effect of DMD on brain atrophy, with no evidence of heterogeneity across trials using different immunomodula-tory treatments (sc INFb-1a, im INFb-1a, Fingolimod and Glatiramer Acetate) or different neuroimaging protocols (SIENA or BPF). Moreover, we documented low risk of selection, per-formance, detection, attrition and reporting biases using the validated, quality-control method-ology of Cochrane collaboration for the assessment and quantification of biases in individual
studies included in comprehensive meta-analyses [12]. Our findings add to the mounting
liter-ature endorsing extension of brain atrophy measurements beyond research studies to the rou-tine management of MS patients and underscoring the need of their incorporation as
secondary outcome measures in RCT [24,25].
Our sensitivity analyses indicated that the pooled beneficial effect of DMD on brain atrophy doubled during the second (SMD: -30) in comparison to the first year of treatment (SMD: -14). This observation may be attributed to an increase in non-tissue-related brain volume loss dur-ing the first 6–9 months of disease modifydur-ing therapies (termed pseudoatrophy), thought to be
due to the resolution of inflammation and brain edema [19,26]. Interestingly, high-dose
intra-venous (IV) corticosteroids and especially natalizumab are associated with the highest decline in non-tissue-related brain volume loss due to their potent anti-inflammatory properties
[19,26,27]. Thus, our observations suggest that the development of pseudoatrophy may
con-found MRI measurements of BV loss during the first year of treatment and an observation
pe-riod of2 years may be optimal to evaluate the potential beneficial effect of DMD on brain
atrophy in future RCTs.
Our meta-regression analyses underline that the protective effect of DMD on brain volume loss is accentuated with longer treatment duration. This observation raises the clinical hypothe-sis that early initiation of DMD may extend the therapeutic time window leading to greater cu-mulative benefit in terms of brain atrophy prevention. This hypothesis is in agreement with pathology data indicating that acute axonal damage occurs early during disease course and consequently early treatment with disease-modifying therapies may prevent axonal and brain
volume loss leading to disability progression [28]. Furthermore, RCT data also lends support
to this hypothesis, since both sc INFb-1a [29] and glatiramer acetate [30] have been associated
with attenuation of brain volume loss in comparison to placebo in patients with clinically isolated syndrome.
that the aforementioned differences in the treatment subgroups could be-at least partially- re-sponsible for the identified correlations, even though no evidence of heterogeneity was detected among trials. Fourth, the imaging methods that were used for the measurement of brain vol-ume change were not identical in the included studies and this may have confounded the re-ported associations. However, it should be kept in mind that no significant heterogeneity was detected between trials using different neuroimaging protocols in our sensitivity analyses. Fi-nally, this meta-analysis evaluated only the effect of DMD on brain volume loss and our find-ings are not applicable to other treatment options currently evaluated in MS such as
immunosuppressive or chemotherapy agents that have been shown to induce excessive and
sustained brain volume reductions in MS patients [26,27,31].
Supporting Information
S1 File. MEDLINE search algorithm. Table A. List of the full-text excluded articles with the
reasons for exclusion.Supplemental references in S1 File. Fig. A.Risk of bias summary:
re-view authors’judgments about each risk of bias item for each included study.Fig. B.Risk of
bias graph: review authors’judgments about each risk of bias item presented as percentages
across all included studies.Fig. C.Subgroup analysis according to the imaging protocol that
was used to measure the changes in brain volume.Figs. D&E.Funnel plots of the
included studies. (RTF)
Author Contributions
Conceived and designed the experiments: GT KV. Analyzed the data: GT AHK. Contributed reagents/materials/analysis tools: NG GMH. Wrote the paper: GT AHK. Critical revisions: NG GMH IH CK.
References
1. Filippi M, Rocca MA (2010) MR imaging of gray matter involvement in multiple sclerosis: implications for understanding disease pathophysiology and monitoring treatment efficacy. AJNR Am J Neuroradiol 31:1171–1177. doi:10.3174/ajnr.A1944PMID:20044503
2. Giorgio A, De Stefano N (2010) Cognition in multiple sclerosis: relevance of lesions, brain atrophy and proton MR spectroscopy. Neurol Sci 31:S245–8. doi:10.1007/s10072-010-0370-xPMID:20635111 3. Benedict RH, Carone DA, Bakshi R. Correlating brain atrophy with cognitive dysfunction, mood
distur-bances, and personality disorder in multiple sclerosis (2004) J Neuroimaging 14 (3 Suppl):36S–45S. PMID:15228758
4. Chard DT, Griffin CM, Parker GJ, Kapoor R, Thompson AJ, et al (2002) Brain atrophy in clinically early relapsing-remitting multiple sclerosis. Brain 125:327–337 PMID:11844733
5. De Stefano N, Giorgio A, Battaglini M, Rovaris M, Sormani MP, et al (2010) Assessing brain atrophy rates in a large population of untreated multiple sclerosis subtypes. Neurology 74:1868–1876. doi:10. 1212/WNL.0b013e3181e24136PMID:20530323
6. Sormani MP, Arnold DL, De Stefano N (2014) Treatment effect on brain atrophy correlates with treat-ment effect on disability in multiple sclerosis. Ann Neurol 75:43–9. doi:10.1002/ana.24018PMID: 24006277
7. De Stefano N, Sormani MP, Stubinski B, Blevins G, Drulovic JS, et al (2012) Efficacy and safety of sub-cutaneous interferonβ-1a in relapsing-remitting multiple sclerosis: further outcomes from the IM-PROVE study. J Neurol Sci 312:97–101. doi:10.1016/j.jns.2011.08.013PMID:21880336
8. Kappos L, Radue EW, O’Connor P, Polman C, Hohlfeld R, et al (2010) A placebo-controlled trial of oral fingolimod in relapsing multiple sclerosis. N Engl J Med 362:387–401. doi:10.1056/NEJMoa0909494 PMID:20089952
10. Rudick RA, Fisher E, Lee JC, Simon J, Jacobs L (1999) Use of the brain parenchymal fraction to mea-sure whole brain atrophy in relapsing-remitting MS. Multiple Sclerosis Collaborative Research Group. Neurology 53:1698–704. PMID:10563615
11. Liberati A, Altman DG, Tetzlaff J, Mulrow C, Gotzsche PC, et al (2009) The prisma statement for report-ing systematic reviews and meta-analyses of studies that evaluate health care interventions: Explana-tion and elaboraExplana-tion. J Clin Epidemiol 62:e1–34 doi:10.1016/j.jclinepi.2009.06.006PMID:19631507 12. Higgins JP, Altman DG, Gotzsche PC, Jüni P, Moher D, et al (2011) The cochrane collaboration’s tool for
assessing risk of bias in randomised trials. BMJ 343:d5928 doi:10.1136/bmj.d5928PMID:22008217 13. Cohen J (1988) Statistical Power Analysis for the Behavioral Sciences. Hillsdale, New Jersey:
Law-rence Erlbaum Associates: Routledge.
14. Deeks JJ, Higgins JP, Altman DG. Chapter 9: Analysing data and undertaking meta-analyses. Cochrane Handbook for Systematic Reviews of Interventions website.http://handbook.cochrane.org/ chapter_9/9_analysing_data_and_undertaking_meta_analyses.htm. Updated March 2011. Accessed February 4th, 2014.
15. Sterne JA, Sutton AJ, Ioannidis JP, Terrin N, Jones DR, et al (2011) Recommendations for examining and interpreting funnel plot asymmetry in meta-analyses of randomised controlled trials. BMJ 343: d4002. doi:10.1136/bmj.d4002PMID:21784880
16. Fisher E, Cothren RM, Tkach JA, Masaryk TJ, Cornhill JF (1997) Knowledge-based 3D segmentation of MR images for quantitative MS lesion tracking. SPIE Med Imag 3034:599–610.
17. Smith SM, Zhang Y, Jenkinson M, Chen J, Matthews PM, et al (2002) Accurate, robust, and automated longitudinal and cross-sectional brain change analysis. Neuroimage 17:479–89. PMID:12482100 18. Bero LA (2013) Why the Cochrane risk of bias tool should include funding source as a standard item
[editorial]. Cochrane Database of Systematic Reviews ( 12):ED000075 PMID:24575439
19. Zivadinov R, Stosic M, Cox JL, Ramasamy DP, Dwyer MG (2008) The place of conventional MRI and newly emerging MRI techniques in monitoring different aspects of treatment outcome. J Neurol 255 (Suppl 1):61–74 doi:10.1007/s00415-008-1009-1PMID:18317678
20. Grassiot B, Desgranges B, Eustache F, Defer G (2009) Quantification and clinical relevance of brain at-rophy in multiple sclerosis: a review. J Neurol 256:1397–412. doi:10.1007/s00415-009-5108-4PMID: 19353226
21. Bermel RA, Bakshi R (2006) The measurement and clinical relevance of brain atrophy in multiple scle-rosis. Lancet Neurol 5:158–170. PMID:16426992
22. Barkhof F, Calabresi PA, Miller DH, Reingold SC (2009) Imaging outcomes for neuroprotection and re-pair in multiple sclerosis trials. Nat Rev Neurol 5:256–266. doi:10.1038/nrneurol.2009.41PMID: 19488083
23. De Stefano N, Airas L, Grigoriadis N, Mattle HP, O’Riordan J, et al (2014) Clinical relevance of brain vol-ume measures in multiple sclerosis. CNS Drugs 28:147–56. doi:10.1007/s40263-014-0140-zPMID: 24446248
24. Arnold DL, De Stefano N (2013) Preventing brain atrophy should be the gold standard of effective thera-py in multiple sclerosis (after the first year of treatment): Commentary. Mult Scler 19:1007–8. doi:10. 1177/1352458513490550PMID:23818020
25. Rudick RA, Fisher E (2013) Preventing brain atrophy should be the gold standard of effective therapy in MS (after the first year of treatment): Yes. Mult Scler 19:1003–4. doi:10.1177/1352458513482385 PMID:23818018
26. Zivadinov R, Reder AT, Filippi M, Minagar A, Stüve O, et al (2008) Mechanisms of action of disease-modifying agents and brain volume changes in multiple sclerosis. Neurology 71:136–44. doi:10.1212/ 01.wnl.0000316810.01120.05PMID:18606968
27. Khoury S, Bakshi R (2010) Cerebral pseudoatrophy or real atrophy after therapy in multiple sclerosis. Ann Neurol 68:778–9. doi:10.1002/ana.22254PMID:21194148
28. Kuhlmann T, Lingfeld G, Bitsch A, Schuchardt J, Brück W (2002) Acute axonal damage in multiple scle-rosis is most extensive in early disease stages and decreases over time. Brain 125:2202–2212. PMID: 12244078
29. Filippi M, Rovaris M, Inglese M, Barkhof F, De Stefano N, et al (2004) Interferon beta-1a for brain tissue loss in patients at presentation with syndromes suggestive of multiple sclerosis: a randomised, double-blind, placebo-controlled trial. Lancet 364:1489–1496. PMID:15500893
30. Comi G, Martinelli V, Rodegher M, Moiola L, Leocani L, et al (2013) Effects of early treatment with glatir-amer acetate in patients with clinically isolated syndrome. Mult Scler 19:1074–1083. doi:10.1177/ 1352458512469695PMID:23234810