A direct and comprehensive test of two postulates of politeness theory
applied to uncertainty communication
Miroslav Sirota
∗Marie Juanchich
†Abstract
Applied to uncertainty communication, politeness theory postulates that when announcing bad news (1) speakers may intend not only to inform, but also to manage (e.g., save) the hearers’ or speakers’ own faces (i.e., face-managing intentions), and (2) speakers may perform face-managing intentions by altering the explicitly communicated probability. Previous research has assumed these two core postulates when explaining various reasoning and judgment phenomena in hearers, but has failed to test them empirically in a comprehensive and direct way: jointly in relation to speakers. To provide this critical evidence, we asked subjects to communicate a predefined numerical probability of two negative outcomes, using a verbal probability scale. Subjects reported their communication intentions afterwards. In line with the first politeness theory postulate, speakers intended not only to be informative but also to tactfully announce bad news or to avoid being blamed in case they made inaccurate (too low or too high) prediction. In line with the second politeness theory postulate, speakers altered their explicitly communicated probability more often and more substantially when adopting face-managing intentions than when adopting informative intentions. We discuss how this evidence corroborates the politeness theory and validates the previous research that focused on hearers.
Keywords: politeness theory, face-managing intentions, uncertainty communication, probability perception, verbal probability.
1
Introduction
Politeness theory postulates the existence of a public self-image that each individual tries to protect (Brown & Levin-son, 1987). This image is posited to rely on two faces: the positive face represents the need to be approved, valued and desired, whereas the negative face represents the need to be free and independent. Social interaction involves behaviour that threatens the integrity of our public image, and there-fore people often resort to face-management strategies to preserve good relationships. Face-management strategies harness conversational means to alleviate potential damage to the positive and the negative faces of the conversational partners (i.e., speakers and hearers). For example, speak-ers may soften a criticism to avoid threatening the positive faces of hearers and to avoid making them feel incompetent, or speakers may avoid statements upsetting to hearers, thus avoiding the implication that hearers’ feelings do not matter. Simultaneously, speakers may be anxious about the possi-ble threat to their own positive faces. For example, speakers may under-estimate the probability of a negative outcome
We thank Jonathan Baron and the anonymous reviewers for helpful sug-gestions on an earlier version of this article.
Copyright: © 2015. The authors license this article under the terms of the Creative Commons Attribution 3.0 License.
∗Department of Psychology, Kingston University, Penrhyn
Road, Kingston upon Thames, Surrey KT1 2EE, UK. Email: [email protected].
†Department of Management, Kingston University.
where they wish to avoid being blamed in hindsight for ex-aggerating the probability. They may also over-estimate the probability of the negative outcome where they worry about being blamed in hindsight for underplaying the probability.
Hence, politeness theory relies, inter alia, on two core postulates to account for variability in everyday communi-cation. First, speakers announcing potentially upsetting in-formation may intend to inform hearers, but may also intend to manage the faces of hearers (hearer face-managing inten-tion) or their own faces (speaker face-managing inteninten-tion) so as to limit damage to the public self-image of hearers or of themselves (e.g., “loss of face”). Second, speakers adopt-ing face-managadopt-ing intentions deliver information that differs from the information they actually have in mind.
The two postulates of politeness theory might be applied to the communication of uncertainty associated with nega-tive outcomes. First, speakers making a prediction may in-tend not only to inform about a probability level, but also to manage the hearers’ faces or their own (i.e., hearer and speaker face-managing intentions) [hereafter Postulate 1]. Second, speakers perform face-managing intentions by al-tering (e.g., lessening or magnifying) the explicitly commu-nicated probability of a negative outcome [hereafter Pos-tulate 2]. Thus, politeness theory posits that speakers use uncertainty quantifiers to pursue informative intentions and also to sugar-coat threatening news to manage the hearers’ or their own faces. For example, a physician could qualify the likelihood of cancer developing in a patient as “likely” in order to informatively communicate her opinion about the
probability (i.e., informative intention). However, she could also qualify it as “possible” rather than “likely” to communi-cate the bad news more tactfully (i.e., hearer face-managing intention). Alternatively, she could qualify it as “quite pos-sible” rather than “likely” to communicate the likely diag-nosis cautiously, in case the patient does not, in fact, turn out to have cancer (i.e., speaker face-managing intention, downward adjustment). She could also qualify it as “very likely” rather than “likely” to communicate the likely diag-nosis cautiously, in the case in which the patient does in-deed turn out to have cancer (i.e., speaker face-managing intention, upward adjustment), thus protecting her own face against the embarrassment of missing the diagnosis.
Prior research has used both these postulates to derive hy-potheses explaining different judgment and reasoning phe-nomena in hearers receiving a face-threatening message: indeed almost all previous research has focused on the hearer. For instance, prior research has explained the sever-ity effect as caused by hearers who inflated their subjec-tive probability of a severe outcome on the basis of face-managing considerations. Hearers assumed more frequently that speakers use face-managing intentions when announc-ing severe—face-threatenannounc-ing—outcomes rather than when announcing less negative outcomes (Bonnefon & Villejou-bert, 2006). In additional studies, hearers who assumed speakers to be polite or cautious adjusted the numerical meaning of various verbal and numerical quantifiers of neg-ative outcomes upwards. They did so, because they believed that face-managing speakers communicated a downplayed probability (Juanchich, Sirota & Butler et al., 2012; Sirota & Juanchich, 2012b). In a domain of reasoning, hearers de-rived scalar inferences with existential quantifiers such as “some” differently, depending on whether they thought the speakers aimed to be tactful or not (Bonnefon, Feeney & Villejoubert, 2009; Feeney & Bonnefon, 2013). Finally, prior research pinpointed the practical danger of hearers’ polite misunderstandings in the communicated risk of, for instance, health-related outcomes (Bonnefon, Feeney & De Neys, 2011; Pighin & Bonnefon, 2011). In summary, prior studies focused on the hearers—hearers’ inferences about the speakers’ intentions guiding the interpretation of com-municated information—rather than on the speakers. There-fore, this previous research supports the two core postulates only indirectly.
One notable exception to the focus on hearers is a study in which the researchers manipulated the intentions of speak-ers instead of hearspeak-ers’ expectations of the speakspeak-ers’ inten-tions (Juanchich & Sirota, 2013). The researchers asked subjects to either be informative, tactful, or cautious when communicating the predefined probability of a negative out-come. Consistent with the second postulate, the intentions of speakers affected the probability they communicated: tactful and cautious speakers communicated a lower proba-bility than informative speakers. However, this study failed
to test the first postulate (i.e., speakers adopt these intentions spontaneously) and to test the two postulates conjointly.
To test the first postulate is critical, because speakers may spontaneously generate a different spectrum of communi-cation intentions or different proportions of the intentions than those assumed in Juanchich and Sirota’s study (2013). Indeed, other authors have suggested that speakers, in gen-eral, adopt mainly informative intentions (e.g., Grice, 1975). If we follow the quality maxim of Grice (1975), which prescribes speakers to be truthful in fulfilling the coopera-tive principle of a conversation, then we could assume that speakers would be as informative as possible and would say what they believed to be true in a clear and unambiguous manner (Grice, 1975).
To test the two politeness theory postulates conjointly is also critical. Even if speakers naturally generate a simi-lar spectrum of intentions and in comparable proportions (Juanchich & Sirota, 2013), it is still possible that the nat-urally adopted intentions, in contrast with those experimen-tally enforced, could fail to affect the communicated proba-bility. For example, speakers may intend to be tactful when giving bad news but may not provide a lower probability than informative speakers. Indeed, tactful speakers may perform the face-managing function by different verbal or non-verbal means to verbal probability expressions. Con-sistent with such an alternative explanation of their findings, Juanchich and Sirota (2013) discussed the possibility that demand effects could have triggered the effects of intentions on probability observed in their study.
2
The present research
In the present research, we aimed to devise a direct and com-prehensive test of two postulates of politeness theory applied to uncertainty communication by investigating speakers’ re-ported intentions and their effect on communicated proba-bility. We drew two hypotheses from the two postulates of politeness theory. First, we hypothesized that speakers will spontaneously adopt face-managing intentions (i.e., hearer or speaker face-managing intentions). Second, we hypoth-esized that speakers adopting face-managing intentions will communicate a different probability to speakers adopting in-formative intentions. Specifically, speakers adopting hearer face-managing intentions will communicate a lower proba-bility. However, speakers adopting speaker face-managing intentions will communicate either a lower or a higher prob-ability. Some such speakers will worry about being blamed in hindsight for over-emphasizing the probability of a nega-tive outcome and some others for under-emphasizing it.
a list and, then, reported their communication intentions. This paradigm differs from those employed in prior research in three important aspects. In contrast with “hearers’ stud-ies” (e.g., Juanchich et al., 2012), subjects in the present study took the role of speakers, not of hearers, to enable a direct test of the politeness theory postulates. Further, the present study differs in two ways from the previous study that focused on speakers (Juanchich & Sirota, 2013). First, subjects reported their own spontaneous intentions, not ex-perimentally enforced ones, as well as their communicated probability, to enable us to provide a comprehensive test. Second, subjects reported their intentions after communi-cating the probability, not before, to enable us to eliminate the possible demand effects of intentions on probability.
2.1
Method
2.1.1 Subjects and design
Based on our previous experience with these studies, we re-cruited 132 Amazon Mechanical Turk workers. Subjects were English speaking Americans who received $0.15 for taking part in a three-minute study. Five subjects failed to report their socio-demographic information. Subjects represented a heterogeneous sample in terms of age (age ranged from 18 to 67 years, M = 34.7, SD = 13.1), gen-der (females: 60.6%), employment (working: 68.5%, un-employed: 27.6%, retired: 3.9%), education (a majority had at least some college education: 85.0%), and ethnicity (Caucasian: 74.0%, Asian: 10.2%, Hispanic: 7.1%, African American: 3.9%, and others: 4.7%).
Subjects communicated the probability of a negative out-come to a hypothetical friend and then they reported the communication they intended (informative, speaker face-managing, hearer face-face-managing, or other), in two different scenarios (car scenario and investment scenario), presented randomly to each subject. The order of presentation of the scenarios had no effect on the ascribed intentions,χ2(2) =
2.04,p= .173, nor on the perceived probabilities,t(262) = 0.83,p= .405.
2.1.2 Materials and procedure
After providing their informed consent, subjects read the first of the two scenarios, selected a verbal probability to communicate the bad news to a friend (i.e., 50% probability of occurrence of a negative outcome) and subsequently re-ported their communication intention, justifying their use of the specific verbal probability expression. Note that subjects could choose only one intention in each scenario. Subjects responded to the same questions, presented in the same or-der, for the second scenario. We used two scenarios describ-ing a negative outcome to establish the robustness of the structure of intentions and their effect on probability (both adapted from Juanchich & Sirota, 2013, see Appendix). In
the car scenario, subjects communicated a 50% probability that a friend’s newly-bought second-hand car would break down. In the investment scenario, subjects communicated a 50% probability that their friend’s stocks would lose their value.
To communicate the 50% probability, subjects selected a verbal probability from a list of seven expressions, convey-ing various degrees of certainty from 10% to 90% (adopted from Juanchich & Sirota, Experiment 1, 2013). The verbal probability scale consisted of seven positive verbal proba-bilities, ordered according to their probability magnitude, from low probability expressions to high probability ones: “a very small probability”, “a small probability”, “slightly probable”, “evenly probable”, “rather probable”, “proba-ble”, “quite probable”. We avoided negative expressions such asunlikelyor uncertain, to prevent subjects from se-lecting a term for its directionality rather than for its prob-ability magnitude (Teigen & Brun, 1999; Juanchich, Sirota, Karelitz & Villejoubert, 2013).
Subjects reported their communication intentions by se-lecting only one intention from the following four options:I
wanted to communicate the probability I had in mind
(mea-suring informative intentions);I tried to give my opinion in
the most tactful way (measuring hearer face-managing
in-tentions); I tried to be cautious, in case I could be wrong (measuring speaker face-managing intentions); andother
-please provide an explanation in the space available
(mea-suring other possible intentions).
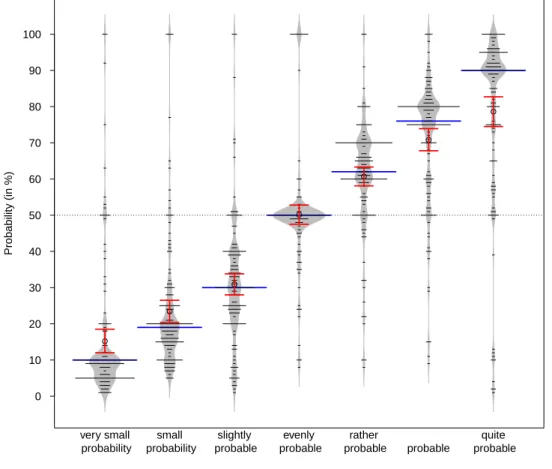
After answering the two questions for the two scenarios, subjects estimated the numerical probabilities they associ-ated with the seven verbal probabilities used in the verbal probability scale but presented in a randomized order and without specific context (i.e., not embedded into any specific scenario). We asked subjects to estimate the communicated probability (i.e., “In your opinion, what is the probability communicated by the expressions presented here?”). Sub-jects provided their estimates by positioning a cursor on a visual analog 0-100% probability scale (increments of 1). The scale had incremental anchors by 10 and three addi-tional verbal/numerical probability anchors: 0%, no chance, 50%, and 100%, certain. The estimated number was simul-taneously depicted to subjects as they moved the slide. The numerical translation aimed to enable us to capture the nu-merical meaning that each individual intended to convey when choosing a particular verbal probability expression. We chose to measure the numerical meaning of verbal prob-abilities to cope with the large between-subjects variability observed in numerical translation. For example, “it is pos-sible” can mean 50% probability for a group of subjects, but it can easily mean 30% for one of them and 70% for another. The group-level numerical values also controlled whether the probability magnitude order of the expressions of the scale was preserved.
Figure 1: Subjective numerical probability associated with the verbal probability expressions used in the verbal probability scale (symmetric bean plot combined with error bars showing 95% confidence interval of the mean). The blue lines represent the overall median probability per expression. The polygons represent the density shape determined by a normal density trace computed with a default bandwidth method using the Sheather-Jones method to select a bandwidth per batch and then averaging bandwidths over all batches (see Kampstra, 2008).
Verbal probability expressions
Probability (in %)
0 10 20 30 40 50 60 70 80 90 100
very small probability
small probability
slightly probable
evenly probable
rather
probable probable
quite probable
probability magnitude order was preserved and that the mid-dle point (i.e., evenly probable) gave a good representation of a 50% probability. Prior to the analysis, we translated the verbal probabilities into the numerical probabilities that each subject individually associated with the verbal prob-abilities. For example, subject 08 selected the expression “rather probable” in the car scenario and then quantified this expression as conveying a “60%” probability in the follow-up task and therefore, we translated the selection as “60%”, whereas subject 94 selected the same expression but quanti-fied it as conveying “80%” and therefore we translated this selection as “80%”. Finally, subjects provided their socio-demographic information. We analyzed data using the R statistical programming language (R Core Team, 2014).
2.2
Results
2.2.1 Postulate 1: Proportion of speakers’ intentions.
Out of all 246 reported intentions, speakers intended not only to be informative but also to tactfully announce bad news or to avoid being blamed (Figure 2). Although
sub-jects reported most often informative intentions, they also reported a substantial number of face-managing intentions: 41.6% of all intentions. The hearer face-managing inten-tions were slightly more common than the speaker face-managing intentions. Only a few speakers selected the “other intention” response, aside from the options we pro-vided: a likely indicator that the three studied intentions covered quite well the spectrum of the speakers’ commu-nication goals. These findings support the first hypothesis positing that speakers not only adopt informative intentions, but also face-managing intentions.
Figure 2: Speakers’ intentions in the Car and the Invest-ment scenario in % (n = 132, Error bars represent 95% CIs). “Hearer FM” = hearer face-managing intentions, “Speaker FM” = speaker face-managing intentions, “Informative” = informative intentions, “Other” = other than the pre-defined intentions.
Hearer FM Speaker FM Informative Other
Car Scenario
Intentions 0
10 20 30 40 50 60 70 80 90 100
Occurence (in %)
Hearer FM Speaker FM Informative Other
Investment Scenario
Intentions 0
10 20 30 40 50 60 70 80 90 100
Occurence (in %)
similar intentions for the two scenarios, between which we found a statistically significant association,χ2(9) = 22.53,p
= .008, Cramer’sV= 0.24 (Figure 3).
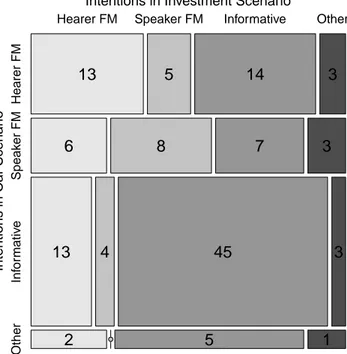
Interestingly, only a few subjects defined their own in-tentions (i.e., the category “other intention”), beyond the options we provided, n = 18. Ten of the other intentions actually described one of the three types of predefined in-tentions or a combination of these (e.g., being informative: This could seriously affect my friend so I would try to be very blunt and honest for his sake). Four of them described a new “better safe than sorry” intention, according to which sub-jects exaggerated the probability of occurrence of the
nega-Figure 3: Relative intra-individual consistency in adopting intentions in the Investment and Car scenarios. “Hearer FM” = hearer face-managing intentions, “Speaker FM” = speaker face-managing intentions, “Informative” = informa-tive intentions, “Other” = other than pre-defined intentions.
Intentions in Investment Scenario
Intentions in Car Scenar
io
Other
Inf
or
mativ
e
Speak
er FM
Hearer FM
Hearer FM Speaker FM Informative Other
13
5
14
3
6
8
7
3
13
4
45
3
2
5
1
tive outcome so as to err on the safe side (e.g.,Better safe than sorry so I said it could be probable). The remaining four intentions were hard-to-classify (e.g.,I was laughing at him). Because of the heterogeneity of this category, we have excluded these intentions from the subsequent analyses.
2.2.2 Postulate 2: Effect of speakers’ intentions on communicated probability.
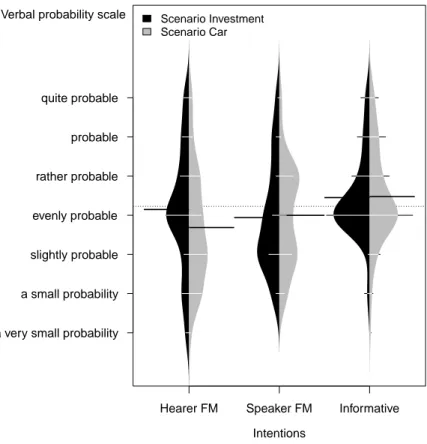
To communicate 50% probability the informative speakers selected the verbal probability “evenly probable” more of-ten than face-managing speakers who selected more ver-bal probabilities from the bottom of the verver-bal probability scale (Figure 4). In the Investment scenario, the downward adjustment was more pronounced with the speaker face-managing intentions, whereas in the Car scenario, the down-ward adjustment was more pronounced with the hearer face-managing intentions (Figure 4). Importantly, the bimodal distribution of probabilities communicated in the Car sce-nario for the speaker face-managing intentions shows that subjects communicated in both directions: either a lower or a higher probability than 50%.
Figure 4: Effect of communication intentions on verbal probability expressions chosen to convey bad news (asymmetric bean plot). The thick bold lines represent the mean probability per condition. The polygons represent a density shape determined by a normal density trace computed with a default bandwidth method. “Hearer FM” = hearer face-managing intentions, “Speaker FM” = speaker face-managing intentions, “Informative” = informative intentions.
a very small probability a small probability slightly probable evenly probable rather probable probable quite probable
Hearer FM Speaker FM Informative Verbal probability scale
Intentions Scenario Investment Scenario Car
Table 1: Effect of intentions on choice of the verbal probability expression overestimating, adequately estimating or under-estimating the communicated probability of 50%.
Hearer face-managing intentions % (n)
Speaker face-managing intentions % (n)
Informative
intentions % (n) Total % (n)
Investment scenario
Overestimate 35.3% (12) 29.4% (5) 31.0% (22) 32.0% (39)
Adequate estimate 38.2% (13) 23.5% (4) 63.4% (45) 50.8% (62)
Underestimate 26.5% (9) 47.1% (8) 5.6% (4) 17.2% (21)
Total 100% (34) 100% (17) 100% (71) 100% (122)
Car scenario
Overestimate 28.6% (10) 41.7% (10) 38.5% (25) 36.3% (45)
Adequate estimate 20.0% (7) 16.7% (4) 47.7% (31) 33.9% (42)
Underestimate 51.4% (18) 41.7% (10) 13.8% (9) 29.8% (37)
Total 100% (35) 100% (24) 100% (65) 100% (124)
Note. The verbal probability scale was recoded as follows: 1) underestimate: “a very small
50% probability (Table 1). In the Investment scenario, sub-jects selected verbal probabilities as a function of their inten-tions,χ2(4) = 21.95,p< .001, Cramer’sV= 0.30. Speakers
adopting hearer and speaker face-managing intentions con-veyed an underestimated probability more often than those adopting informative intentions, respectivelyχ2(2) = 10.80,
p = .004, Cramer’sV = 0.32 andχ2(2) = 21.18,p < .001,
Cramer’sV= 0.49. We found no difference between the two face-managing intentions,χ2(2) = 2.29,p= .424, Cramer’s
V = 0.21. In the Car scenario, subjects also selected ver-bal probabilities as a function of their intentions, χ2(4) =
20.77, p < .001, Cramer’s V = 0.29. Subjects adopting hearer face-managing intentions underestimated the proba-bility more often than those adopting informative intentions,
χ2(2) = 17.13,p< .001, Cramer’sV= 0.41. However,
sub-jects adopting speaker face-managing intentions in this sce-nario had a tendency to underestimate or overestimate the probability more often than those adopting different inten-tions,χ2(2) = 10.69,p= .005, Cramer’sV = 0.35. Again,
we found no difference between the two face-managing in-tentions,χ2(2) = 1.09,p= .648, Cramer’sV= 0.14.
We found similar effects of intentions on the individual-ized numerical translations of the selected verbal probability expressions in the Investment scenario,F(2,119) = 3.33,p= .039,µ2= .05, as well as in Car scenario,F(2,121) = 3.23,
p= .043,µ2= .05. In the Investment scenario, hearer
face-managing subjects as well as speaker face-face-managing sub-jects conveyed a lower probability (respectively,−7.3, 95%
CI [−15.8, 1.2], p= .093; −12.9, 95%CI [−23.9,−1.8],
p= .023) than those with informative intentions (M= 59.1, SD= 20.8). In the Car scenario, hearer face-managing sub-jects as well as speaker face-managing subsub-jects conveyed a lower probability (respectively, −12.0, 95% CI [−21.7,
−2.3], p = .016; −7.9, 95% CI [−19.0, 3.1], p = .159)
than those with informative intentions (M = 55.9, SD = 22.6). In a 2-level linear regression model with random in-tercept, subjects with face-managing intentions communi-cated a lower probability than informative speakers: inter-ceptb0= 57.3, 95%CI[52.9, 61.6],t(163.239) = 26.03,p< .001; hearer face-managing intentions slopeb1=−6.8, 95%
CI [−12.5, −1.0], t(191.142) = −2.32, p = .022, speaker
face-managing intentions slopeb2=−11.6, 95%CI[−18.9,
−4.3],t(205.787) =−3.14,p= .002.
Overall, all these analyses support the second hypothesis predicting that face-managing intentions would lead to the communication of a different probability than would infor-mative intentions.
3
Discussion
In agreement with the first postulate of politeness theory, we found that speakers intended to manage hearers’ faces from threatening news or to manage their own faces from being
wrong. In agreement with the second postulate derived from politeness theory, speakers communicated an altered (in the case of our scenarios, lower) outcome probability when they intended to be tactful or cautious than when they intended to be informative. Speakers conveyed on average a lower probability of occurrence for a negative outcome to manage hearers’ faces or to manage their own faces. Our data rep-resent the first direct and comprehensive empirical evidence supporting the two politeness theory postulates as applied to uncertainty communication.
Our study complements prior research showing that hear-ers believe that speakhear-ers soften bad news by hedging and downplaying their opinion with a vague uncertainty quan-tifier (e.g., Bonnefon & Villejoubert, 2006; Bonnefon et al., 2011; Juanchich et al., 2012). Our study demonstrates that speakers actually use verbal probabilities not only as probability information vehicles but also as face-managing devices oriented either toward the speaker or the hearer (Juanchich et al., 2012; Juanchich & Sirota, 2013). These three intentions seem to cover most of the intentions of sub-jects giving uncertain or bad news as very few subsub-jects re-ported another intention. Only a few instances of a “bet-ter safe than sorry” intention—in which speakers intention-ally exaggerated the probability magnitude of a negative outcome to encourage hearers to take preventive action— deviated systematically from the three intentions previously studied. To study this intention, along with the other inten-tions, in circumstances other than those investigated here, would be an exciting avenue for future research, since dif-ferent intentions may be at work in difdif-ferent circumstances. Our study further supports the conjectures of prior re-search postulating that personality traits, such as honesty, are associated with specific intentions such as a higher rate of informative intentions (Feeney & Bonnefon, 2013). We observed some intra-individual consistency in inten-tion selecinten-tion. For example, a person who adopted a face-managing intention to describe the probability of car break-down was more likely to adopt the same intention when describing the probability of losing a financial investment. Thus, these findings indirectly support the hypothesis that personality traits could account for differences in the adop-tion of speakers’ intenadop-tions.
ex-pertise status of speakers, between the two sets of studies could account for the gap, since speakers were experts in the “hearer” studies but not in the present study. Subjects may perceive experts to be worrying more about their own faces when making predictions and may assume, in turn, a higher rate of self-face-managing intentions. Neverthe-less, it is possible that psychological reasons, such as error in attribution processes, could also account for the gap (e.g., Epley & Dunning, 2000). Speakers could have attributed more altruistic motives to themselves than they actually had and/or hearers could have attributed to speakers more ego-tistical motives than they actually had; both misattributions would lead to lower rates of speakers’ face-managing inten-tions in our study compared to those in the “hearers” studies.
Although the observed effects appear to be robust— estimated from a sufficient sample size and from two differ-ent scenarios, some methodological issues could limit our conclusions. One could argue that the order of the proba-bility estimation question and the intention question could account for the intention’s effect. However, previous re-search on the effect of intentions weakens such a conclu-sion, since the effect of the perceived intention of speakers affected the perceived probability of hearers, whether the probability question was before or after the intention inter-pretation question (see Juanchich et al., 2012; Juanchich & Sirota, 2013). One could also argue that allowing subjects to choose only one intention instead of a combination of sev-eral different intentions might reflect very imprecisely the dynamic of speakers adopting intentions in real-life conver-sations. For example, people could intend to be both infor-mative and tactful at the same time. Future research should therefore consider a design that captures the relative im-pact of the intentions of speakers. However, our conclusions should not be restricted too much by this shortcoming, since our subjects had the opportunity to report a mixed-intention in the “other” category if they felt that choosing one or the other of the intentions did not sufficiently match their per-sonal intention. Finally, one could argue that our findings failed to indicate how peopleactuallycommunicate proba-bility in real life situations, since we have used fictitious sce-narios. Paradoxically, we argue the opposite: we expect that the intentions reported here would have a stronger effect in real life situations, because politeness concerns have a larger effect in real life than in hypothetical situations. For exam-ple, Woodzicka and LaFrance (2001) showed that women reported their intention to confront a person uttering a sex-ist comment in a hypothetical situation more often than they actually did in reality, probably because of people’s need to avoid threatening others by being confrontational. Similarly, Kawakami, Dunn, Karmali and Dovidio (2009) showed that people admitted to feeling upset by a racist comment in a hy-pothetical situation more than when they were actually con-fronted with a racist comment. Therefore, future research should test whether people in real life situations would opt
more for face-managing intentions and communicate even lower probability values than was the case in our fictitious scenarios.
The present findings bear wider theoretical and practi-cal implications. Although we have considered only ver-bal probabilities here, the focus on how speakers use face-managing strategies could be extended to a wider range of verbal and numerical quantifiers. Some research already ex-ists on these quantifiers but only from the standpoint of hear-ers (e.g., Bonnefon et al., 2011; Sirota & Juanchich, 2012b). Such an extension would strengthen the conclusion that a general politeness mechanism underlies some other effects embedded in communication contexts observed in the lit-erature, which have been traditionally attributed to purely mental cognitive processes. Progress in this area would be warranted for the understanding of human cognition in its complexity and would further advance theories of mental phenomena (e.g., see Bonnefon et al. 2009).
The practical implications of our study can be seen at dif-ferent levels. First, our study extends the currently prevail-ing audience-oriented research by providprevail-ing insights on the thought processes underpinning the ways speakers commu-nicate probabilities. Second, our study pinpoints a possi-ble speaker-hearer discrepancy in the proportion of inten-tions, because hearers believe speakers are more often self-oriented than speakers actually report. Finally, our study highlights the danger that probability misperceptions result from improper encoding or decoding of intentions in the risk communication process. Therefore, professional risk com-municators should consider both sides of the communica-tion equacommunica-tion: be aware of potential mismatch, and try to make their intentions as clear as possible to hearers (Sirota & Juanchich, 2012a).
Conclusion
References
Bonnefon, J.-F., & Villejoubert, G. (2006). Tactful, or doubtful? Expectations of politeness explain the severity bias in the interpretation of probability phrases.
Psycho-logical Science,17, 747–751. http://dx.doi.org/10.1111/
j.1467-9280.2006.01776.x.
Bonnefon, J.-F., Feeney, A., & De Neys, W. (2011). The risk of polite misunderstandings. Current Directions in
Psychological Science,20, 321–324. http://dx.doi.org/10.
1177/0963721411418472.
Bonnefon, J.-F., Feeney, A., & Villejoubert, G. (2009). When some is actually all: Scalar inferences in face-threatening contexts. Cognition, 112, 249–258. http:// dx.doi.org/10.1016/j.cognition.2009.05.005.
Brown, P., & Levinson, S. (1987).Politeness: Some
univer-sals in language usage.Cambridge, England: Cambridge
University Press.
Epley, N., & Dunning, D. (2000). Feeling “holier than thou”: Are self-serving assessments produced by errors in self- or social prediction?Journal of Personality and So-cial Psychology, 79, 861–875. http://dx.doi.org/10.1037/ 0022-3514.79.6.861.
Feenay, A., & Bonnefon, J.-F. (2013). Politeness and honesty contribute additively to the interpretation of scalar expressions. Journal of Language and Social
Psychology, 32, 181–190. http://dx.doi.org/10.1177/
0261927X12456840.
Grice, H. P. (1975). Logic and conversation. In P. Cole and J. L. Morgan (eds.) Syntax and Semantics, Vol. 3, New York: Academic Press, 41–58.
Feeney, A. & Bonnefon, J.-F. (2012). Politeness and honesty contribute additively to the interpretation of scalar expressions. Journal of Language and Social
Psychology, 32, 181–190. http://dx.doi.org/10.1177/
0261927X12456840.
Juanchich, M., & Sirota, M. (2013). Do people really say it is “likely” when they believe it is only “possible”? Effect of politeness on risk communication. Quarterly Journal of Experimental Psychology, 66, 1268–1275. http://dx. doi.org/10.1080/17470218.2013.804582.
Juanchich, M., Sirota, M., & Butler, C. L. (2012). Effect of the perceived functions of linguistic risk quantifiers on risk perception, severity and decision-making. Organi-zational Behaviour and Human Decision Processes, 118, 72–81. http://dx.doi.org/10.1016/j.obhdp.2012.01.002. Juanchich, M., Sirota, M., Karelitz, T., & Villejoubert, G.
(2013). Can membership-functions capture the direction-ality of verbal probabilities? Thinking & Reasoning, 19, 231–247.
Kampstra, P. (2008). Beanplot: A boxplot alternative for visual comparison of distributions. Journal of Statistical Software, 28, 1–9.
Kawakami, K., Dunn, E., Karmali, F., & Dovidio, J. F. (2009). Mispredicting affective and behavioral responses to racism. Science, 323, 276–278. http://dx.doi.org/10. 1126/science.1164951.
Pighin, S., & Bonnefon, J.-F. (2011). Facework and uncer-tain reasoning in health communication. Patient Educa-tion and Counseling, 85, 169–172. http://dx.doi.org/10. 1016/j.pec.2010.09.005.
R Core Team (2014). R: A language and environment for statistical computing. R Foundation for Statistical Com-puting, Vienna, Austria. http://www.R-project.org/. Sirota, M. & Juanchich, M. (2012a). Risk communication
on shaky ground.Science, 338, 1286–1287. http://dx.doi. org/10.1126/science.338.6112.1286.
Sirota, M., & Juanchich, M. (2012b). To what extent do politeness expectations shape risk perception? Even nu-merical probabilities are under the spell! Acta Psycho-logica, 141, 391–399. http://dx.doi.org/10.1016/j.actpsy. 2012.09.004.
Teigen, K. H., & Brun, W. (1999). The directionality of ver-bal probability expressions: Effects on decisions, predic-tions, and probabilistic reasoning.Organizational
Behav-ior and Human Decision Processes,80, 155–190. http://
dx.doi.org/10.1006/obhd.1999.2857.
Woodzicka, J. A., & LaFrance, M. (2001). Real versus imagined gender harassment. Journal of Social Issues, 57, 15–30. http://dx.doi.org/10.1111/0022-4537.00199.
Appendix: Scenarios, adapted from Juanchich and Sirota (2013)
Car: Imagine that a friend of yours has just bought a new used car without a warranty. He is explaining to you that he thinks he made a good deal. Your friend is showing you the car and you examine it while discussing. After a while he asks your opinion about the car. You think that there is a 50% probability that the car will break down in the next few months.
Select the statement you judge most appropriate to re-spond to your friend:
“Do you think the car will break down?” “I think that . . . ”
Investment: Imagine that a friend of yours has invested in the stock market all the savings he has accumulated over time. He is explaining to you that he may be a novice with such investments but that he thinks that the stocks he bought are very good. As he is nevertheless not completely confi-dent in the value of the stocks, he asks your opinion. You think that there is a 50% probability that the stock will lose their values.
Select the statement you judge most appropriate to re-spond to your friend: