MRI-Only Based Radiotherapy Treatment
Planning for the Rat Brain on a Small Animal
Radiation Research Platform (SARRP)
Shandra Gutierrez*, Benedicte Descamps, Christian Vanhove
Medical Image and Signal Processing Group, Ghent University-iMinds Medical IT department, Ghent, Belgium
Abstract
Computed tomography (CT) is the standard imaging modality in radiation therapy treatment planning (RTP). However, magnetic resonance (MR) imaging provides superior soft tissue contrast, increasing the precision of target volume selection. We present MR-only based RTP for a rat brain on a small animal radiation research platform (SARRP) using probabilis-tic voxel classification with multiple MR sequences. Six rat heads were imaged, each with one CT and five MR sequences. The MR sequences were: T1-weighted, T2-weighted, zero-echo time (ZTE), and two ultra-short echo time sequences with 20μs (UTE1) and 2 ms
(UTE2) echo times. CT data were manually segmented into air, soft tissue, and bone to obtain the RTP reference. Bias field corrected MR images were automatically segmented into the same tissue classes using a fuzzy c-means segmentation algorithm with multiple images as input. Similarities between segmented CT and automatic segmented MR (ASMR) images were evaluated using Dice coefficient. Three ASMR images with high simi-larity index were used for further RTP. Three beam arrangements were investigated. Dose distributions were compared by analysing dose volume histograms. The highest Dice coeffi-cients were obtained for the ZTE-UTE2 combination and for the T1-UTE1-T2 combination when ZTE was unavailable. Both combinations, along with UTE1-UTE2, often used to gen-erate ASMR images, were used for further RTP. Using 1 beam, MR based RTP underesti-mated the dose to be delivered to the target (range: 1.4%-7.6%). When more complex beam configurations were used, the calculated dose using the ZTE-UTE2 combination was the most accurate, with 0.7% deviation from CT, compared to 0.8% for T1-UTE1-T2 and 1.7% for UTE1-UTE2. The presented MR-only based workflow for RTP on a SARRP enables both accurate organ delineation and dose calculations using multiple MR
sequences. This method can be useful in longitudinal studies where CT’s cumulative radia-tion dose might contribute to the total dose.
OPEN ACCESS
Citation:Gutierrez S, Descamps B, Vanhove C (2015) MRI-Only Based Radiotherapy Treatment Planning for the Rat Brain on a Small Animal Radiation Research Platform (SARRP). PLoS ONE 10(12): e0143821. doi:10.1371/journal.pone.0143821
Editor:Heye Zhang, Shenzhen institutes of advanced technology, CHINA
Received:August 19, 2015
Accepted:November 10, 2015
Published:December 3, 2015
Copyright:© 2015 Gutierrez et al. This is an open access article distributed under the terms of the Creative Commons Attribution License, which permits unrestricted use, distribution, and reproduction in any medium, provided the original author and source are credited.
Data Availability Statement:All relevant data are within the paper.
Funding:This work is funded by iMinds and Ghent University. CV is supported by the GROUP-ID consortium of Ghent University. The funders had no role in study design, data collection and analysis, decision to publish, or preparation of the manuscript.
Introduction
Small animal models are widely used for the development of new cancer treatment strategies. The recently developed 3D conformal small animal micro-irradiators have significantly reduced the technological gap between laboratory radiation research and human treatment methods [1,2]. These devices are using kV X-ray sources that combine irradiation with high-resolution cone-beam (CB) computed tomography (CT) [3]. However, CB-CT is hampered by low soft-tissue contrast [4] making accurate target selection very difficult, especially in the rodent brain. In contrast, magnetic resonance (MR) images offer excellent soft-tissue contrast but they do not provide the required electron density information needed for dose calculation [5–8].
The aim of this study is to investigate the feasibility of an MR-only based workflow for rat brain radiotherapy treatment planning (RTP) on a small animal radiation research platform (SARRP) that enables both accurate target delineation and accurate dose calculations. There-fore, the MR volume needs to be segmented into a limited number of tissue classes. Electron density values have to be assigned to these classes to override their default MR signal intensity values. However, tissue segmentation in MR imaging is far from trivial. Conventional MR sequences provide no signal in lung and bone, due to the low proton densities and very short transverse relaxation times of these tissue types. As a result, there is no contrast between air, lung and bone. To solve this problem, novel MR sequences have been developed that acquire the MR signal directly after radio-frequency excitation, such as ultra-short echo time (UTE) and/or zero echo time (ZTE) sequences. The extra information provided by such sequences can be used to facilitate segmentation of the MR images [9–12]. To generate segmented MR images, we employ probabilistic classification of voxels using multi-sequence MR images [13]. To our knowledge, this is the first study that investigates the use of an MR-only based workflow in pre-clinical RTP and the first study that uses ZTE sequence for image segmentation.
Materials and Method
Animals
Six adult female Fisher rats (weight: 174±7g) were purchased from Charles River (Neder-over-Heembeek, Belgium). All animals were treated according to the European Ethics Committee (2010/63/EC). All experimental procedures were approved by the Animal Experimental Ethical Committee of Ghent University Hospital (ECD 12/28-A1). The animals were kept under environmentally controlled conditions (12h normal light/dark cycles, 20–23°C, 50% relative humidity) with food and water ad libitum. During the imaging experiment, animals were anes-thetized with 2% isoflurane mixed with medical oxygen (0.3L/min). To facilitate animal trans-port from one imaging device to another and to simplify image co-registration, rats were positioned on an in-house made multi-modality bed to maintain a fixed rat head position (Fig 1). After completion of the experiment the animals were euthanized with an overdose of pento-barbital (150mg/kg, i.p.).
MR Image Acquisition
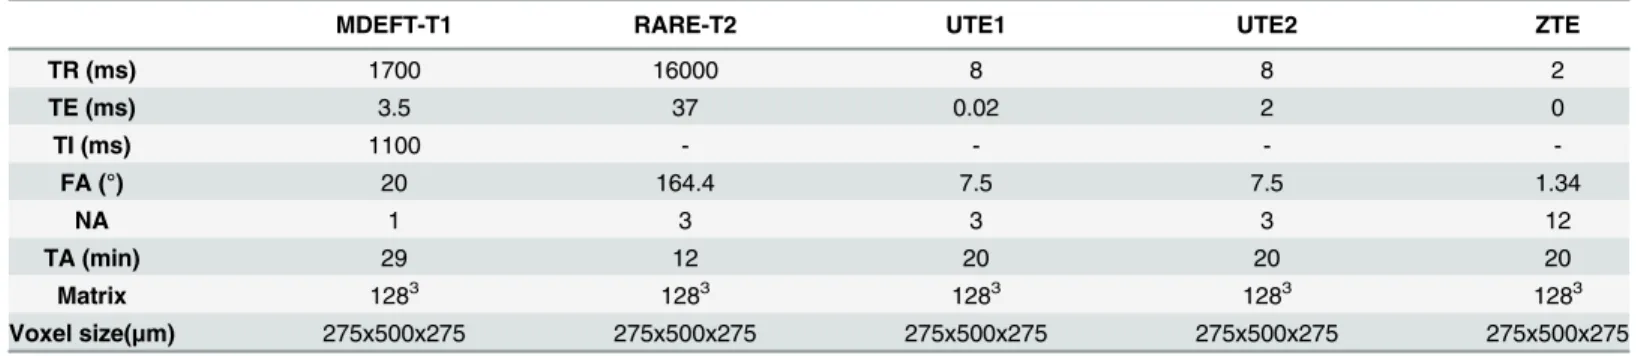
MR images of the rat head were acquired on a 7 Tesla system (Bruker PharmaScan 70/16, Ettlingen, Germany) using a 40 mm Bruker quadrature volume transmit/receive radiofre-quency coil. Five different MR sequences were acquired for each animal (Table 1). Anatomical images of the rat head were collected using a T1-weighted Modified Driven Equilibrium Fou-rier Transform (MDEFT) sequence and a T2-weighted Rapid Acquisition with Relaxation Enhancement (RARE) sequence. In addition to these structural images, three other MR
sequences were acquired, including an ultra-short echo time sequence with 20μs echo time (UTE1), an ultra-short echo time sequence with 2ms echo time (UTE2) and a zero echo time sequence (ZTE). UTE and ZTE offer the opportunity to acquire images from proton-poor structures with very short transverse relaxation times, such as bone, by using a rapid readout of the fast decaying signal. All MR images were acquired in coronal orientation.
Fig 1. Homemade multi-modality bed.a) our homemade bed, b) the rat position on the bed in front of the MR volume coil, c) the rat position on the bed in the SARRP.
doi:10.1371/journal.pone.0143821.g001
Table 1. Overview of the acquisition parameters used for the five MR sequences.
MDEFT-T1 RARE-T2 UTE1 UTE2 ZTE
TR (ms) 1700 16000 8 8 2
TE (ms) 3.5 37 0.02 2 0
TI (ms) 1100 - - -
-FA (°) 20 164.4 7.5 7.5 1.34
NA 1 3 3 3 12
TA (min) 29 12 20 20 20
Matrix 1283 1283 1283 1283 1283
Voxel size(μm) 275x500x275 275x500x275 275x500x275 275x500x275 275x500x275
TR: Repetition time, TE: Echo time, TI: Inversion time, FA: Flip angle, NA: Number of averages, TA: Total acquisition time.
Bias Field Correction
A bias field is a low frequency undesirable smooth signal that corrupts MR images due to inho-mogeneities in the scanner’s field strength. These low level variations degrade the performance of segmentation algorithms that use individual voxel gray level values. Consequently, a prepro-cessing step is required to correct for bias field effect before doing segmentation. Bias field cor-rection was done using a 3D extended version of Coherent Local Intensity Clustering (CLIC) algorithm presented by Li et al [14]. In this retrospective algorithm bias field correction and tis-sue classification are interleaved to benefit from each other, thereby allowing both to be refined iteratively until convergence to an optimal solution. In this study only the estimated bias field was used to correct for the MR inhomogeneities.
CT Image acquisition
Following MR image acquisition, the animals were moved to a Small Animal Radiation Research Platform (SARRP) (XStrahl, Surrey, UK) using the in-house made multi-modality bed to maintain a fixed rat head position. A CB-CT was acquired with the following parame-ters: 70kVp, 1mA, 720 projections, 360° rotation and 1mm aluminum filtration resulting in 127s total acquisition time. The acquired CB-CT projection data were reconstructed using a modified Feldkamp reconstruction algorithm into a 411x251x411 matrix with 275μm voxel size. InFig 2, coronal slices through the head of one of the rats are shown using the six different image acquisitions.
Image Co-registration
All CB-CT images were first co-registered using 3D Slicer version 3.6.3 (http://www.slicer.org) by rigid body transformations using normalized mutual information. Then, the T1-weighted images of each animal were resampled and manually co-registered, using anatomical land-marks, to the CB-CT by rigid body transformations, which is sufficient because the rat head was fixed using a multi-modality bed. Next, the other MR images were resampled and co-regis-tered to the CB-CT using the same transformation parameters used to co-register the
T1-weighted images to the CB-CT. Finally, all images were cropped to obtain the same matrix size for each image.
Image Segmentation
CB-CTs were manually segmented into three tissue classes (air, soft tissue and bone) in accor-dance with the standard method on the SARRP for brain tumors. These segmented CB-CT images were used as a reference for further dose calculations using the treatment planning soft-ware (TPS) on the SARRP (3D Slicer Version 3.6.3). MR images were automatically segmented in the same three tissue classes using a modified version of fuzzy c-means segmentation (FCM) algorithm [15], written in MATLAB version R2011b (MathWorks, Natick, MA). FCM is a data clustering technique in which a dataset X = {x1. . .xn} is grouped into c clusters C = {c1. . .cn} by
minimizing the following objective function:
Q¼X
n
i¼1
Xc
j¼1
um
ijkxi cjk 2
Here, || || is the norm expressing the similarity between measured data and cluster. uijthe
membership probability of data point xito belong to cluster cj, with the constraint that
Xc
j¼1uij¼1. m is the fuzzification coefficient and is commonly set to 2. To obtain an
automatic segmented MR (ASMR) image, voxels were assigned to the tissue class having the highest membership probability. All possible combinations of thefive MR images were used as input to the FCM algorithm, with the input image number ranging from one tofive. The order of the input images was not relevant, therefore, 31 different ASMR images were obtained. Finally, air masks were generated based on the T1-weighted images to eliminate artifacts out-side the rat head.
Similarity Index
Similarity between segmented CB-CT and ASMR images was evaluated using the 3D Dice coef-ficient [16]:
D¼2jCTt\MRtj jCTtj þ jMRtj
where CTt and MRt represents the voxels classified as tissue class t in segmented CB-CT and ASMR images, respectively. Dice coefficients can be between 0 and 1, with 1 indicating identi-cal segmentation for tissue class t. It was identi-calculated for bone and soft tissue independently because both tissue types are essential for RTP. The average of both Dice coefficients was calcu-lated as thefinal measure for similarity. ASMR images with high similarity index is used for further RTP, together with the UTE1-UTE2 combination that has already been investigated as a method to generate CT information from MR images [9,12].
Radiation Therapy Treatment Planning
Manually segmented CB-CT, ASMR, T1- and T2-weighted MR images were imported into the TPS of the SARRP. The target for RTP was selected in the primary motor cortex (M1) using the T1- and T2-weighted images. Three different beam arrangements were investigated to compare CB-CT and MR-based dose calculations. Dose plans were calculated to deliver 15Gy to the target using: (1) a single static beam of 3x3 mm, (2) a single coplanar arc (3x3 mm beam size, 120° arc, couch at 0°), and (3) three non-coplanar arcs (3x3 mm beam size, 120° arc, couch at 0°, 45°, and 90°). For each animal, dose distributions were calculated using the TPS of Fig 2. Illustration of a CB-CT and five MR images of the same animal.a) Coronal CB-CT image and (b)-(f) biased field corrected and masked coronal MR images using a T1-weighted (b), T2-weighted (c), ZTE (d), UTE1 (e) and UTE2 (f) sequence.
the SARRP and cumulative dose volume histograms (DVHs) of the target were obtained for the three different beam arrangements using CB-CT and MR-based dose calculations. The tar-get volume was defined as a spherical volume-of-interest around the tartar-get with a diameter of 2.5mm. D5, D50and D90were calculated for the different dose plans, where Dxstands for the
dose received by x % of the volume.
Statistical Analysis
Statistical analysis of D5, D50and D90of CB-CT and MR-based dose calculation was performed
using the Mann-Whitney U test. A probability value p<0.05 was considered statistically significant.
Results
Fig 3shows the similarity between segmented CB-CT and 31 ASMR images obtained by using the 31 possible combinations of the five MR sequences as inputs to the FCM algorithm. The highest Dice coefficient was obtained for the ZTE-UTE2 combination with a value of 0.617 ±0.013. The highest Dice coefficient for a combination without ZTE was obtained for the T1-UTE1-T2 combination with a value of 0.608±0.019. The average Dice coefficient obtained for the UTE1-UTE2 combination was 0.601±0.013. These three combinations are used for fur-ther RTP.Fig 4shows the result of image segmentation into three tissue classes using CB-CT images and the three MR combinations that will be used for further RTP.
The lowest Dice coefficients were obtained when only one MR image was used as an input to the FCM algorithm and for combinations that did not include a UTE1 and/or ZTE sequence.
Fig 5displays the DVHs, averaged over the six animals, for CB-CT and MR-based dose cal-culations in the target volume. Results are shown for the three different beam arrangements.
The D5, D50and D90values normalized to the CB-CT are shown inTable 2. In case of
the 1-beam configuration, a significant lower dose was delivered to the target when the T1-UTE1-T2 combination was used to generate ASMR images for dose calculations. When 1 arc or 3 arcs were used, a significant higher dose was delivered to the target volume when the UTE1-UTE2 combination was used to generate ASMR images for dose calculations. For the three different beam configurations, no significant difference was observed between dose calcu-lations based on the ZTE-UTE1 combination and CB-CT.
Fig 3. Average Dice coefficient results.Average Dice coefficient for bone and soft tissue segmentation of 31 different combinations of MR-sequences using the CB-CT as a reference.
doi:10.1371/journal.pone.0143821.g003
Discussion
To achieve accurate target volume image guided irradiation, SARRP’s onboard CB-CT guid-ance is insufficient for the rodent brain because brain tumors will be hardly visible due to the inappropriate soft tissue contrast [6]. The use of contrast CT imaging might offer higher accu-racy. However, in the case of brain tumors only late-stage or high-grade tumors might be visu-alized and there is a significant concern that a high atomic number contrast agent may produce errors in the dose calculation. Consequently, MR-guided radiotherapy is an attractive alterna-tive that allows better target delineation. However, MR images cannot be used for dose plan-ning, as they do not provide the required electron density information.
Therefore, a segmentation method based on the FCM algorithm, with multiple MR sequences as inputs, has been presented and evaluated in the rat brain. The ASMR images presented were Fig 4. Segmented images into three tissue classes.Manually segmented CB-CT and ASMR images into three tissue classes (air = black, soft
tissue = gray and bone = white). Top: Transaxial slice through the rat brain on CB-CT (a), UTE1-UTE2 (b), T1-UTE1-T2(c) and ZTE-UTE2 (d). Bottom: Sagittal slice trough the brain on CBCT (e), UTE1-UTE2 (f), T1-UTE1-T2 (g) and ZTE-UTE2 (h).
doi:10.1371/journal.pone.0143821.g004
Fig 5. DVHs calculated in the target volume.CB-CT (gray), ZTE-UTE2 (red), UTE1-UTE2 (green) and T1-UTE1-T2 (blue) based dose calculation using (a) 1 beam, (b) 1 co-planar arc and (c) 3 non-coplanar arcs.
doi:10.1371/journal.pone.0143821.g005
Table 2. D5, D50and D90values, in the target volume, normalized to the CB-CT reference for the three MR based dose calculations and for three dif-ferent beam configurations.
ZTE-UTE1 based dose calculations T1-UTE1-T2 based dose calculations UTE1-UTE2 based dose calculations
1 beam 0.972±0.064 0.924±0.076* 0.986±0.061
1 arc 1.006±0.008 1.000±0.006 1.010±0.005*
3 arcs 1.007±0.008 1.008±0.013 1.017±0.012*
Results are shown as mean±sd. Values that are significantly different from the CB-CT reference are marked with an asterisk.
sufficiently similar to the manually segmented CB-CT images that are routinely used in small animal image guidance and RTP [1,2]. The Dice coefficient was used to measure the similarity between CB-CT and ASMR images.
This study confirms the importance of acquiring multiple MR images for accurate dose cal-culations. The lowest Dice coefficients were obtained when only one MR image was used as an input to the FCM algorithm. Higher Dice coefficients were obtained when an MR-sequence that presents higher signal intensities from bone, such as UTE and ZTE, was combined with a conventional MR-sequence. This observation is consistent with recent findings from Hsu et al. [13]. However, the method presented here differs in that it includes the ZTE sequence and it implements an MR-only based workflow for pre-clinical RTP instead of clinical treatment planning.
We observed that MR combinations, including the ZTE sequence, resulted in the highest Dice coefficients. The ZTE sequence, due to its zero echo time, offers higher signal intensities from bone than UTE images. Thus it allows a better differentiation between air and bone.
When dose distributions were calculated using the ASMR images, DVHs indicated small differences with CB-CT based dose calculations. Using only one beam, MR based RTP tends to underestimate the dose to be delivered to the target (range: 1.4%-7.6%). The front part of rat skull (rostrum) is a pretty complex structure that is challenging to segment correctly using MR images. Consequently, when only 1 beam is directed through the front part of skull to reach the brain, the MR based dose calculation might become less accurate. If multiple beams are used that are directed into multiple directions, this possible inaccuracy will be less pronounced. In multiple beam configurations the smallest differences to CB-CT based dose calculations were obtained using the ZTE-UTE2 and T1-UTE1-T2 combinations. The UTE1-UTE2 combination overestimated the delivered dose (range: 1.7%) that is most likely explained because parts of the rat head air cavities and the eyes can be misclassified as bone.
This study has primarily been concerned with the accuracy of MR-based dose calculations for RTP in small animal radiation research; however, total scanning length might become an issue related to animal anesthesia and to provide high throughput. The scan duration of a high-quality ZTE-UTE2 sequence is in the order of 40 minutes. Therefore, total MR scan time reduction should be further investigated to be able to implement it in a daily protocol. CB-CT acquisitions are generally much faster and less expensive than MR. However, one of the most challenging aspects of CB-CT imaging relates to the radiation dose received by the animals. Measurements have shown typical radiation doses in the range of 10–50 cGy for a single CB-CT [17]. The dose at which 50% of mice die within 30 days (LD50/30) is roughly 5 Gy, so a single CB-CT can represent as much as 10% of the LD50/30. This might become very impor-tant when delivering the therapeutic dose in multiple fractions spaced over time using CB-CT guided RTP.
Study Limitations
Our study was limited to the rat brain and an in-house made multi-modality bed was sufficient to simplify the co-registration of CBCT and MR images to rigid body transformations. How-ever, further research is needed before translating these results to other parts of the body. In the rat brain, segmentation into three tissue classes might be sufficient to allow accurate dose calculations. However, more tissue classes will be necessary to provide accurate dose calcula-tions in the thoracic or abdominal region of small animals [18,19].
Furthermore, the proposed MR-only based workflow still uses CB-CT for animal position-ing. In case of an MR-only based workflow a solution should be found to ensure a common coordinate system between MR image space and SARRP irradiation space, which is a
trivial issue. Possible solutions are the use of digitally reconstructed radiographs extracted from the MR images, using ultra-fast low-dose CB-CT images to perform CB-CT/MR co-registra-tion or the integraco-registra-tion of an optical system in combinaco-registra-tion with a robust animal fixaco-registra-tion system.
Conclusion
We presented an MR-only based workflow for rat brain radiotherapy treatment planning on a small animal radiation research platform that enables both accurate organ delineation and accurate dose calculations using multiple MR images. We have demonstrated that MR-based dose calculations can be improved by including the ZTE sequence.
Acknowledgments
We would like to thank Dr. Mercedes Carón for her statistical support.
Author Contributions
Conceived and designed the experiments: SG BD CV. Performed the experiments: SG BD CV. Analyzed the data: SG CV. Contributed reagents/materials/analysis tools: SG. Wrote the paper: SG BD CV.
References
1. Verhaegen F, Granton P, Tryggestad E. Small animal radiotherapy research platforms. Phys Med Biol. 2011; 56:R55–R83. doi:10.1088/0031-9155/56/12/R01PMID:21617291
2. Vanhoof SJ, Granton PV, Verhaegen F. Development and validation of a treatment planning system for small animal radiotherapy: SmART-Plan. 2013;361–66.
3. Aird E, Conway J. CT Simulation for radiotherapy treatment planning. Br J Radiol. 2002; 75:937–49. PMID:12515702
4. Siewerdsen JH, Moseley DJ, Bakhtiar B, Richard S, Jaffray DA. The influence of antiscatter grids on soft-tissue detectability in cone-beam computed tomography with flat-panel detectors. Med Phys. 2004; 31:3506–20. PMID:15651634
5. Fiorentino A, Caivano R, Pedicini P, Fusco V. Clinical target volume definition for glioblastoma radio-therapy planning: magnetic resonance imaging and computed tomography. Clin Transl Oncol. 2013;754–58. doi:10.1007/s12094-012-0992-yPMID:23359180
6. Bolcaen J, Descamps B, Deblaere K, Boterberg T, Hallaert G, Van den Broecke C et al. MRI-guided 3D conformal arc micro-irradiator of a F98 glioblastoma rat model using the Small Animal Radiation Research Platform (SARRP). J Neuroonc. 2014; PMID:25069566
7. Figueroa SD, Winkelmann CT, Miller HW, Volkert WA, Hoffman TJ. TLD assessment of mouse dosime-try during microCT imaging TLD assessment of mouse dosimedosime-try during microCT imaging. Med Phys. 2008;3866–74. PMID:18841837
8. Shukla D, Huilgol NG, Trivedi N, Mekala C. T2 weighted MRI in assessment of volume changes during radiotherapy of high grade gliomas. J Cancer Res Ther. 2005;235–38. PMID:17998661
9. Keereman V, Fierens Y, Broux T, De Deene Y, Lonneux M, Vandenberghe S. MRI-Based Attenuation Correction for PET/MRI Using Ultrashort Echo Time Sequences. J Nucl Med. 2010; 51:812–8. doi:10. 2967/jnumed.109.065425PMID:20439508
10. Johansson A, Garpebring A, Karlsson M, Asklund T, Nyholm T. Improved quality of computed tomogra-phy substitute derived from magnetic resonance (MR) data by incorporation of spatial information-potential application for MR-only radiotherapy and attenuation correction in positron emission tomogra-phy. Acta Oncol. 2013;1369–73. doi:10.3109/0284186X.2013.819119PMID:23984810
11. Eilertsen K, Vestad LN, Geier O, Skretting A. A simulation of MRI based dose calculations on the basis of radiotherapy planning CT images. Acta Oncol. 2008; 1294–302. doi:10.1080/02841860802256426
PMID:18663645
13. Hsu SH, Cao Y, Huang K, Feng M, Balter JM. Investigation of a method for generating synthetic CT models from MRI scans of the head and neck for radiation therapy. Med Phys. 2013; 58:8419–8435. 14. Li C, Xu C, Anderson AW, Gore JC. MRI tissue classification and bias field estimation based on
coher-ent local intensity clustering: a unified energy minimization framework. Inf Process Med Imaging. 2009; 21:288–99. PMID:19694271
15. Bezdek JC. Pattern Recognition with Fuzzy Objective Function Algorithms. Kluwer Academic Publish-ers Norwell, MA, USA 1981. ISBN:0306406713.
16. Sørensen T. A method of establishing groups of equal amplitude in plant sociology based on similarity of species and its application to analyses of the vegetation on Danish commons. Kongelige Danske Videnskabernes Selskab. 1948;1–34.
17. Cherry SR. In vivo molecular and genomic imaging: new challenges for imaging physics. Phys Med Biol 2004: 49:R13–R48. PMID:15012005
18. Bazalova M, Graves EE. The importance of tissue segmentation for dose calculations for kilovoltage radiation therapy. Med Phys 2011; 38:3039–3049. PMID:21815377
19. Verhaegen F, van Hoof S, Granton PV, Trani D. A review of treatment planning for precision image-guided photon beam pre-clinical animal radiation studies. Z Med Phys 2014; 24:323–334. doi:10.1016/ j.zemedi.2014.02.004PMID:24629309