INTERNATIONAL RESEARCH JOURNAL OF PHARMACY
www.irjponline.com
ISSN 2230 – 8407
Research Article
DEVELOPMENT AND VALIDATION OF SPECTROPHOTOMETRIC METHOD FOR
SIMULTANEOUS ESTIMATION OF AMLODIPINE BESYLATE AND INDAPAMIDE IN
TABLET DOSAGE FORM
Raj Manish C.*, Chaudhari Bharat G
Department of Quality Assurance, S. K. Patel College of Pharmaceutical Education and Research, Ganpat University, Ganpat Vidyanagar, Mehsana, Gujarat, India
Article Received on: 10/02/12 Revised on: 30/03/12 Approved for publication: 21/04/12
*E-mail: manish21288@gmail.com
ABSTRACT
The present manuscript describes simple, sensitive, rapid, accurate, precise and economical spectrophotometric method based on Simultaneous equations method for simultaneous determination of amlodipine besylate and indapamide in combined tablet dosage form. The spectrophotometric method is based on Simultaneous equations for analysis of both drugs using methanol as solvent. Amlodipine besylate has absorbance maxima at 360 nm and Indapamide has absorbance maxima at 287 nm in methanol. The two drugs follow Beer-Lambert’s law over the concentration range of 10-60 µg/ml for AMLO and 5-30 μg/ml for INDA. The concentrations of the drugs were determined by using Simultaneous equations. The mean recovery was 99.86 ± 0.33 and 100.03 ± 1.02 for Amlodipine besylate and Indapamide, respectively. The method was found to be simple, sensitive, accurate and precise and was applicable for the simultaneous determination of Amlodipine besylate and Indapamide in pharmaceutical tablet dosage form. The results of analysis have been validated statistically and by recovery studies.
Keywords: Recovery, Amlodipine besylate, Indapamide, Simultaneous equations, validation.
INTRODUCTION
Amlodipine besylate (AMLO) is chemically 3-ethyl 5-methyl
(4RS)-2-[(2 aminoethoxy)methyl]-4-(2-chlorophenyl)
6-methyl-1,4 dihydropyridine-3,5-dicarboxylate
benzenesulphonate8 (Figure 1), is a Calcium channel blocker,
used in the treatment of hypertension9. It is official in IP, BP and USP. IP1, BP3 and USP2 describe HPLC method for its estimation. Literature survey reveals UV spectrophotometry4, RP-HPLC5, spectrophotometric6 method for simultaneous determination of AMLO with other drug and RP-HPLC7 method for simultaneous determination of AMLO with other drug methods for determination of AMLO in pharmaceutical dosage forms as well as in biological fluids. Indapamide (INDA) is chemically 4-Chloro-N-[(2RS
)-2-methyl-2,3-dihydro-1H-indol-1-yl]-3-sulphamoylbenzamide18 (Figure 2),
is a Thiazide diuretics for the treatment of hypertension19. Indapamide is official in IP10, BP12 and USP11. IP, BP, and USP describe HPLC method for its estimation. Literature survey reveals LC-MS13, spectrophotometric14 and HPLC15 method for simultaneous estimation of INDA in whole human blood, RP-HPLC16 method for simultaneous estimation of INDA, LC-ESI-MS17 methods for the determination of INDA in human plasma. This combination is not official in any pharmacopoeia hence official and reported methods of analysis are not available for this combination. The present manuscript describes simple, sensitive, accurate, precise, rapid and economic First derivative spectrophotometric method for simultaneous estimation of AMLO and INDA in tablet dosage form.
MATERIALS AND METHODS Apparatus
A shimdzu model 1700 (Japan) double beam UV/Visible spectrophotometer with spectral width of 2 nm, wavelength accuracy of 0.5 nm and a pair of 10 mm matched quartz cell was used to measure absorbance of all the solutions. Spectra were automatically obtained by UV-Probe system software (UV Probe version 2.10). A Sartorius CP224S analytical
balance (Gottingen, Germany), an ultrasonic bath (Frontline FS 4, Mumbai, India) was used in the study.
Reagents and Materials
AMLO and INDA bulk powder was kindly gifted by Torrent Research Centre, Ahmedabad, India. The commercial fixed dose combination product was procured from Serdia Pharmaceuticals (INDIA) pvt ltd. Methanol AR grade was procured from S. D. Fine Chemicals Ltd., Mumbai, India and and Whatman filter paper no. 41 (Millipore, USA) were used in the study.
Preparation of standard stock solutions
An accurately weighed quantity of AMLO (10 mg) and INDA (10 mg) were transferred to a separate 100 ml volumetric flask and dissolved and diluted to the mark with methanol to obtain standard solution having concentration of AMLO (100 μg/ml) and INDA (100 μg/ml).
Preparation of sample solution
Twenty tablets were weighed and powdered. The powder equivalent to 5 mg of AMLO and 1.5 mg of INDA transferred to 50 ml volumetric flask. Methanol (25 ml) was added to it and sonicated for 20 min, and volume was made up to the mark with methanol. The solution was filtered through Whatman filter paper no. 41 and filtrate was suitably diluted with methanol to achieve a final concentration of 20 μg/ml of AMLO and 10 µg/ml of INDA. The absorbance of final solution was recorded at selected wavelengths for determination of AMLO and INDA. The analysis procedure was repeated three times with tablet formulation.
Methodology
were plotted at these wavelengths. The absorptivity coefficients of these two drugs were determined using calibration curve equations. The concentration of AMLO and INDA in sample solution was determined by solving the respective simultaneous equations21 generated by using absorptivity coefficients and absorbance values of AMLO and INDA at these wavelengths.
Validation of The proposed method
The proposed method was validated according to the International Conference on Harmonization (ICH) guidelines20.
Linearity (Calibration curve)
The calibration curves were plotted over a concentration range of 10-60 μg/ml for AMLO and 5-30 μg/ml for INDA. Accurately measured standard solutions of AMLO (1.0, 2.0, 3.0, 4.0, 5.0 and 6.0 ml) and INDA (0.5, 1.0, 1.5, 2.0, 2.5, and 3.0 ml) were transferred to a series of 10 ml of volumetric flasks and diluted to the mark with methanol. The absorbances of the solutions were measured at 360 nm and 287 nm against methanol as blank. The calibration curves were constructed by plotting absorbances versus concentrations and the regression equations were calculated (Figure 4, 5 and 6).
Method precision (repeatability)
The precision of the instrument was checked by repeated scanning and measurement of the absorbances of solutions (n=6) of AMLO (20 µg/ml) and INDA (15 μg/ml) without changing the parameters of the proposed spectrophotometric method.
Intermediate precision (reproducibility)
The intraday and interday precisions of the proposed method was determined by estimating the corresponding responses 3 times on the same day and on 3 different days over a period of one week for 3 different concentrations of standard solutions of AMLO (20, 30 and 40 µg/ml) and INDA (10, 15 and 20 μg/ml). The results were reported in terms of relative standard deviation (% RSD).
Accuracy (recovery study)
The accuracy of the method was determined by calculating the recoveries of AMLO and INDA by the standard addition method. Known amounts of standard solutions of AMLO and INDA were at added at 50, 100 and 150 % level to prequantified sample solutions of AMLO (20 µg/ml) and INDA (10 μg/ml). The amounts of AMLO and INDA were estimated by applying obtained values to the respective regression line equations.
Limit of detection and Limit of quantification
The limit of detection (LOD) and the limit of quantification (LOQ) of the drug were derived by calculating the signal-to-noise ratio (S/N, i.e., 3.3 for LOD and 10 for LOQ) using the following equations designated by International Conference on Harmonization (ICH) guidelines.
LOD = 3.3 × σ/S LOQ = 10 × σ/S
Where, σ = the standard deviation of the response and S = slope of the calibration curve.
Analysis of AMLO and AMLO in combined tablet dosage form
Twenty tablets were weighed and the average weight was calculated. The tablet powder equivalent to 10 mg of AMLO and 10 mg of INDA were accurately weighed and transferred to 100 ml volumetric flask. Methanol (50 ml) was added and sonicated for 20 min. The volume is adjusted up to the mark with methanol. The solution was then filtered through
diluted with methanol to get a final concentration of 33 μg/ml of AMLO and 10 μg/ml of INDA. The absorbances of the tablet sample i.e. A1 and A2 were recorded at 360 nm and 287 nm and ratios of absorbance were calculated, i.e. A2/A1. Relative concentration of two drugs in the sample solution was calculated using respective simultaneous equations generated by using absorptivity coefficients and absorbance values of AMLO and INDA at these wavelengths.
RESULTS AND DISCUSSION
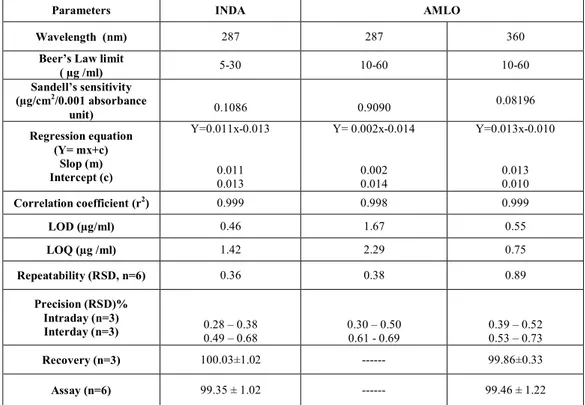
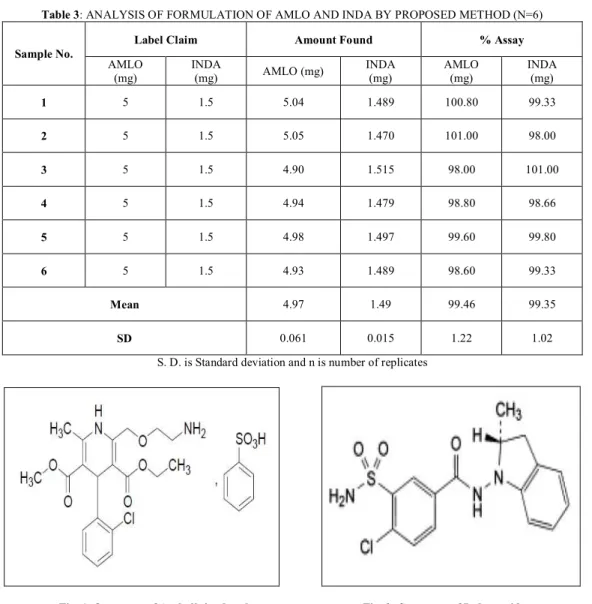
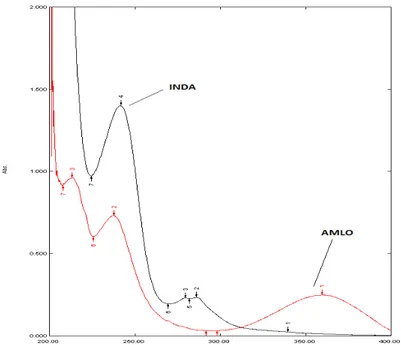
In this method, two wavelengths were used for the analysis of the drugs, 360 nm (λmax of AMLO and 287 nm (λmax of INDA) are the wavelengths at which calibration curves were prepared for both the drugs. The criteria for obtaining maximum precision21 by this method were calculated and found to be out side the range 0.1 - 2. Once the absorptivity values are determined very little time is required for analysis, as would require determination of absorbances of the sample solution at two selected wavelengths and few simple calculations. The standard solutions of AMLO and INDA were scanned separately in the UV range, and zero order spectra for AMLO and INDA (Figure 3) were recorded. Maximum absorbance was obtained at 360 nm and 287 nm for AMLO and INDA respectively. These two wavelengths were employed for the determination of AMLO and INDA without any interference from the other drug in their combined formulations. Linear correlation was obtained between absorbance and concentrations of AMLO in concentration range 10-60 µg/ml and INDA in concentration range of 5-30 μg/ml. The linearity of the calibration curve was validated by the high values of correlation coefficient of regression. The RSD values of AMLO were found to be 0.89 % and 0.38 % at 360 and 287 nm, respectively. The RSD value of INDA was found to be 0.36 % at 287nm. Relative standard deviation was less than 2 %, which indicates that proposed method is repeatable. The low RSD values of interday (0.53 – 0.73 % and 0.61 – 0.69 % for AMLO at 360 and 287nm respectively and 0.49 – 0.68 % for INDA at 287 nm) and intraday (0.39 – 0.52 % and 0.30 – 0.50 % for AMLO at 360 and 287 nm respectively and 0.28 – 0.38 % for INDA at 287 nm) variation for AMLO and INDA reveal that the proposed method is precise. LOD and LOQ values for AMLO were found to be 0.55 and 0.75 μg/ml and 1.67 and 2.29 μg/ml at 360 and 287 nm respectively. LOD and LOQ values for INDA were found to be 0.46 and 1.42 μg/ml at 287 nm. These data show that method is sensitive for the determination of AMLO and INDA. All the regression analysis data and summary of validation parameters for the proposed method is reported in Table 1. The recovery experiment was performed by the standard addition method. The mean recoveries were 99.86 ± 0.33 and 100.03 ± 1.02 for AMLO and INDA respectively indicates accuracy of the proposed method (Table 2). The proposed validated method was successfully applied to determine AMLO and INDA in their combined dosage form. The results obtained for AMLO and INDA were comparable with the corresponding labeled amounts (Table 3). No interference of the excipients with the absorbance of interest appeared; hence the proposed method is applicable for the routine simultaneous estimation of AMLO and INDA in pharmaceutical tablet dosage forms.
CONCLUSION
determination of AMLO and INDA. The observations and results obtained from this study including linearity, accuracy and precision (method precision as repeatability and intermediate precision as intra and inter day precision) are lie well within acceptable results. From the experimental studies it can be concluded that proposed method is sensitive, accurate and precise and can be adopted for the routine analysis of both drugs in tablet without interference of excipients.
ACKNOWLEDGEMENT
The authors are thankful to Torrent Research Centre, Ahmedabad, India for providing gift sample of AMLO and INDA for research. The authors are highly thankful to Shree S. K. Patel College of Pharmaceutical Education & Research, Ganpat University, Ganpat Vidyanagar, Mehsana, Gujarat, India for providing all the facilities to carry out the work.
REFERENCES
1. Indian Pharmacopeia, Vol. II. The Controller Publication, Govt of India. New Delhi; 2010. p. 714.
2. The United State Pharmacopoeia, USP28-NF23, United State Pharmacopoeial Convention, Inc., Rockville MD; 2009. p. 1532. 3. British Pharmacopoeia, Vol I. The British Pharmacopoeia Commission,
London; 2010. P. 139.
4. Patil PR and Rakesh SU. Simultaneous Estimation of Ramipril and Amlodipine By UV Spectrophotometric Method. Research Journal of Pharmacy and Technology 2009; 2(2): 304-307.
5. Prajapati J, Patel A and Patel MB. Analytical Method Development and Validation of Amlodipine Besylate and Perindopril Erbumine in combine dosage form by RP-HPLC. International Journal of Pharmatech Research 2011; 3 (2): 801-808.
6. Chaudhari BG and Patel AB. Simultaneous Spectrophotometric Estimation of Atorvastatin Calcium and Amlodipine Besylate in Tablet dosage forms. International Journal of Chemtech Research 2010; 2 (1): 633-639.
7. Mohammdi A, Rezaour N and Hashem M. A stability-indicating high performance liquid chromatography (HPLC) assay for the simultaneous
determination of Atorvastatin and Amlodipine in commercial tablets. Journal of Chromatography B 2007; 846: 215-221.
8. Maryadele JO Neil. The Merck Index: An Encyclopedia of chemicals, drugs and biologicals. 14th ed. Merck Research Laboratories, Merck and Co., Inc, Whitehouse station, New Jersey; 2006. p. 491.
9. Sweetman SC. Martindale: The Complete Drug Reference. 35th ed, London, UK; Pharmaceutical Press; 2007. p. 1089.
10. Indian Pharmacopeia, Vol. II. The Controller Publication, Govt of India. New Delhi; 2010. p. 1489.
11. The United State Pharmacopoeia, USP28-NF23. United State Pharmacopoeial Convention, Inc., Rockville MD; 2009. p. 2623. 12. British Pharmacopoeia, Vol I. The British Pharmacopoeia Commission,
London; 2010. p. 1099.
13. Jain DS, Subbaiah G, Sanyal M, Pande UC and Shrivastav P. Liquid Chromatography – Tandom Mass Spectrometry Validated Method for Estimation of Indapamide in Human Whole Blood. Journal of Chromatography B 2006; 834(1-2): 149 -54.
14. Pawar PV, Gaikwad PD and Bankar VH. Development and Validation of UV-Spectrophotometric Method for the Simultaneous estimation of Atenolol and Indapamide in Bulk and Tablet dosage form. International Journal of Pharmacy and Technology 2010; 2(4): 876-885.
A. Radi. Stripping Voltammetric Determination of Indapamide in Serum at Castor Oil – Based Carbon Paste Electrodes. Journal of Pharm Biomed Analysis 2001; 24 (3): 413-419.
15. Miller RB, Dadgar D and Lalande M. High – performance Liquid Chromatographic Method for Determination of Indapamide in Human Whole Blood. Journal of Chromatography B 1993; 614 (2): 293-308. 16. Ding L, Yang L, Liu F, Ju W, Xiong N. A sensitive LC-ESI-MS Method
for the Determination of Indapamide in Human Plasma: Method and Clinical Application Journal of Pharm Biomed Anal 2006; 42 (2): 213-219.
17. Maryadele JO Neil. The Merck Index: An Encyclopedia of chemicals, drugs and biologicals. 14th ed. Merck Research Laboratories, Merck and Co., Inc, Whitehouse station, New Jersey; 2006. p. 4960.
18. S. C. Sweetman. Martindale: The Complete Drug Reference. 35th ed., London, UK; Pharmaceutical Press; 2007. p. 1180.
19. ICH, Q2 (R1) Validation of Analytical Procedures. Text and Methodology, International Conference on Harmonization; 2005. 20. Beckett AH and Stenlake JB. Practical Pharmaceutical Chemistry, 14th
Edition, CBS Publishers and distributors;1997; p. 275-337.
Table 1: REGRESSION ANALYSIS DATA AND SUMMARY OF VALIDATION PARAMETERS FOR THE PROPOSED METHOD
Parameters INDA AMLO
Wavelength (nm) 287 287 360
Beer’s Law limit
( µg /ml) 5-30 10-60 10-60
Sandell’s sensitivity (µg/cm2/0.001 absorbance
unit) 0.1086 0.9090
0.08196
Regression equation (Y= mx+c)
Slop (m) Intercept (c)
Y=0.011x-0.013
0.011 0.013
Y= 0.002x-0.014
0.002 0.014
Y=0.013x-0.010
0.013 0.010 Correlation coefficient (r2) 0.999 0.998 0.999
LOD (µg/ml) 0.46 1.67 0.55
LOQ (µg /ml) 1.42 2.29 0.75
Repeatability (RSD, n=6) 0.36 0.38 0.89
Precision (RSD)% Intraday (n=3)
Interday (n=3) 0.49 0.28 –– 0.38 0.68 0.30 0.61 - 0.69 – 0.50 0.39 0.53 –– 0.52 0.73
Recovery (n=3) 100.03±1.02 --- 99.86±0.33
Table 2: RECOVERY DATA OF PROPOSED METHOD (N=3)
Drug Level Amount of sample taken (µg/ml)
Amount of standard spiked
(µg/ml)
Total Amount recovered
(µg/ml)
% Recovery ± SD
AMLO
I 20 10 30.55 101.85 ±0.167
II 20 20 39.69 99.22±0.195
III 20 30 49.26 98.51±0.641
INDA
I 10 5 14.93 99.59 ± 1.40
II 10 10 19.90 99.54±0.91
III 10 15 25.24 100.96±0.76 S. D. is Standard deviation and n is number of replicates
Table 3: ANALYSIS OF FORMULATION OF AMLO AND INDA BY PROPOSED METHOD (N=6)
Sample No.
Label Claim Amount Found % Assay
AMLO (mg)
INDA
(mg) AMLO (mg)
INDA (mg)
AMLO (mg)
INDA (mg)
1 5 1.5 5.04 1.489 100.80 99.33
2 5 1.5 5.05 1.470 101.00 98.00
3 5 1.5 4.90 1.515 98.00 101.00
4 5 1.5 4.94 1.479 98.80 98.66
5 5 1.5 4.98 1.497 99.60 99.80
6 5 1.5 4.93 1.489 98.60 99.33
Mean 4.97 1.49 99.46 99.35
SD 0.061 0.015 1.22 1.02 S. D. is Standard deviation and n is number of replicates
Fig. 3: Overlain absorption Zero-order spectra of AMLO (20 µg/ml) and INDA (20 µg/ml) in methanol.
Fig. 4: Calibration curve of AMLO at 360nm
Fig. 5: Calibration Curve of AMLO at 287nm
Fig. 6: Calibration Curve of INDA at 287nm


