www.nat-hazards-earth-syst-sci.net/10/1513/2010/ doi:10.5194/nhess-10-1513-2010
© Author(s) 2010. CC Attribution 3.0 License.
and Earth
System Sciences
Application of polarization ellipse technique for analysis of ULF
magnetic fields from two distant stations in Koyna-Warna
seismoactive region, West India
F. Dudkin1, Gautam Rawat2, B. R. Arora2, V. Korepanov1, O. Leontyeva1,*, and A. K. Sharma3
1Lviv Centre of Institute of Space Research, Lviv, 79000, Ukraine 2Wadia Institute of Himalayan Geology, Dehradun, 248 001, India 3Department of Physics, Shivaji University, Kolhapur, India *Invited contribution by O. Leontyeva, recipient of the EGU
Young Scientists Outstanding Poster Paper Award 2008.
Received: 26 November 2009 – Revised: 15 June 2010 – Accepted: 16 June 2010 – Published: 12 July 2010
Abstract. A new approach is developed to find the source azimuth of the ultra low frequency (ULF) electromagnetic (EM) signals believed to be emanating from well defined seismic zone. The method is test applied on magnetic data procured from the seismoactive region of Koyna-Warna, known for prolonged reservoir triggered seismicity. Ex-tremely low-noise, high-sensitivity LEMI-30 search coil magnetometers were used to measure simultaneously the vector magnetic field in the frequency range 0.001–32 Hz at two stations, the one located within and another∼100 km away from the seismic active zone. During the observation campaign extending from 15 March to 30 June 2006 two earthquakes (EQs) of magnitude (ML>4) occurred, which
are searched for the presence of precursory EM signals. Comparison of polarization ellipses (PE) parameters formed by the magnetic field components at the measure-ment stations, in select frequency bands, allows discrimina-tion of seismo-EM signals from the natural background ULF signals of magnetospheric/ionospheric origin. The magnetic field components corresponding to spectral bands dominated by seismo-EM fields define the PE plane which at any instant contains the source of the EM fields. Intersection lines of such defined PE planes for distant observation stations clutter in to the source region. Approximating the magnetic-dipole configuration for the source, the magnetic field components along the intersection lines suggest that azimuth of the EM source align in the NNW-SSE direction. This direction well
Correspondence to:Gautam Rawat ([email protected])
coincides with the orientation of nodal plane of normal fault plane mechanism for the two largest EQs recorded during the campaign. More significantly the correspondence of this di-rection with the tectonic controlled trend in local seismicity, it has been surmised that high pressure fluid flow along the fault that facilitate EQs in the region may also be the source mechanism for EM fields by electrokinetic effect.
1 Introduction
piezomagnetic effects (Martin et al., 1978; Ogawa et al., 1985; Johnston et al., 1994; Ogawa and Utada, 2000) and (5) microfracture electrification (Molchanov and Hayakawa, 1995) (all references are given as example). The under-ground ULF EM field attenuates only little in crustal material and hence on theoretical consideration associated magnetic field can be detected to a large distances up to 100–150 km (Hayakawa et al., 2007).
The practical detections and applications of precursory EM signals in real time EQ prediction continue to be chal-lenging due to several problems; (i) intensity of anticipated seismo-EM signals in ULF band is very low (notable excep-tion being the highly enhanced signals recorded in associa-tion with M7.1 Loma Prieta earthquake (Fraser-Smith et al., 1990; Bleier et al., 2009), although question has been raised that this anomalously large signal may not be due the prox-imity of the magnetometer to the epicenter but artifact of the sensor-system malfunction (Thomas et al., 2009)), (ii) dis-crimination of weak seismo-EM signals from the background natural EM fields of ionospheric and magnetospheric origin and (iii) finally the limitation in the localization of precur-sor source or, at least, determination of azimuth direction to the source zone. Very often later problems are aggravated by short time (less than 5 min) of precursor existence (Bleier et al., 2009). With the availability of very sensitive induction type 3-component magnetometers with high suppression of man-made interference, the recording of high quality mag-netic data in ULF bands has greatly improved (Hayakawa et al., 2007). For the second problem, polarization analy-sis incorporating the ratioSZ/SH(SZ andSH are the
spec-tral intensities of vertical and horizontal magnetic field com-ponents) is found effective, at least partially, in distinguish-ing seismo-EM signals from geomagnetic field fluctuations (Hayakawa et al., 1996). The formulations of principal com-ponent analysis and fractal approach have been used with some success in isolating components of extra-terrestrial and seismotectonic origin in magnetic field records (see, for ex-ample, Hayakawa et al., 1999, 2007; Serita et al., 2005; Ida and Hayakawa, 2006). Towards the identification of under-ground ULF source or its direction, formulation based on the time lag or phase difference between pair or more observa-tion points has been advanced, referred to as gradiometric method (Kopytenko et al., 2001, 2006; Ismaguilov et al., 2003). The technique may lack reliability as the ULF electro-magnetic waves propagating through the conductive layers undergo strong dissipation and dispersions, making the iden-tification of front of ULF signal ambiguous (Surkov et al., 2004). Working independently, Surkov et al. (2004) advo-cated use of amplitude difference in synchronous observation at two or multiple recording sites. The method, in principle, hold promise to estimate both the location and direction of the ULF source provided the spatial scale of natural noise variation should be much greater than both characteristic length of the ULF signal itself and distance between magne-tometers. However, space derivative of magnetic field
pertur-bations tend to be very unstable at low signal-to-noise (S/N) ratio and gives a big error in the estimation of source direc-tion (see remarks about S/N ratio in Dudkin et al., 2003). Very promising in the direction-finding problem for seismo-EM precursors is an application of the polarization ellipse (PE) technique, where the PE major axis behavior is investi-gated (goniometric method) (Du et al., 2002; Schekotov et al., 2007, 2008). This technique allows determination of trends in azimuth angle of anomalous ULF signal and pos-sibly area of EQ epicentre. Taking into account that ULF magnetic source is always in the PE plane (see Appendix) the new method of magnetic precursor source location from two observation points has been proposed by present authors (Dudkin et al., 2008). In the present paper expanding on the steps of this new direction-finding approach, we test apply the formulation on magnetic field data from pair of stations operated simultaneously in one of the seismoactive region of India.
The paper is structured as follow: Sect. 2 gives brief ac-count of the seismic background in the study area. The noise-sensitivity parameters of magnetometer deployed, data ac-quisition and initial data preparation steps and nature of the seismic activity recorded during the observational campaign are listed in Sect. 3. The outline of the PE method for the isolation of seismo-EM signals and estimation of the direc-tion and possible locadirec-tion of seismo-EM source is described in Sect. 4. In Sect. 5, discussion of the results in reference to source validation and possible generating source mechanism form the central stage, followed by a short summary.
2 Current and past seismic history of the study area and experiment description
Koyna-Warna region in the southern part of Deccan Volcanic Province, Western India is a classical example of reservoir triggered seismicity – Fig. 1 (for review see Gupta, 2002, and references therein). The largest triggered earthquake of M 6.3 occurred here on 10 December 1967, and over the past four and a half decades area has remained intensively seismoactive (Gupta, 2005). During this period 19 EQs of ML≥5 and about 170 EQs with ML≥4 have occurred, all
confined to a well defined belt of roughly 20×30 km2 with hypocentresh≤12 km (Gupta et al., 2007). Such features make the area unique for studying peculiarities of magnetic field during EQ preparation process.
Extremely low-noise (SB,n=0.2 pT/Hz0.5 at f=1 Hz,
where SB,n is spectral noise density) with high factor of
industrial interference suppression (more than 1000) 3-component LEMI-30 magnetometers, specially designed by Lviv Centre of Institute for Space Research, Ukraine (http: //www.isr.lviv.ua) for EQ EM monitoring, were deployed at both stations for synchronous recording. LEMI-30 magne-tometers operate in frequency range 0.001–32 Hz and are ideally suited to record the most promising EQ magnetic precursors in ULF band, which are found dominant below 0.1 Hz (Hayakawa et al., 2004, 2007). Both stations recorded simultaneous data with 64 samples per second over the entire observational campaign period of 15 March–30 June 2006. During data processing a resampling procedure was applied with averaging each of 64 samples. Thus an upper bound-ary of signal spectra was decreased to 0.5 Hz. For such data the dynamical Fourier spectra (DFS) for each 24 h of data recording were calculated. Then for each point of DFS the parameters of PE for each measuring site were calculated, which form the base to search EQ precursory magnetic anal-ysis described in the next section.
In the post 1993 period, the seismic activity in Koyna-Warna region is being monitored by a closely spaced network of seven modern 3-component seismometers established by National Geophysical Research Institute, Hyderabad (Gupta, 2002). The uniform azimuth coverage allows estimation of epicentres to an accuracy of±0.5 km. During the period of present campaign, more than 700 EQs with magnitude in the range of ML=0.5–4.7 were recorded, two of them with
mag-nitude ML>4, 8 EQs with ML>3 and as many as 172 with
ML>2. The spatial distribution of these EQs with ML>2.5
(Fig. 1) completely overlaps with the area outlined by seis-mic activity over the past 45 years. The 2 largest EQs oc-curred; EQ1 on 17 April 2006 (ML=4.7,h=3.9 km, 17.13 N,
73.78 E, 16.39.59.4 UT) and EQ2 on 21 May 2006 (ML=4.2,
h=5.1 km, 17.17 N, 73.77 E, 20.29.01.2 UT) and their fault plane solutions as determined by NGRI are shown as inset in Fig. 1. The ULF magnetic activity in relation to these 2 modest magnitude EQs is examined and presented in next sections.
3 Experiment, results and discussion
3.1 Polarization analysis
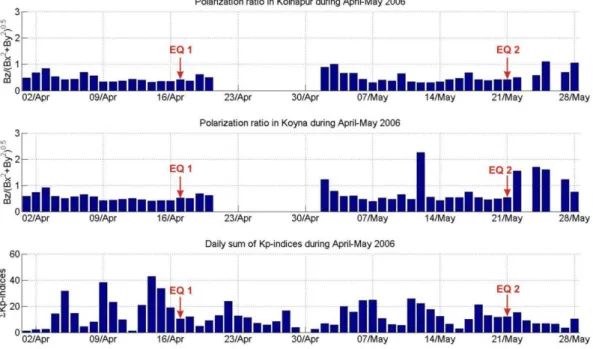
As described earlier, the polarization analysis in the form ofSZ/SH plots in the select frequency bands are commonly
used to search precursory ULF magnetic signals before large earthquakes. Figure 2 gives the plot ofSZ/SH at a
represen-tative frequency band of 0.01–0.03 Hz (Yumoto et al., 2009) for the April–May 2006. This frequency band is selected as it is shown later that most precursory magnetic signals in ULF bands are concentrated in frequency range of 0.01–0.07 Hz. This simple mode of presentation shows that except for
oc-Fig. 1.Map of western India showing location of ULF magnetome-ter stations established to monitor EM emission related to reservoir triggered seismicity associated with Koyna-Warna reservoirs. Black dots represent epicentre of EQs recorded during the observational campaign period of March–June 2006. Fault plane solutions of two moderate EQs (ML>4) are also shown. Surface intersection point of M-lines (see text) are indicated by red and blue triangles.
casional differences in the temporal variability, polarization ratios at both stations exhibit general resemblance. How-ever, the variability of SZ/SH ratios neither show any
sig-nificant correlation with geomagnetic activity nor any signif-icant change from background values, which could be classi-fied as magnetic precursor candidates (see Fig. 2), is seen in relation to EQ occurrence. Given the high sensitivity of the LEMI-30 search coil magnetometer used here, magnetic sig-nals with amplitude as low as 1–80 pT onHandZare well resolved but it seems likely that small amplitude EQ precur-sory magnetic signals, even if present in relation to the mod-erate magnitude EQ studied here, are completely masked by much stronger signals from ionospheric and magnetospheric sources to stand out clearly inSZ/SH ratio plot.
3.2 Source azimuth estimation by polarization ellipse method
Fig. 2.Polarization ratioSZ/SH in frequency range 0.01–0.03 Hz and Kp sums during March–June 2006. The gaps in data relate to days of mainpower disconnections.
1. In narrow ULF frequency band the magnetic field com-ponents can be represented as harmonic (periodic) sig-nals.
2. At a given frequency, 3-orthogonal components of mag-netic field with specific phases provide estimate the PE parameters, the resultant PE plane in space contains the source of EM field.
3. Alternating (induction) currents generated by any al-ternative seismo-EM source mechanisms, referred to in Sect. 1, can be visualized as small-scale superpo-sition on large-scale telluric current system induced by global induction. These local current perturba-tions resulting from the motion of the conductive layer of rocks (inductive effects) or related to piezoelec-tric/piezomagnetic effects or so can generally be viewed as closed loop configuration and thus can be approxi-mated to be equivalent to that produced by elementary magnetic dipoles placed in the source region. The as-sumption of magnetic-dipole type configuration is im-plicit in estimating the ULF source parameters using the spatial derivative of magnetic field (Surkov et al., 2004). In case of electrokinetic effect, the superposed current system may contain unclosed configuration (e.g. see Fe-dorov et al., 2001) and thus inhibit approximation of net flow by magnetic-type dipole. This would especially be valid when flow is confined to uniform homogeneous medium (Moore et al., 2004). However, for real crust characterized by inhomogeneous structures, it has been shown that when the underground water under the
ef-fect of accumulating stresses is forced through the nar-row fault plane the resulting streaming potential gives rise to concentrated flow of electric current along the fault plane that closes its path by way of return currents on either side of the fault plane (Mizutani and Ishido, 1976). This is consistent with the generalized calcula-tions of Moore et al. (2004) who showed that net cur-rent resulting from electrokinetic effect consists of “im-pressed” and “back” (return) currents. In such a special structural geometry, the overall configuration of elec-trokinetic current flow can form compact asymmetric closed loops with a component of intense current along highly conductive duct (fault) and thus allowing mag-netic dipole-like source approximation. Such approx-imation appears justified for the present study region where source region of seismicity is confined to short length (∼20 km) of narrow Koyna River Fault Zone (Gupta et al., 2007). This fault segment form steep boundary between inhomogeneous crustal blocks and provide conduits for fluid pressure flow which prevails right up to hypocenter depths (Talwani, 1997a; Pandey, 2003; Agrawal et al., 2004).
4. Magnetic moment of such a magnetic dipole source is in PE plane formed by its field components at the mea-surement points.
Fig. 3.Formation of M-line by the intersection of two PE-planes.
Fig. 4.Configuration of M-area.
contains the magnetic dipole momentM, which is aligned along it, and can be calculated from parameters of PE. Cal-culation of PE parameters and magnetic moment follows the illustrations in Fig. A1a, b, the details can be found in rele-vant monographs on electromagnetism or in article (Morgan and Evans, 1951).
Source region of the EQs near Koyna is confined to nar-row localized area 20×30 km2with hypocentres restricted to depths less than 12 km (Gupta, 2005; Gupta et al., 2007). Thus for the detection of the magnetic precursors of two main EQs, we defined the source area of interest (M-area) by a parallelepiped of 20 km length and a cross section of 3×3 km2 with centre at EQ hypocentres. Then we calcu-late PE planes intersections (M-lines) which intersect M-area (Fig. 4) for both stations of synchronous observations. The M-lines were calculated for each point of DFS in the fre-quency range 0.001–0.5 Hz (i.e. for each harmonic and ele-mentary time window used in the calculation of spectra).
It is widely accepted that the most promising frequency range of ULF magnetic precursors overlaps with the Pc3-Pc5 band of micropulsations (see, for example, Hayakawa et al., 2007; Kopytenko et al., 2001; Molchanov et al., 2004). The sources of these pulsations are dominantly of magneto-spheric origin related to field line resonance or large-scale
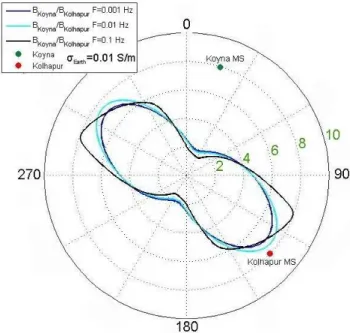
Fig. 5.Koyna/Kolhapur PE major axes ratio against direction of the magnetic dipole moment.
(a) (b)
Fig. 6. The number of detected seismo-EM and ionospheric signals with the Kp-index values during time of observation. Red bars are seismo-EM precursors, blue bars are ionospheric signals.
3.3 Source validation
The detected and classified seismo-EM and ionospheric sig-nals with the Kp-index values during the observation cam-paign interval are shown in Fig. 6a, b. The good correla-tion between the numbers of signals of the ionospheric ori-gin and the value of Kp-index is clearly seen. The number of seismo-EM signals increase before EQ1 (ML=4.7) up to
11 April and then approaches to zero level. After EQ1 very low seismo-EM activity in region of interest is observed. For EQ2 (ML=4.2) the number of magnetic precursors is
maxi-mal on 17 May and then drop rapidly to smaxi-mall value. Then on 23 May the signals classified as seismo-EM origin rise again, which apparently is neither related to any abnormal seismic activity nor marked by intense solar/magnetic disturbances. However, given that this time interval is marked by moderate values of Kp, it seems possible that these seismo-EM signals related to the release of residual mechanical stresses follow-ing EQ2.
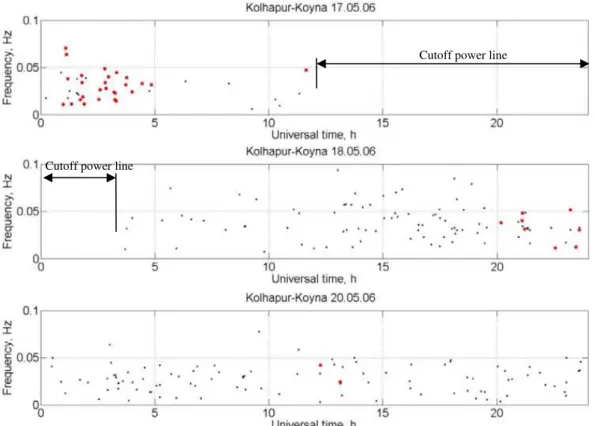
Further as an example, the frequency of the seismo-EM and ionospheric/magnetospheric signals against time are shown for 17, 18 and 20 May (see Fig. 7). The mag-netic precursors are confined to narrow frequency range of about 0.01–0.07 Hz and completely overlap with the most dominant frequency range of ionospheric signals. Thus, source separation based on the frequency characteristic alone will not be unambiguous. However, it is shown that the ratio of major axes of PE at two distant sites proves effective in isolating EM signals of seismo-EM and
in-ospheric/magnetospheric origins (Figs. 6 and 7). It may be added that fixing of major axes ratio at 2 for isolating sig-nals of different origin is some what arbitrary. Adopting value below or above the critical threshold would, respec-tively, lead to either increased cases of contamination from ionospheric/magnetospheric sources or reduced number of precursory events for the purpose of further estimation of M-lines aimed at primary goal of source location. May be long term monitoring of magnetic fields in ULF band in a given seismic belt would help more realistic identification of factor. 3.4 EM source mechanism and linkage to seismicity
Cutoff power line
Cutoff power line
Fig. 7.Distribution of ionospheric and seismo-EM M-lines against time and frequency for 17, 18 and 20 May 2006. Red and blue points are seismo-EM and ionospheric signals respectively.
region starting from 1963 to the present has concentrated on a short 30 km long segment of the fault, which is seen as an extension of 10◦N–15◦E trending Koyna River Fault Zone (KRFZ) to the south in NNW-SSE direction (Fig. 1). An-other notable feature of the seismicity in this region is that epicentres of all large EQs (M>5) starting with the Koyna mainshock in 1967 (M=6.3) to last EQ of M>5 in 2005 have progressively migrated southward on this NNW-SSE trend-ing fault starttrend-ing from the south of the Koyna river and ex-tending to the Warna River (Talwani, 1997b). Amongst the several mechanisms suggested to explain the occurrence of continued seismicity in the Koyna-Warna region, the role of high-fluid pressure in producing failure on the preexist-ing critically stressed faults has received wider acceptance in generating EQs in the region (Talwani, 1997a; Pandey, 2003). More recently, extending this hypothesis, it have been attributed the temporal southward migratory trend in seis-micity to similar changes in direction of pore-fluid pressure diffusion (Ramalingeswara and Singh, 2008). They further demonstrated that changes in fluid flow directions were in-dependently corroborated by the strikes of the focal mech-anisms of large EQs (M>5). The fault plane solution of EQ1 and EQ2 indicate normal faulting, in agreement with the faults mechanisms for most of the large EQs recorded from this region (Gupta et al., 2002). Further, one of strike
directions of fault plane solutions of the EQ1 and EQ2 is parallel to the active segment of the KRFZ. Given this cor-respondence and observational evidence that azimuth plane of magnetic ULF sources is oriented in the same direction, it is possible to postulate that both EQs and ULF magnetic signals are common manifestation of fluid flow diffusion in the focal zone. The active segment of the KRFZ, multi-ple fractures and fissure may be providing conduits for the high pore-pressure flow down to hypocentral depth (Talwani, 1997b; Agrawal et al., 2004). The oriented focused flow of fluid at focal depth under the effect of accumulated high stresses by way of electrokinetic effects may be the effec-tive source cause for ULF magnetic signals (Mizutani et al., 1976; Uyeda et al., 2009, and references therein). The elec-trokinetic effect was earlier invoked by Arora (1988; also see Arora and Singh, 1992) to explain the bi-polarity nature of seismomagnetic anomalies observed around the Koyna reser-voir in association with a sequence of moderate magnitude (ML=4.1–4.3) EQs in the same area during 1980.
4 Summary
1520 F. Dudkin et al.: Application of polarization ellipse technique for analysis of ULF magnetic fields as of few pT. Despite this advantage, the commonly
em-ployed polarization analysis (SZ/SH ratio) fails to reveal any
precursory seismo-EM signals, perhaps such signals, even if present, are completely masked by the much stronger signals of natural ionospheric/magnetospheric origin. This is rather not surprising as almost all reported anomalies are in relation to large EQs of M>5, whereas the only two EQs searched here have magnitude ML>4. However, controlled by the
orientation of seismogenic faults, resulting seismo-EM field would have definite orientation in comparison to the isotropic direction distribution of highly variable natural signals aris-ing from complex ionospheric-magnetospheric interactions. Based on these physical considerations, the interactions lines defined by the planes of PE, formed by the magnetic fields at minimum two sites, define the azimuth of seismo-EM source. Further, ratio of major axes of PEs above certain thresh-old help to distinguish ULF signals dominated by seismo-EM origin from those associated with ionospheric origin. In the present case, this threshold is fixed at 2, corresponding to the minimum value of the ratio recorded between Koyna and Kolhapur. This choice of the value of cutoff threshold adopted here has arbitrariness but can be constrained better with long term data. Approximating the seismo-EM source as elementary magnetic dipole, the large numbers of spec-tral lines qualifying this threshold provide statistically aver-aged azimuth of the seismo-EM field. The NNW-SSE orien-tation of seismogenic ULF signals in the Koyna-Warna cor-responds well with causative fault zone inferred from long-term EQ data. The already available knowledge on the role of high pressure fluids in generating the EQs favours elec-trokinetic effect to be one of the possible source mechanisms for seismo-EM fields. The alternative source mechanisms, inductive or piezomagnetic effects, may equally well explain the observations. Testing the proposed formulation to the other more active seismic belts, where source zone is not as well defined as the Koyna-Warna region would help general-ization of the methodology for future EQ precursory studies. Such future experimentation essentially employing multiple stations would be key diagnostic to map the exact nature of sesimo-EM field perturbations and thus validating the mag-netic dipole-like approximation for the source, implicit to the formulation advanced here.
Appendix A
The EM field of magnetic dipole with a moment M in spher-ical coordinate system has a following form (see Fig. A1a)
Br= Mµcosθ 2π r3
(1+j kr)exp(−j kr), Bθ= Mµsinθ4π r3 1+j kr−(kr)2exp(−j kr), Eϕ= Mµsinθ4π r2(−j ω)(1+j kr)exp(−j kr),
,(A1)
whereB is the magnetic induction; E is the electric field strength;µis the magnetic permeability of the medium;k= (ωµσ )˙ 0.5is the wave number of the medium,σ˙ =ωε−j σ;
(
)
(
( )
)
(
)
(
)
(
)(
) (
)
⎪⎪⎭ ⎪⎪ ⎬ − + − = − − + = ωμ π θ π θ μ ϕ θ μ(
ωμσ&)
σ&=ωε− σ ε σ−
= ω π
θ
(a) (b)
ρ ρ
ρ ≤ ≤
(
π)
(
σ)
ρ = ρ = ×
( )
π ρ=(
+)
ρ
(
)
(
(
)
)
(
)
(
(
)
)
(
)
(
(
)
)
⎪⎪⎭ ⎪⎪ ⎬ ⎫ − = − = − = ρ π ϕ μ πρ ϕ μ πρ ϕ μ ϕ ρ ρ φσ ρ ≈ ρ ≈ ×
Fig. A1.Magnetic dipole source and components of EM field.
ε, σ are the electric permeability and electric conductivity of the medium, respectively;j=√−1,ω=2πf,f is the fre-quency of EM field,θis angle between vectors of momentum M andr,ris the distance between magnetic source and the point of observation. From Fig. A1a we can see that both components of magnetic field and consequently a PE are in the plane formed by vectorsM andr.
The magnetic field of arbitrary oriented magnetic dipole can be decomposed into horizontal and vertical dipoles (Fig. A1b). The directional diagram of such a dipole depends only on horizontal component of its magnetic moment.
The field of the horizontal magnetic dipole embedded in lossy medium (crust) for near field range approximation (5ρA≤ρ≤0.2ρB), where
ρA =
104.4π 0.2 f σ0.5
,
ρB =3×10⁸ .
(2πf ),
ρ =x2+y2,
(ρis the horizontal distance to dipole) for point of observa-tion (x,y,z)what is close to air-earth boundary (z≪h)can be written in the simplified form Ba˜nos (1966)
Bρ= Mµcosϕπρ3exp(j k (h−z)),
Bϕ= Mµsinϕ2πρ3exp(j k (h−z)),
Bz= 3jMµcosϕ2π kρ4exp(j k (h−z)),
(A2)
whereρ,ϕ,zis the cylindrical coordinate system. The hor-izontal magnetic dipole has coordinates (0, 0,−h). For ex-ample, at the hypocenter depthh=10 km, frequency 0.5 Hz and the crustal conductivityσ=0.01 S/m, ρA≈5 km,ρB≈
9.5×10⁴km.
Acknowledgements. At Wadia Institute of Himalayan Geology,
and guidance are greatly acknowledged. B. K. Bansal, Program Co-ordinator, MoES is thanked for facilitating the activity and suggestions in experiment planning. Authors have special thanks to D. Shashidhar, NGRI, Hyderabad for readily providing the EQ data including the fault plane solutions. The help received from Shri D. D. Khandelwal in field campaign is deeply appreciated. Authors thank the parent institutions for providing facilities in bringing the present study to this stage.
Edited by: M. E. Contadakis
Reviewed by: A. De Santis and another anonymous referee
References
Agrawal, P. K., Pandey, O. P., and Chetty, T. R. K.: Aeromagnetic anomalies, lineaments and seismicity in Koyna-Warna Region, J. Ind. Geophys. Union, 8(4), 229–242, 2004.
Arora, B. R.: Tectonomagnetic studies in India (Invited), “Earth-quake Prediction – Present Status”, edited by: Guha, S. K. and Patwardhan, A. M., Dept. of Geology, University of Poona, Pune, India, pp. 53–62, 1988.
Arora, B. R. and Singh, B. P.: Geomagnetic and geoelectric in-vestigations for seismicity and seismotectonics of the Himalayan region, in: Himalayan Seismicity, edited by: Gupta, G. D., Mem. Geol. Soc. India., 23, 223–262, 1992.
Ba˜nos, A.: Dipole radiation in the presence of a conducting half-space, Pergamon Press, Oxford, 1966.
Bleier, T., Dunson, C., Maniscalco, M., Bryant, N., Bambery, R., and Freund, F.: Investigation of ULF magnetic pulsations, air conductivity changes, and infra red signatures associated with the 30 October Alum Rock M5.4 earthquake, Nat. Hazards Earth Syst. Sci., 9, 585–603, doi:10.5194/nhess-9-585-2009, 2009. Cagniard, L.: Basic theory of the magnetotelluric method of
geo-physical prospecting, Geophysics, 18, 605–635, 1953.
Du, A., Huang, Q., and Yang, S.: Epicenter location by abnormal ULF electromagnetic emissions, Geophys. Res. Lett., 29(10), 1455–1458, 2002.
Dudkin, F., De Santis, A., and Korepanov, V.: Active EM sounding for early warning of earthquakes and volcanic eruptions, Phys. Earth Planet. Inter., 139(3, 4), 187–195, 2003.
Dudkin, F., Leontyeva, O., Arora, B. R., Rawat, G., and Sharma, A.: Analysis of magnetic field polarization parameters before and after Koyna earthquakes, EGU General Assembly, Vienna, Austria, 13–18 April 2008, Geophys. Res. Abstr., 10, EGU2008-A-00054, 2008.
Fedorov, E., Pilipenko, V., and Uyeda, S.: Electric and Magnetic Fields Generated by Electrokinetic Processes in a Conductive Crust, Phys. Chem. Earth (C), 26(10–12), 793–799, 200l. Fitterman, D. V.: Theory of electrokinetic magnetic anomalies in a
faulted half-space, J. Geophys. Res., 84(B11), 6031–6040, 1979. Fraser-Smith, A. C., Bernardi, A., McGill, P. R., Ladd, M. E., Hel-liwell, R. A., and Villard Jr., O. G.: Low-frequency magnetic field measurements near the epicenter of the Ms 7.1 Loma Prieta earthquake; Geophys. Res. Lett., 17, 1465–1468, 1990. Gupta, H. K.: A review of recent studies of triggered earthquakes by
artificial water reservoirs with special emphasis on earthquakes in Koyna, India, Earth-Sci. Rev., 58, 279–310, 2002.
Gupta, H. K.: Artificial water reservoir-triggered earthquakes with special emphasis at Koyna, Current Science, 88(1), 1628–1631,
2005.
Gupta, H., Shashidhar, D., Pereira, M., Mandal, P., Purnachandra, Rao N., Kousalya, M., Satyanarayana, H. V. S., and Dimri, V. P.: Earthquake forecast appears feasible at Koyna, India, Current Sci., 93(6), 1628–1631, 2007.
Hayakawa, M., Kawate, R., Molchanov, O. A., and Yumoto, K.: Re-sults of ultra-low-frequency magnetic field measurements during the Guam earthquake of 8 August 1993, Geophys. Res. Lett., 23, 241–244, 1996.
Hayakawa, M., Itoh, T., and Smirnova, N.: Fractal analysis of ULF geomagnetic data associated with the Guam earthquake on 8 Au-gust 1993, Geophys. Res. Lett., 26, 2797–2800, 1999.
Hayakawa, M., Itoh, T., Hattori, K., and Yumoto, K.: ULF electro-magnetic precursors for an earthquake in Biak, Indonesia on 17 February 1966, Geophys. Res. Lett., 27, 1531–1534, 2000. Hayakawa, M., Molchanov, O. A., and NASDA/UEC team:
Achievements of NASDA’s Earthquake Remote Sensing Frontier Project, TAO, 15(3), 311–327, 2004.
Hayakawa, M., Hattori, K., and Ohta, K.: Monitoring of ULF (ultra-low-frequency) Geomagnetic Variations Associated with Earth-quakes, Sensors, 7, 1108–1122, 2007.
Ida, Y. and Hayakawa, M.: Fractal analysis for the ULF data dur-ing the 1993 Guam earthquake to study prefracture criticality, Nonlin. Processes Geophys., 13, 409–412, doi:10.5194/npg-13-409-2006, 2006.
Ismaguilov, V. S., Kopytenko, Yu. A., Hattori, K., and Hayakawa, M.: Variations of phase velocity and gradient values of ULF geomagnetic disturbances connected with the Izu strong earthquakes, Nat. Hazards Earth Syst. Sci., 3, 211–215, doi:10.5194/nhess-3-211-2003, 2003.
Johnston, M. J. S., Muller, J. S., and Sasai, Y.: Magnetic field ob-servations in the near field: the 28 June, 1992 Mw 7.3 Landers, California Earthquake, B. Seism. Soc. Am., 84, 792–798, 1994. Kopytenko, Yu. A., Ismaguilov, V. S., Hayakawa, M., Smirnova,
N., Troyan, V., and Peterson, T.: Investigation of the ULF elec-tromagnetic phenomena related to earthquakes: contemporary achievements and perspectives, Annali di Geofisica, 44(2), 325– 334, 2001.
Kopytenko, Yu. A., Ismaguilov, V. S., Hattory, K., and Hayakawa, M.: Determination of hearth position of forthcoming strong EQ using gradients and phase velocities of ULF geomagnetic distur-bances, Phys. Chem. Earth, 31, 292–298, 2006.
Martin, R. J., Habermann, R. E., and Wyss, M.: The effect of stress cycling and inelastic volumetric strain on remanent magnetiza-tion, J. Geophys. Res., 83, 3485–3496, 1978.
Mizutani, H. and Ishido, T.: A new interpretation of the magnetic field variation associated with the Matsushiro Earthquakes, J. Geomagn. Geoelectr., 28, 179–188, 1976.
Mizutani, H., Ishido, T., Yokokura, T., and Ohnishi, S.: Electroki-netic phenomena associated with earthquakes, Geophys. Res. Lett., 13, 365–368, 1976.
Molchanov, O. A., Schekotov, A. Yu., Fedorov, E., Belyaev, G. G., Solovieva, M. S., and Hayakawa, M.: Preseismic ULF effect and possible interpretation, Ann. Geophys., 47(1), 119–131, 2004. Moore, J. R., Glaser, S. D., Morrison, H. F., and
Hover-sten, G. M.: The streaming potential of liquid carbon diox-ide in Berea sandstone, Geophys. Res. Lett., 31, L17610, doi:10.1029/2004GL020774, 2004.
Morgan, M. and Evans, W.: Synthesis and analysis of elliptic polar-ization loci in terms of space-quadrature sinusoidal components, Proc. IRE, 39, 552–556, 1951.
Ogawa, T., Oike, K., and Miura, T.: Electromagnetic Radiations from Rocks, J. Geophys. Res., 90(D4), 6245–6249, 1985. Ogawa, T. and Utada, H.: Coseismic piezoelectric effects due to a
dislocation. 1. An analytic far and early-time field solution in a homogeneous whole space, Phys. Earth Planet. Inter., 121, 273– 288, 2000.
Pandey, A. P. and Chadha, R. K.: Surface loading and triggered earthquakes in the Koyna–Warna region, western India, Phys. Earth Planet. Inter., 139, 207–223, 2003.
Ramalingeswara Rao, B. and Singh, C.: Temporal migration of earthquakes in Koyna–Warna (India) region by pore-fluid diffu-sion, J. Seismol., 12(4), 547–556, 2008.
Schekotov, A. Y., Molchanov, O. A., Hayakawa, M., Fedorov, E. N., Chebrov, V. N., Sinitsin, V. I., Gordeev, E. E., Belyaev, G. G., and Yagova, N. V.: ULF/ELF magnetic field variations from atmosphere induced by seismicity, Radio Sci., 42, RS6S90, doi:10.1029/2005RS003441, 2007.
Schekotov, A. Y., Molchanov, O. A., Hayakawa, M., Fedorov, E. N., Chebrov, V. N., Sinitsin, V. I., Gordeev, E. E., Andreevsky, S. E., Belyaev, G. G., Yagova, N. V., Gladishev, V. A., and Baransky, L. N.: About possibility to locate an EQ epicenter using parameters of ELF/ULF preseismic emission, Nat. Hazards Earth Syst. Sci., 8, 1237–1242, doi:10.5194/nhess-8-1237-2008, 2008.
Serita, A., Hattori, K., Yoshino, C., Hayakawa, M., and Isezaki, N.: Principal component analysis and singular spectrum analy-sis of ULF geomagnetic data associated with earthquakes, Nat. Hazards Earth Syst. Sci., 5, 685–689, doi:10.5194/nhess-5-685-2005, 2005.
Surkov, V. V.: ULF electromagnetic perturbations resulting from the fracture and dilatancy in the earthquake preparation zone, pp. 357–370, in: Atmospheric and Ionospheric Phenomena Associ-ated with Earthquakes, edited by: Hayakawa, M., TERRAPUB, Tokyo, 1999.
Surkov, V. V., Molchanov, O. A., and Hayakawa, M.: Pre-earthquake ULF electromagnetic perturbations as a result of in-ductive seismomagnetic phenomena during microfracturing, J. Atmos. Sol. Terr. Phys., 65(1), 31–46, 2003.
Surkov, V. V., Molchanov, O. A., and Hayakawa, M.: A direc-tion finding technique for the ULF electromagnetic source, Nat. Hazards Earth Syst. Sci., 4, 513–517, doi:10.5194/nhess-4-513-2004, 2004.
Talwani, P.: On the nature of reservoir-induced seismicity, Pure Appl. Geophys., 150, 473–492, 1997a.
Talwani, P.: Seismotectonics of the Koyna-Warna Area, India, Pure Appl. Geophys., 150, 511–550, 1997b.
Thomas, J. N., Love, J. J., and Johnston, M. J. S.: On the reported magnetic precursor of the 1989 Loma Prieta earthquake, Phys. Earth Planet. Int., 173, 207–215, 2009.
Trivedi, N. B., Arora, B. R., Padilha, A. L., Da Costa, J. M., and Dutra, S. L. G.: Global Pc5 geomagnetic pulsations of March 24, 1991, as observed along the American sector, Geophys. Res. Lett., 24, 1683–1686, 1997.
Uyeda, S., Nagao, T., and Kamogava, M.: Short-term earthquake prediction: Current status of seismo-electromagnetics, Tectono-physics, 470, 205–213, 2009.
Yumoto, K., Ikemoto, S., Cardinal, M. G., Hayakawa, M., Hattori, K., Liu, J. Y., Saroso, S., Ruhimat, M., Husni, M., Widarto, D., Ramos, E., McNamara, D., Otadoy, R. E., Yumul, G., Ebora, R., and Servando, N.: A new ULF wave analysis for Seismo-Electromagnetics using CPMN/MAGDAS data, Phys. Chem. Earth, 34, 360–366, 2009.