Theoretical Investigation of Geometric Configurations
and Vibrational Spectra in Citric Acid Complexes
Rodrigo Marques Ferreiraa, Maycon Mottaa,b, Augusto Batagin-Netoa,
Carlos Frederico de Oliveira Graeffc, Paulo Noronha Lisboa-Filhoc, Francisco Carlos Lavardac*
aPrograma de Pós-Graduação em Ciência e Tecnologia de Materiais – POSMAT,
Universidade Estadual Paulista – UNESP, Bauru, SP, Brazil
bGrupo de Supercondutividade e Magnetismo, Departamento de Física,
Universidade Federal de São Carlos – UFSCar, São Carlos, SP, Brazil
cDepartamento de Física, Faculdade de Ciências,
Universidade Estadual Paulista – UNESP, Bauru, SP, Brazil
Received: April 15, 2013; Revised: March 22, 2014
The performance of advanced electronic ceramics is directly related to the synthesis route employed. Sol-gel methods are widely used for this purpose. However, the physicochemical intermediate steps are still not well understood. Better understanding and control of these processes can improve the final quality of samples. In this work, we studied theoretically the formation of metal complexes between citric acid and lithium or barium metal cations with different citric acid/metal proportions, using Density Functional Theory electronic structure calculations. Infrared and Raman scattering spectra were simulated for the more stable geometric configurations. Using this methodology, we identified some features of complexes formed in the synthesis process. Our results show that the complexes can be distinguished by changes in the bands assigned to C=O, COH-, and COO- group vibrations. An
estimate of the most stable complexes is made based on total energy.
Keywords: advanced electronic ceramics, density functional theory, infrared spectra simulations, Raman spectra simulations, sol-gel, barium complex
1. Introduction
The performance of advanced electronic ceramics is highly dependent on their synthesis route. In the so-called sol-gel process, there are many variations in the routes used for preparing samples. A deeper understanding of complexes between α-hydroxycarboxylic acids and metals (M) that are
formed on those routes is desirable, since these compounds are highly effective in obtaining heterometallic advanced ceramics1. Several metallic ions with different applications
have been employed in this kind of route, such as lithium ion in the manufacturing of cathodes for fuel cells2,3 and
barium ion in pellets of high temperature superconductors4-6,
magnetic materials7,8, and multiferroic materials9.
The modified polymeric precursors method (MPPM)1,4
involves the polyesterification process of a metal chelate complex using a hydroxycarboxylic acid and a polyhydroxy alcohol in an aqueous solution, which turns into a polymeric gel. In this method, the most commonly employed carboxylic acid is citric acid (CA)4. The MPPM
method has been widely used, since it allows for the preparation of polycrystalline samples of excellent quality, obtaining a highly homogeneous ceramic powder with nanometer-scale particles, and it is reactive at temperatures up to 30% lower than the ceramic powders obtained by traditional routes1,5.
Several steps are involved in the MPPM procedure. As mentioned, the main goal of this method is to obtain a ceramic powder using polymeric precursors via
α-hydroxycarboxylic acid and ethylene glycol. There
are two sequential chemical reactions involved in these methods1. The first, which is the purpose of our theoretical
studies, is the chelation between the α-hydroxycarboxylic
acid and metal ions obtained from simple salts, such as oxides or carbonates. The second is the polyesterification reaction with ethylene glycol, which results in a polymer. These reactions occur in an aqueous medium to form a sol. The gel is obtained after the evaporation of water by raising the solution temperature to 90°C. Following this, heat treatment at 400°C is carried out on the polymer, resulting in a multicomponent oxide ceramic powder with extremely homogeneous stoichiometry. The resulted powder is then calcinated with several intermediate grindings in order to remove the residual organic matter and form the desired final phase. After calcination, the powder is pressed and sintered to obtain ceramic pellets.
chelated with one or two metallic ions, whereas one barium ion was chelated with one, two, or three citric acid molecules in the barium complexes. The identification of geometry configurations, the associated bands for infrared (IR) and Raman spectra and the stability of such metallic ion complexes were investigated, providing additional information that can aid the preparation of electronic ceramics.
2. Methodology
Our work has two distinct steps for each system studied. The first step is determining the most stable structure (geometry optimization) and the second is simulating infrared and Raman shift spectra.
Prior to setting up initial geometries for further optimization, Condensed-to-Atoms Fukui Indices analysis (CAFIs)13 was carried out to evaluate the most likely
chelation sites for both metal ions on the CA structure. In general, these indices describe how the frontier orbitals are modified when the number of electrons is changed and are employed to understand and predict the reactivity of molecules and polymers14-16. According to the type of
reaction, three distinct CAFIs are defined. In our case (metal incorporation), we considered electrophilic attack (fk−) analysis:
fk− = q
k(n) − qk(N−1) (1)
for atom k as a nucleophile, where qk(n) and qk(N−1) are the electronic populations on the k-th atom of the cationic and neutral species of the system studied, calculated for neutral specie geometry.
After CAFIs analysis, the initial geometries of the metal complexes were then optimized using the semiempirical Parametric Method 617 (PM6), implemented in package
MOPAC200918. This method provides a very good structure
to be the initial geometrical configuration from which to start the following phase, the ab initio quality search for the
most stable structure, for which we employed the Density Functional Theory (DFT)19. For DFT calculations, the most
appropriate functional must be selected to ensure high-quality results. Of the many available functionals, we chose the hybrid functional B3LYP20, which has already been
used successfully in similar compounds20,21. Moreover, this
functional is widely used, since it has proven to be reliable, generally yielding good-quality results22. The 6-31G basis
functions set23 was adopted for all atoms except barium, for
which we adopted the set LANL2DZ-ECP24,25, owing to the
high number of electrons of this metallic element. CAFIs, Raman, and IR spectra were calculated with the same DFT approach used in the geometry optimization.
In CAFIs calculations, the electronic populations were evaluated by electrostatic potential fitting (ESP)26
which varies according to the theoretical model used. For DFT/B3LYP/6-31G and DFT/B3LYP/LANL2DZ, the scale factors are 0.962 and 0.961, respectively28. The results
presented in this work were not multiplied by a scaling factor.
All DFT calculations were performed with restricted electronic orbitals, in vacuum, with the General Atomic and Molecular Electronic Structure System (GAMESS) package29. The software employed for the visualization of
complex structures and the evaluation of their properties was Gabedit30 and Wxmacmolplt31.
3. Results and Discussion
First, it was necessary to define an initial geometry for each complex studied. For this purpose, we needed to know the oxidation state of the metal ions and the deprotonation sites of citric acid. It was considered that lithium could enter as a monovalent cation (Li+1) and barium as a divalent cation
(Ba+2)32. Deprotonation of CA was made, such that the final
complex was a closed-shell system.
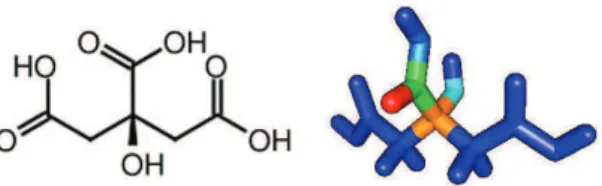
Figure 1 shows the structure of CA and the CAFIs calculated for eletrophilic attack employing Mulliken population analysis. Regions in red and blue represent reactive and non-reactive sites, respectively. Other colors indicate sites with intermediary reactivity. Similar results were obtained via ESP charge partitioning.
As can be seen, the central carboxylic group shows higher CAFIs for eletrophilic attacks, defining a susceptible region for metal chelation. Based on this result, the first proton (H+) was removed from this group in all calculations.
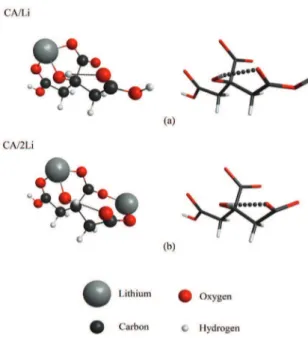
In the complexes of citric acid with lithium, one H+ ion
was removed from CA for each lithium ion present. In the case of CA/Li, after removing the first proton from CA, we added one lithium ion Li+1 near the molecule. The complex
CA/2Li was modelled after the complex CA/Li optimization by subtracting a second H+ from one of the side carboxylic
groups of the CA molecule. We then added a second lithium ion near the complex. The obtained stable final structures are shown in Figure 2 for both citric acid/metal ratios, and agree well with previous results33.
Figure 1. Citric acid structural formula and Condensed-to-Atoms
The results obtained for the infrared spectra are shown in Figure 3. For a pure CA molecule, it is possible to observe bands corresponding to the vibrations of the groups O-H (stretching) at 3650 cm-1, CH2 (stretching)
at 3140 cm-1, C=O (stretching) at 1750 cm-1, COOH
(symmetrical stretching), O-H (in-plane bending), and C-H (wagging) between 1550 cm-1 and 1300 cm-1, C-OH
(stretching) at 1120 cm-1, C-OH (wagging) at 685 cm-1
and COOH (scissoring) at 560 cm-1[34]. Our results show
excellent agreement with experimental data35. For example,
the C=O, C-OH and COOH (1420 cm-1) bands show a
deviation of less than 1%.
Figure 3 shows the influence of the number of lithium ions in the complex. One effect of the addition of Li occurs in bands associated with C=O bonds. In pure CA, this strong band is at 1750 cm-1, shifting to 1714 cm-1 and 1706 cm-1
when one or two lithium ions are added, respectively, owing to the deprotonation of the carboxyl groups. Furthermore, it is possible to see the presence of a new band at 1275 cm-1
for the CA/Li complex, corresponding to the symmetric stretching of the COO- group. The band appears when
carboxyl acts as a monodentate ligand36,37; this gives rise
at the same time to an asymmetric stretching of the COO
-group at 1684 cm-1, which is hidden because of the strong
vibrational mode of the C=O. On the other hand, a carboxyl group acts as a bidentate ligand in the CA/2Li complex, with peaks at 1375 and 1631 cm-1[36-38]. The difference between
the asymmetrical and symmetrical stretching of the COO group for the CA/Li and CA/2Li is in agreement with the criteria presented by Kakihana et al.37 for the bidentate or a
monodentate character of the carboxylic group, compared with a free carboxylic group (COO-), the difference between
the asymmetric and symmetric stretching vibrations being 298 cm-1 (1702 cm-1 and 1404 cm-1, respectively).
Another clear case of the influence of lithium appears in bands associated with O-H and COH bonds, owing to a hydrogen bond that appears between the hydrogen of the hydroxyl (-OH) group and the oxygen of the carbonyl (C=O), which belongs to a carboxylic group37, as shown in
Figure 2 by a dotted line. In the spectrum of CA, the band associated with stretching vibrations of hydroxyl is located at 3630 cm-1. The introduction of one lithium ion causes a
molecule distortion and a new band associated with the OH group appears at 3380 cm-1. This group is bonded to the Li
ion (Li-O-H) and becomes weak bonded with the neighbor carboxylate through a hydrogen bond. This influence becomes stronger and shifts the band to 2860 cm-1 when two
lithium ions are present. Moreover, there is an increase in the CO stretching vibration. In CA, the band associated with such bonds is located at 1129 cm-1 and the maximum shift is
1147 cm-1 and 1163 cm-1 in CA/Li and CA/2Li complexes,
respectively. This means that there is competition between the hydrogen bond and the COH bond. The calculated bond order (which gives the strength of a bond) seems to corroborate this conclusion. In Table 1, we can see that, as the content of Li increases, the C=O bond becomes weaker and the hydrogen bond becomes stronger.
The amount of lithium interferes with the bands in the region between 500 and 1000 cm-1. In CA, the bands in
this region are well defined, with vibrations at 560 cm-1 and
685 cm-1 (COOH and COH), whereas new medium peaks
can be observed at 630 cm-1 owing to the LiO stretching
modes. As the number of lithium ions increases, there is an increase in the number of bands, which will then overlap.
Figure 4 shows the Raman bands for the CA molecule. The intense vibration at 3506 cm-1 is associated with the
asymmetric stretching of OH. It is also possible to observe the CH2 symmetric and asymmetric stretching at 3120 cm-1
and 3085 cm-1, respectively. Other minor bands are also
observed near 1480 cm-1 for the CH
2 symmetric stretching
Figure 2. Optimized structures of complexes formed by one
molecule of citric acid with (a) one and (b) two lithium atoms; the citric acid model is also shown for each complex (color online).
Figure 3. Simulation of infrared spectra for pure citric acid and the complexes with one and two lithium ions (color online).
Table 1. Bond orders for selected groups. Bond
complex
C=O OH
(hydrogen bond)
AC/Li 1.735 0.113
and further bands appear at 1444 cm-1 and 1175 cm-1 that
are also associated with CH2. In the spectra of complexes of CA/Li and CA/2Li, we observe LiO vibrations in the region between 300 and 600 cm-1 (see Figure 4).
Comparison of the simulated Raman spectra of lithium and CA complexes with pure CA shows that the intense bands located in the region between 3600 and 3000 cm-1
in pure CA practically disappear in the complexes. The interval 600-300 cm-1, which in pure CA shows some bands
that are rather weak and not well defined, in the complexes has well defined and intense bands; as the amount of metal increases, these bands become more intense. The bands are attributed to the vibrations of the bonds between the lithium and oxygen atoms, as previously stated.
The marked differences between the complexes CA/Li and CA/2Li are better observed in the infrared spectra. The Raman spectra are very similar, revealing few distinctions except with regard to the intensities of the bands, which it is not possible to determine experimentally. Finally, from these observations we can say that the band that better distinguishes the complexes CA/Li and CA/2Li is located at 1275 cm-1 and 1355 cm-1, respectively, which refers to the
ligand character of the carboxylate group. Moreover, the band at 2851 cm-1 in the infrared spectrum of the complex
CA/2Li indicates a stronger hydrogen bond of the OH stretching vibration. However, it is known that this region is experimentally masked because of the interference of H2O present in the air or absorbed on the surface of the sample while spectroscopy is performed.
In complexes between citric acid and barium, two H+
were subtracted from carboxyl groups for each barium ion present. Considering the metallic ion size, as expected, the CA molecule was less distorted with Ba2+ than it was with Li+
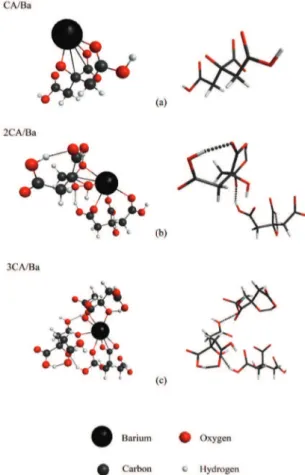
(1.35 and 0.68 Å atomic radii, respectively), which allowed for the formation of hydrogen bonds to fully minimize the energy. Figure 5 presents the optimized structures of the different ratios between CA/Ba complexes, which are 1/1, 2/1, and 3/1. Kakihana and Yoshimura39 found that the CA/
Metal ratio 3/1 is the most stable.
Figure 6 shows a comparison of the simulated infrared spectra of pure CA, CA/Ba, 2CA/Ba, and 3CA/ Ba complexes. Note that each proportion has its own characteristics. The region between 3500 cm-1 and 2250 cm-1
refers to the OH stretching vibrations. The band around 3600 cm-1 is due to free OH bonds, whereas the peaks
at 3500 cm-1, 3000 cm-1, and 2500 cm-1 for the 2CA/Ba
complex and at 3500-3250 cm-1 and 2245 cm-1 refer to
OH influenced by hydrogen bonds. Experimentally, these
bands are hidden because of the water vibrations and adsorbed CO2[34]. Furthermore, the spectrum for the CA/
Ba complex shows the same shift towards smaller values of wavenumbers for the C=O bond at 1730 cm-1 as in the
CA/Li complex, and 2AC/Ba and 3AC/Ba show a defined peak at 1750 cm-1, associated with the presence of more
COOH groups. The asymmetrical and symmetrical COO stretching shows a characteristic monodentate ligand for CA/Ba (1683 cm-1 and 1269 cm-1), monodentate for 2AC/
Figure 4. Simulation of Raman spectra for pure citric acid and
complexes with one and two lithium ions (color online).
Figure 5. Optimized structure for the complex of a barium atom
with (a) one, (b) two, and (c) three molecules of citric acid; the citric acid model is also shown for each complex (color online).
Ba (1707 cm-1 and 1290 cm-1), and bidentate for 3AC/Ba
(1606 cm-1 and 1383 cm-1)37. Moreover, when the number
of citric acid molecules increases, the quantity of BaO and hydrogen bonds also increases, which creates a larger distortion of the complex.
Another effect occurs in the bands associated with the OH, CH, and COH bonds spread in the interval from 1000 to 1500 cm-1. In pure CA, these bands are well defined and
intense once all bonds are vibrating with nearly the same frequency, as described above. With the addition of Ba2+
ion, some bonds experience more interference than others, and this causes them to vibrate at different frequencies. This effect can be observed in the spectra of the 2CA/Ba and 3CA/ Ba complexes through the spreading and decreasing of band intensities related to these bonds. Further, vibrations below 1000 cm-1 due to COOH (scissoring), COH (wagging), and
BaO are spread out in this region.
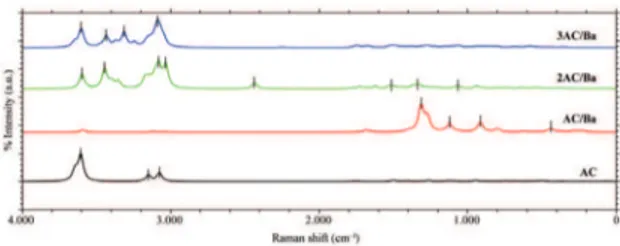
Figure 7 shows a comparison of the Raman spectra for the three simulated proportions. We can identify some unique features in each case. In the CA/Ba case, unlike the other cases, the spectrum shows the most intense bands in the region within the range of 750–1500 cm-1. These bands,
as previously stated, are related to COH, CCO, and BaO vibrations. As we have concluded for the CA+Li complexes, the identification of the different types of CA+Ba complexes can be better accomplished by comparisons of IR spectra.
An estimate for the most stable lithium and barium citrates based on the total energy of the complexes was done using the following expressions:
∆E = (CA/nLi)total energy – n.(Li+)
total energy - K1 (2)
and
∆E = (nCA/Ba)total energy – n.(CA)total energy - K2 (3)
where n is the number of Li+ ions (1, 2) or is the
number of CA molecules (1, 2, 3) in the complexes. As K1 and K2 are constants, which are irrelevant to comparison of the different complexes, they were set to zero; K1 = (CA)total energy + n.(H+)
total energy and
K2 = 2.(H+)
total energy + (Ba+2)total energy (where (H+)total energy is
equal to zero). ∆E is the variation of total energy between the complex and the complex’s components: the larger |∆E| indicates the most stable complex. The results, shown in Figure 8, indicate that AC/Li and 3CA/Ba are probably the most stable complexes, which in the case of barium citrates is in agreement with experimental findings39.
Altogether, our results provide information about the intermediate complexes formed in the MPPM synthesis route. However, it is well known that in an experimental spectrum certain factors have an influence, which were not taken into account in our simulations, such as the interference of the solvent, the presence of impurities, and contaminants such as H2O and CO2. Thus, we believe that, although the bands we mention may be disguised by these interferences, they remain prominent in experimental results and help to distinguish the different complexes.
4. Conclusions
In this study, we presented a set of features for lithium and barium citric acid complexes that allow geometric configurations to be identified from comparisons with the associated bands for infrared and Raman spectra. In this context, IR is preferred over Raman spectra, as it offers features that enable better comparisons. The main features are associated with the vibrations of the groups OH, C=O, COOH, COO-, COH and M-O (M=metal). In comparing the
spectra, we focused our attention on the vibrations of the groups of C=O, COO- and COH when they are in the region
1000 to 2000 cm–1, which is less susceptible to interference
from contaminants.
Further, the most stable complex was estimated based on total energy calculations. For lithium citrates, the CA:Li proportion 1:1 should be the most stable. For barium citrates, the estimate indicates that the CA:Ba ratio 3:1 is probably the most stable complex, which is supported by experimental results.
Acknowledgements
This research was supported by resources supplied by the Center for Scientific Computing (NCC/GridUNESP) of São Paulo State University (UNESP). The authors acknowledge the scholarships UNESP (2010/15588) and Fundação de Amparo à Pesquisa do Estado de São Paulo (FAPESP) (grant 2011/022455) (RMF), Coordenação de Aperfeiçoamento do Pessoal do Ensino Superior (CAPES) (ABN) and Instituto Nacional de Ciência e Tecnologia de Materiais em Nanotecnologia (INCTMN) (CFOG/ABN), and FAPESP for the grant 2007/080720 (PNLF/MM).
Figure 7. Simulation of Raman spectra for pure citric acid and
complexes of barium (color online).
via sol-gel and combustion methods: a comparison. AIP Conference Proceedings. 2011; 1400(1):280-285. http://dx.doi. org/10.1063/1.3663128
3. Wang DQ, Cao LY, Huang JF and Wu JP. Synthesis and electrochemical properties of LiV3O8 via an improved sol-gel process. Ceramics International. 2012; 38(4):2647-2652. http://dx.doi.org/10.1016/j.ceramint.2011.11.030
4. Chiang C, Shei CY, Wu SF and Huang YT. Preparation of high-purity Tl-based ‘1223’ superconductor phase by modified Pechini process in water solution. Applied Physics Letters. 1995; 58(21):2435-2437. http://dx.doi. org/10.1063/1.104865
5. Kakihana M. Sol-gel preparation of high temperature superconducting oxides. Journal of Sol-Gel Science and Technology. 1996; 6(1):7-55. http://dx.doi.org/10.1007/ BF00402588
6. Pathak LC and Mishra SK. A review on the synthesis of Y-Ba-Cu-oxide powder. Superconductor Science and Technology. 2005; 18:67-89. http://dx.doi.org/10.1088/0953-2048/18/9/R01
7. Coey JMD, Viret M and von Molnár S. Mixed-valence manganites. Advances in Physics. 1999; 48(2):167-293. http:// dx.doi.org/10.1080/000187399243455
8. Pullar RO. Hexagonal ferrites: a review of the synthesis, properties and applications of hexaferrite ceramics. Progress in Material Sciences. 2012; 57(7):1191-1334. http://dx.doi. org/10.1016/j.pmatsci.2012.04.001
9. Eerenstein V, Mathur ND and Scott JF. Multiferroic and magnetoelectric materials. Nature. 2006; 442(7104):759-765. PMid:16915279.http://dx.doi.org/10.1038/nature05023 10. Zampieri M, Lazaro SR, Paskocimas CA, Ferreira AG,
Longo E and Varela JA. Structural analysis of Ti and Pb citrate using NMR and FT-Raman signals and quantum mechanics simulations. Journal of Sol-Gel Science and Technology. 2006; 37:9-17. http://dx.doi.org/10.1007/s10971-005-4892-2
11. Coskuner O and Jarvis EAA. Coordination studies of Al-EDTA in aqueous solution. Journal of Physical Chememistry A. 2008; 112(12):2628-2633. PMid:18293948. http://dx.doi. org/10.1021/jp7098575
12. Kovács A, Nemcsok DS and Kocsis T. Bonding interactions in EDTA complexes. Journal of Molecular Structure: THEOCHEM. 2010; 950(1-3):93-97. http://dx.doi. org/10.1016/j.theochem.2010.03.036
13. Yang W and Mortier WJ. The use of global and local molecular-parameters for the analysis of the gas-phase basicity of amines. Journal of American Chemical Society. 1986; 108(19):5708-5711. PMid:22175316. http://dx.doi.org/10.1021/ja00279a008 14. Mineva T. Selectivity study from the density functional
local reactivity indices. Journal of Molecular Structure: THEOCHEM. 2006; 762(1):79-86. http://dx.doi.org/10.1016/j. theochem.2005.08.044
15. Cruz J, Martínez-Aguilera LMR, Salcedo R and Castro M. Reactivity properties of derivatives of 2-imidazoline: An ab initio DFT study. International Journal of Quantum
methods V: Modification of NDDO approximations and application to 70 elements. Journal of Molecular Modeling. 1989; 13(12):1173-1213. PMid:17828561 PMCid:PMC2039871. http://dx.doi.org/10.1007/s00894-007-0233-4
18. Stewart JJP. MOPAC2009. Colorado Springs: Stewart Computational Chemistry; 2008. Available from: <http:// openmopac.net/>. Access in: 03/02/2011.
19. Parr RG and Yang W. Density-functional theory of atoms and molecules. New York: Oxford University Press; 1989. 20. Dunbar RC, Oomens J, Orlova G and Bohme DK. IRMPD
spectroscopic investigation of gas-phase complexes of deprotonated penicillin G with Ba2+, Zn2+ and Cd2+. International Journal of Mass Spectrometry. 2011; 308:330-337. http:// dx.doi.org/10.1016/j.ijms.2011.08.018
21. Stephens PJ, Devlin FJ, Chablowski CF and Frisch MJ. Ab initio calculation of vibrational absorption and circular dichroism spectra using density functional force fields. Journal of Physical Chemistry. 1994; 98:11623-11627. http://dx.doi. org/10.1021/j100096a001
22. Sousa SF, Fernandes PA and Ramos MJ. General performance of density functionals. Journal of Physical Chemistry A. 2007; 111:10439-10452. PMid:17718548. http://dx.doi. org/10.1021/jp0734474
23. Hehre WJ. A guide to molecular mechanics and quantum chemical calculations. California: Wavefunction; 2003. 24. Hay PJ and Wadt WR. Ab initio effective core potentials
for molecular calculations. Potentials for K to Au including the outermost core orbitals. Journal of Chemical Physics. 1985; 82:299-300. http://dx.doi.org/10.1063/1.448975 25. Feller D. The role of databases in support of computational
chemistry calculations. Journal of Computational Chemistry. 1996; 17:1571-1586. http://dx.doi.org/10.1002/
(SICI)1096-987X(199610)17:13%3C1571::AID-JCC9%3E3.0.CO;2-P
26. Levine IN. Quantum chemistry. New York: Prentice Hall; 1999. 27. Lewars EG. Computational chemistry: introduction to the
theory and applications of molecular and quantum mechanics. New York: Springer; 2010.
28. National Institute of Standards and Technology (NIST). Computational chemistry comparison and benchmark database. Available from: <http://cccbdb.nist.gov/vibscalejust. asp>. Access in: 15/06/2011.
29. Schmidt MW, Baldridge KK, Boatz JA, Elbert ST, Gordon MS, Jensen JH et al. General atomic and molecular eletronic-structure system. Journal of Computational Chemistry. 1993; 14(11):1347-1363. http://dx.doi.org/10.1002/ jcc.540141112
30. Allouche AR. Gabedit: a graphical user interface for computational chemistry softwares. Journal of Computational Chemistry. 2011; 32(1):174-182. PMid:20607691. http:// dx.doi.org/10.1002/jcc.21600
Modelling. 1998; 16(3):133-138. http://dx.doi.org/10.1016/ S1093-3263(99)00002-9
32. Kakihana M, Arima M, Nakamura Y, Yashima M and Yoshimura M. Spectroscopic characterization of precursors used in the pechini-type polymerizable complex processing of barium titanate. Chemistry of Materials. 1999; 11(2):438-450. http://dx.doi.org/10.1021/cm9806681
33. Sambrano JR, Zampieri M, Ferreira AG and Longo E. Ab initio study and NMR analysis of the complexion of citric acid with ion lithium. Journal of Molecular Structure. 1999; 493:309-318. http://dx.doi.org/10.1016/S0166-1280(99)00268-7 34. Socrates G. Infrared and raman characteristic group frequency.
New York: Wiley; 2011.
35. Smith AL. The coblentz society desk book of infrared spectra. Kirkwood: The Coblentz Society; 1982. p. 1-24.
36. Chen HJ, Jian PC, Chen JH, Wang L and Chiu WY. Nanosized-hybrid colloids of poly(acrylic acid)/titania prepared via in situ
sol-gel reaction. Ceramics International. 2007; 33(4):643-653. http://dx.doi.org/10.1016/j.ceramint.2005.12.012
37. Kakihana M, Nagumo M, Okanoto M and Kakihana H. Coordination structures for uranyl carboxylate complexes in aqueous-solution studied by IR and carbon-13 NMR spectra. Journal of Physical Chemistry. 1987; 91(24):6128-6136. http:// dx.doi.org/10.1021/j100308a015
38. Stokenhuber M, Mayer H and Lercher JA. Preparation of barium titanate from oxalates. Journal of American Ceramics Society. 1993; 76(5):1185-1190. http://dx.doi. org/10.1111/j.1151-2916.1993.tb03738.x