ASSESSMENT OF CYTOKINE VALUES IN SERUM BY RT-PCR IN HIV-1 INFECTED INDIVIDUALS WITH AND WITHOUT HIGHLY ACTIVE ANTI-RETROVIRAL THERAPY
(HAART)
MEIRA DA (1), ALMEIDA RAMB (1), BARBOSA AN (1), DE SOUZA LR (1), OLIVO TET (1), HENRIQUES RMS (1), GOLIM MA (1), ARAÚJO JR JP (2), NAGOSHI LR (1),
ORIKAZA CM (1), CALVI SA (1)
(1) Department of Tropical Diseases, Botucatu Medical School, São Paulo State University, UNESP, Botucatu, São Paulo State, Brazil; (2) Department of Microbiology and Immunology, Botucatu Bioscience Institute, São Paulo State University, UNESP, Botucatu, São Paulo State, Brazil.
ABSTRACT: A cross-sectional study was performed on HIV-1 infected individuals with or without antiretroviral treatment (ARV) in the AIDS Day Hospital, Botucatu Medical School, UNESP. Between August 2004 and October 2005, 73 HIV-1 infected individuals were divided into three groups: infected individuals with or without AIDS who had never received ARV (G1 = 15); patients on HAART that had had plasma HIV-1 RNA viral load (VL) equal to or greater than 50 copies/mL (G2 = 27); and patients on HAART with undetectable VL for at least the past six months (G3 = 31). There was also an additional group that comprised blood donors without any sign of the disease and with negative HIV serum tests (G4 = 20), which was the control group. Serum cytokine levels (values in pg/mL) were measured by enzyme-linked immunosorbent assay (ELISA) and specific mRNA expression by reverse transcription polymerase chain reaction (RT-PCR). Both techniques were performed on the four groups for TNF-α, IL-2, INF-γ, IL-4 and IL-10. All patients were submitted to VL determination and CD4+ and CD8+T lymphocyte counts. The analysis of the results revealed a significant comparison among groups for both methods and an association between the latter (> 80% – r2 > 0.80). There was only one exception, in control individuals for IL-2 by ELISA. The cytokine profiles, in both methods, for the three patient groups, were mature Th-0. The behaviors of IL-2 and INF-γ required emphasis due to consequent expression of dominant Th profile. Both methods showed low IL-2 and high mean values of INF-γ in the three groups. Several authors have recently drawn attention to the substantial apoptosis of infected and non-infected CD4+T cells, mainly during primary infection, persisting only in those with
INF-γ phenotype producer and not IL-2. HIV infected individuals submitted to HAART are expected to produce IL-2 in an attempt to present Th-1 profile, but in most cases this did not occur.
KEY WORDS: RT-PCR, ELISA, cytokines, HIV, AIDS, HAART, apoptosis.
CONFLICTS OF INTEREST: There is no conflict.
FINANCIAL SOURCE: FAPESP.
TRIAL REGISTRATION NUMBER: NCT00746473 in the Clinical Trials.gov.
CORRESPONDENCE TO:
DOMINGOS ALVES MEIRA, Departamento de Doenças Tropicais e Diagnóstico por Imagem, Faculdade de Medicina de Botucatu, UNESP, Distrito de Rubião Júnior s/n, Botucatu, SP, 18618-000, Brasil. Phone: +55 14 3811 6212. Fax: +55 14 3815 9898.
INTRODUCTION
Highly active anti-retroviral therapy (HAART) causes important interference in the
natural history of HIV-1 infection. Haase (9) reported the impact of this treatment on
suppressing viral replication that could be observed by VL determination. However,
even with this vigorous action, the treatment did not completely eliminate the virus.
Pierson et al. (20), considering the half-life of latently infected cells which are HIV-1
reservoirs, applied a mathematical model and concluded that more than 60 years of
treatment would be required to eradicate this compartment. Regarding HIV surrogate
markers, VL has been of great use, as the reduction in number of RNA copies per
mL of plasma, often not detectable, has become an eloquent indicator of therapeutic
action. The clinical evolution of concomitant patients shows increased survival, easier
control of opportunistic infections, and a reduction in the number of deaths for
patients under treatment (16). According to Gougeon et al. (7) the other surrogate
marker, represented by CD4+T/mm3, which can give information on suppression level
or immune system recovery level in patients under treatment, is influenced by
complex mechanisms with complicate interpretation. Carcelain et al. (2), discussing
immune reconstitution during HIV infection under HAART, mentioned three
mechanisms involved in CD4+T lymphocyte recuperation, which are: redistribution of
memory CD4+T cells from tissues where they have been previously sequestered;
regeneration of virgin thymus cells; and reduction of inflammatory process. In this
manner, CD4+T count does not reflect the real number of virgin, memory, or
recirculating CD4+T cells after the reduction of therapeutic viral replication.
Additionally, quantitative evaluation of these cells does not inform us which cytokines
they are producing. Haase (9), referring to naïve CD4+T cell repopulation during
treatment, mentioned that they slowly increase, but only many months after therapy
introduction. According to the latter author, immunity regeneration is slow, variable
and partial.
The main problem concerning HIV-1 infected individuals, when they are submitted to
HAART, is the evaluation of immune function under this therapy interference. It is
necessary to search for other markers to notice whether or not there is immunological
recovery (4, 5). Cytokine levels and the knowledge of their respective profiles can be
Clerici and Shearer (3), in 1993, were the first to propose the use of cytokines as
progression markers for AIDS, which can be indicated by a drop in IL-2 and INF-γ
and a concomitant increase in IL-4 and IL-10. Meira et al. (14, 15), in previous
publications, demonstrated the importance of cytokines as evolution markers, mainly
regarding HAART. Imami et al. (11), in 1999, studied Th-1/Th-2 cytokine profiles in
nine HIV patients before and during HAART by amplification and detection of specific
cDNA, using real-time PCR. They suggested that the determination of cytokine
profiles in HIV-1 in these two periods could complement information from VL and
CD4+T/mm3 cell count (11). This permitted to verify how the treatment affected the
immune recovery in these patients.
The objectives of the current study were: to evaluate the role of serum cytokines
levels (TNF-α, INF-γ, IL-2, IL-4, and IL-10) and mRNA expression by real-time PCR,
compare these two methods and examine Th-1, mature Th-0, and Th-2 cytokine
profiles. Therefore, a cross-sectional study was employed to analyze three patient
groups: “treatment virgins”; HAART with detectable VL; and HAART without
detectable VL.
PATIENTS AND METHODS Patients
Between August 2004 and October 2005, 73 HIV-1 infected individuals, ill and not ill,
were monitored at the Specialized Outpatient Service and Day Hospital for AIDS
patients, part of the medical complex of Botucatu Medical School, UNESP. All
persons had a history compatible with HIV-1 infection, with either positive ELISA or
Western blot. Among them, 38 were female and 35 male and their ages ranged from
22 to 66 years old (mean: 40 years). Twenty normal blood donors from the Botucatu
Hemocenter were also included, 16 were male and four female and aged between 19
and 62 years old (mean: 37 years).
Methods
● Groups
Group 1 (G1): 15 HIV-1 infected individuals, with or without AIDS, who had never
received ARV. These patients had not yet been indicated for ARV, or had had HIV-1
this group were the only ones who were not on ARV treatment, thus could be
considered as representatives of the natural history of HIV infection. Patients in the
other two groups were under the influence of treatment.
Group 2 (G2): 27 HIV-1 infected individuals, sick or not, on ARV treatment, five with
two nucleoside/nucleotide reverse transcriptase inhibitors (NRTI) and one
non-nucleoside reverse transcriptase inhibitor (NNRTI); and 22 on HAART with two NRTI,
or one NRTI and one NNRTI, and one protease inhibitor (PI), and VL equal to or
greater than 50 copies of plasma RNA/mL.
Treatment duration in this group varied between three and 145 months (mean: 53.6
months; median: 42 months).
Group 3 (G3): 31 HIV-1 infected individuals on ARV treatment, 16 on HAART with two
NRTI, or one NRTI and one NNRTI, and one PI, and 15 with two NRTI and one
NNRTI. All G3 patients had undetectable VL for at least the past six months.
Treatment in this group varied between five and 108 months (mean: 48.1 months;
median: 42 months). In both groups G2 and G3, all individuals were under ARV
treatment and classified as positive (G2) or undetectable (G3) VL, which indicates a
clear distinction between them concerning viral activity and, consequently, presents
an important factor that must be considered for the interpretation of HIV-1
pathogenicity (12).
Group 4 (G4): 20 blood donors without any clinical complaints and negative for
anti-HIV-1/2 antibodies. None of them presented any sign of the disease.
Parameters considered
● Clinical parameters
All 73 infected individuals were submitted to clinical observation that included
HIV-associated opportunistic diseases at the time of blood collection for cytokine
detection.
● Laboratorial parameters
The 73 persons (G1, G2, and G3) were submitted at same time to: VL determination;
CD4+T and CD8+T/mm3 lymphocyte count; and TNF-α, INF-γ, IL-2, IL-4 and IL-10
serum cytokine determination by amplification and detection of cytokine-specific
● HIV-1 plasma viral load determination
Infected individuals were tested for HIV-1 plasma VL by the bDNA HIV-1 RNA QT
system. The low limit for detection by this method was considered 50 copies/mL.
● CD4+T and CD8+T/mm3 lymphocyte counts
The numbers of CD4+ and CD8+ T cells were measured from all HIV-infected patients
in G1, G2, and G3 using four-color flow cytometry and the commercially available
Multitest IMK® kit (Becton Dickinson, USA) (13).
● Serum cytokine determination
We collected 8 mL of blood, in a dry tube, from 73 HIV-1 (G1, G2, and G3) and 20
normal (G4) individuals. The serum was immediately separated, aliquoted and stored
at –70οC. Serum cytokine determination was performed between four and 12 weeks
after storage. TNF-α, INF-γ, IL-2, IL-4 and IL-10 cytokines were determined by
ELISA, with Human Quantikine® kits (R&D Systems, USA). Initially, 96 microplates
were sensitized with anti-cytokine monoclonal antibody (TNF-α, INF-γ, IL-2, IL-4 and
IL-10). Subsequently, 200 μL of test serum, positive and negative controls, was
added (dilution 1:2) to the samples that, afterwards, were incubated at 37°C for
periods ranging from 30 to 60 minutes, depending on the cytokine. Four washes
were carried out with detergent solution containing 2-chloroacetamide (0.1%). This
was repeated until the phase preceding substrate addition. Then, biotin marked
plates received streptavidin-peroxidase. After incubation, a substrate containing
hydrogen peroxide (0.02%) and tetramethylbenzene (2%) was added. The reaction
was interrupted at room temperature with 2N sulfuric acid. Results were evaluated by
optical density (OD) on a Multiskan analyser (EFLAB, Finland) reader at 450 nm.
Serum cytokine concentrations were calculated from a standard curve (15, 17). The
detection limits of serum cytokines were 15.6 to 1,000 pg/mL for TNF-α and IFN-γ,
31.2 to 2,000 pg/mL for IL-2, 1.6 to 5,000 pg/mL for IL-4 and 3.2 to 10,000 pg/mL for
IL-10.
● Cytokine dosage by amplification and specific cDNA detection using real-time PCR
Peripheral blood mononuclear cells (PBMC) were obtained from heparinized blood
by means of standard Histopaque-1077® (Sigma-Aldrich, USA) gradient
centrifugation (1). Total RNA was extracted from PBMC immediately after the
instructions. DNase digestion of RNA solution was carried with DNase (RQ1
RNase-Free DNase®, Promega, USA). The Platzer and Blankestein (21) technique was
employed to obtain cDNA. Semi-quantitative RT-PCR was performed in real time
(7300 Real Time PCR System®, Applied Biosystems, USA) using Lux primers
(Certified Lux® Primer Set, Invitrogen, USA) for the following cytokines: IL-2
(GenBank accession number NM 000586); IL-4 (GenBank accession number NM
000589); IL-10 (GenBank accession number NM 000572); INF-γ (GenBank
accession number NM 000619); and TNF-α (GenBank accession number NM
000594); β-actin (GenBank accession number NM 001101-2) – used for
housekeeping reactions. Platinum PCR Supermix® (Invitrogen, USA) was utilized for
the PCR reaction. Samples were distributed on 96-well plates and amplified in real
time under the following incubation conditions: 2 minutes at 50°C and 95°C, 45
cycles at 95°C for 15 seconds, 55°C and 72°C for 30 seconds during which
fluorescence data were obtained. The threshold cycle (Ct) reflects the cycle number
at which the fluorescence generated within a reaction cross the threshold. The Ct
value assigned to a particular well thus reflects the point during the reaction at which
a sufficient number of amplicons have accumulated, in that well, to be at a
statistically significant point above the baseline (18). One member of the normal
group (G4) was randomly selected for serial dilutions of cDNA, which was used as a
standard cytokine quantification reference. Results expressed as Ct values for β-actin
and cytokines, for each individual, were corrected based on values from the normal
individual according to the standard real-time calculation.
● Statistical analysis
Mean (X ), standard deviation (SD) and median (Md) were calculated for each group.
Comparison among groups G1, G2, G3 and G4 – regarding serum cytokines,
amplification and detection of specific cDNA – was made by non-parametric
Kruskal-Wallis test (26), with H and p statistics (chi-square distribution) and considering
differences between group means (p < 0.05). Similarity between ELISA and RT-PCR
methods was studied by linear correlation coefficient between two measurements
and after the linear regression equation Y = f (X), where Y = RT – PCR and X =
ELISA, with the respective coefficient of determination (r2). A correlation was
considered significant when r2 > 0.60 and high when r2 > 0.80. CD4+T and
Kruskal-Wallis test) were compared among groups G1, G2 and G3 (26). Serum and
real-time PCR cytokine normal values were obtained by X +1SD of their respective
values from the control group (G4) (26). Thus, Th-1, mature Th-0 and Th-2 subsets
were defined by their normal values according to Spellberg and Edwards (22). These
authors considered mature Th-0 profile in situations where the CD4+T cells produced
elevated levels of INF-γ and IL-4. Other authors have also reported Th-0 profile (6, 8,
19). The proportions of PI regimens in G2 and G3 and treatment duration in each
group submitted to HAART (G2 and G3) were compared by the χ2 (chi-square) test
(26).
RESULTS HAART
● ARV treatment scheme
Twenty-two patients from G2 received protease inhibitors associated with two NRTI
or one NNRTI and one NRTI. The other five patients in this group were treated with
two NRTI and one NNRTI. Sixteen G3 patients received protease inhibitors
associated with two NRTI or one NNRTI and one NRTI. The other fifteen received
two NRTI and one NNRTI. There was statistical difference between groups in relation
to protease inhibitor (χ21 = 6.99;p < 0.01; G2 > G3).
● Treatment duration
Comparison between treatment groups showed no statistical difference with respect
to duration. Seventeen G2 patients were treated for a period of three to 60 months
and the other ten, for a period of 61 to 145 months. Twenty-two G3 patients were
treated for three to 60 months and the other nine, for 61 to 145 months (χ21= 0.41;
not significant).
CD4+ and CD8+T lymphocyte counts
Median (Md), mean (X ) and standard deviation (SD) values of CD4+T
lymphocytes/mm3 in the patient groups were:
– G1: Md = 313; X = 383; and SD = 229;
– G2: Md = 334; X = 334; and SD = 186;
Comparison between groups showed no statistical difference (H = 4.371; p > 0.10;
G1 = G2 = G3). Median (Md), mean (X ) and standard deviation (SD) values of CD8+T
lymphocytes/mm3 were:
– G1: Md =739; X = 951; and SD = 619;
– G2: Md =777; X = 886; and SD = 473;
– G3: Md =729; X = 745; and SD = 315.
Comparison between groups showed no statistical difference (H = 1.281; p > 0.10;
G1 = G2 = G3).
VL behavior
VL mean for G1 patients was 31,231 copies/mL (log 4.49), and for G2 patients was
8,779 copies/mL (log 3.94).
Comparison and correlation of cytokine levels in serum (ELISA) and by amplification and specific cDNA detection using real-time PCR (RT-PCR)
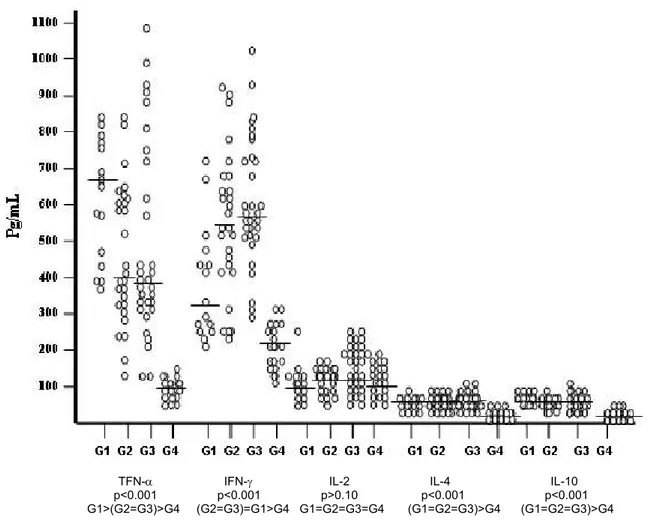
Figure 1 shows the distribution of cytokine values (TNF-α, INF-γ, IL-2, IL-4 and IL-10)
obtained through serum dosage by ELISA. The graph shows individual values for
each cytokine and the horizontal line in each column refers to the median values
obtained from the respective study group. Analysis of this figure suggests that TNF-α
values decrease in the comparison among patient groups (G1 to G3), but remain
elevated in relation to controls (G4). The drop may be due to the antiretroviral
treatment in G2 and G3. INF-γ presented opposite behavior and increased from G1 to
G3, which could also be due to the antiretroviral treatment. IL-2 however, remained
low, not differing from normal values (G4), and presented the same median level in
the four groups. This fact could be associated with a possible incapacity of CD4+T
cells, in HIV-1 infected individuals, to produce IL-2, even in patients under treatment
or with undetectable VL. The latter finding suggests that a potent combined
antiretroviral treatment is effective as it improves the life condition of patients, permits
better control of opportunistic infections and increases survival in infected individuals.
However, this type of treatment is not completely efficacious, since incapacity to
perform HIV-1 clearance, or increase IL-2 production, suggests an inability to induce
TFN-α IFN-γ IL-2 IL-4 IL-10 p<0.001 p<0.001 p>0.10 p<0.001 p<0.001 G1>(G2=G3)>G4 (G2=G3)=G1>G4 G1=G2=G3=G4 (G1=G2=G3)>G4 (G1=G2=G3)>G4
Figure 1. Distribution of serum cytokine values per group (ELISA).
= median
G1: 15 HIV-1 patients virgin to treatment; G2: 27 HIV-1 patients under HAART with detectable VL; G3:
31 HIV-1 patients under HAART with undetectable VL; G4: 20 normal blood donor volunteers.
Figure 2 presents cytokine level distribution in mononuclear cells by RT-PCR. Median
values of TNF-α and INF-γ for each group (G1 to G3) show a similar behavior to
Figure 1, which reveals similarity between both methods (ELISA and RT-PCR). There
was a small increase in IL-2 levels in treatment virgin patients (G1) when compared to
persons under treatment that presented detectable VL (G2), while there was a
analysis revealed that IL-2 values were equal in these groups. In this sense, IL-2
behavior was the same in both measurement methods, which displays an association
between them. If its behavior in patients is judged, there is no desirable IL-2
production even with antiretroviral treatment and when VL is reduced.
Figure 2. Distribution of mononuclear cell cytokine values per group (RT-PCR).
= median
G1:15 HIV-1 patients virgin to treatment; G2: 27 HIV-1 patients under HAART with detectable VL; G3:
Table 1 demonstrates the statistical results from the comparison among groups
regarding cytokine levels by both methods (ELISA and RT-PCR). Groups were
compared by analysis of variance using the non-parametric Kruskal-Wallis method.
All values show statistical significance, except for IL-2 by ELISA. This method was
chosen the most consistent and, therefore most rigorous, mainly because there was
no normal serum cytokine values determined by RT-PCR (26).
Table 1. Comparison and correlation of cytokine values in serum (ELISA) and in
mononuclear cells (RT-PCR) in HIV-1 infected patients and normal individuals
distributed into groups
Statistics
Calculated ELISA RT-PCR
Significance ELISA RT-PCR
Comments
CYTOKINES
ELISA RT-PCR
TNF-α H = 49.897 H = 47.737 p < 0.001 p < 0.001 G1 > (G2 = G3) > G4 (G1=G2=G3)>G4 INF-γ H = 47.678 H = 49.614 p < 0.001 p < 0.001 (G2 = G3) > G1 > G4 (G2 = G3) > G1 > G4 IL-2 H = 4.094 H = 49.146 p > 0.10 p < 0.001 G1 = G2 = G3 = G4 (G1 = G2 = G3) > G4 IL-4 H = 47.658 H = 47.231 p < 0.001 p < 0.001 (G1 = G2 = G3) > G4 (G1 = G2 = G3) > G4 IL-10 H = 48.066 H = 46.845 p < 0.001 p < 0.001 (G1 = G2 = G3) > G4 (G1 = G2 = G3) > G4
Equation: ELISA (X) / RT-PCR (Y); Y = 10.72 + 0.12 X Coefficient
CYTOKINES
Linear correlation Determination Comments TNF-α r = 0.93; p < 0.001 r2 = 0.87 Positive correlation INF-γ r = 0.89; p < 0.001 r2 = 0.79 Positive correlation IL-2 r = 0.46; p < 0.05 r2 = 0.21 Weak correlation IL-4 r = 0.93; p < 0.001 r2 = 0.86 Positive correlation IL-10 r = 0.91; p < 0.001 r2 = 0.82 Positive correlation
Both methods were studied by linear correlation between two measurements
followed by linear regression, which revealed an association among almost all
cytokines (except for IL-2). Consequently, ELISA and RT-PCR methods
demonstrated analogous behaviors.
Tables 2 and 3 respectively display medians, means and standard deviations of
cytokine values obtained in serum by both ELISA and amplification and detection of
specific cDNA by RT-PCR. The tables also demonstrate the normal values obtained
in the same manner (mean + 1 SD) from the control group (G4) as well as the Th
subset from each group.
Table 2. Distribution of serum cytokine values by group (ELISA)
Serum cytokines (pg/mL)
Th subset Groups
IL-2 IL-4 IL-10
IFN-γ TNF-α
Md / / SD Md / / SD Md / / SD / SD Md / / SD
Md / X X X X X
G1 674 / 619 / 168 314 / 382 / 163 108 / 116 / 50 46 / 49 / 16 51 / 56 / 15 Mature Th0 G2 404 / 463 / 186 531 / 555 / 199 128 / 123 / 29 40 / 47 / 17 42 / 50 / 22 Mature Th0 G3 389 / 486 / 265 589 / 610 / 178 124 / 120 / 32 42 / 44 / 19 41 / 49 / 22 Mature Th0 G4 97.5 / 98 / 25 209 / 214 / 64 103.5 / 109 / 43 10 / 8 / 4 9 / 8 / 6 Normal
Normal values
123 278 152 12 14 ____
(XG4 + 1SD)
G1:15 HIV-1 patients virgin to treatment; G2: 27 HIV-1 patients under HAART with detectable VL; G3: 31 HIV-1 patients under HAART with undetectable VL; G4: 20 normal blood donor volunteers; Md: median; X: mean; SD: standard deviation.
Table 3. Distribution of mononuclear cell cytokine values by group (RT-PCR)
Mononuclear cell cytokine (% mRNA expression)
Th subset Groups
IL-2 IL-4 IL-10
TNF-α IFN-γ
Md / / SD Md / / SD Md / / SD
Md / X / SD Md / X / SD X X X
G1 62 / 58 / 18 46 / 46 / 25 47 / 47 / 17 62 / 62 / 18 65 / 68 / 20 Mature Th0 G2 49 / 50 / 21 66 / 62 / 25 56 / 56 / 16 51 / 60 / 21 55 / 64 / 25 Mature Th0 G3 46 / 52 / 26 63 / 68 / 25 48 / 50 / 15 52 / 58 / 24 70 / 67 / 25 Mature Th0 G4 –12 / –11/ 10 –15.5 / –11 / 16 –22 / –17 / 18 –22 / –29 / 21 –20.5 / –28 / 20 Normal
Normal values
–1 5 1 –8 –8 ____
(X G4 + 1SD)
Definition of Th-1, mature Th-0 and Th-2 subsets (22)
Given that no normal standard exists for serum cytokine levels obtained by ELISA or
for mononuclear cell cytokine by RT-PCR, there was a need to establish a normal
value for each method. For this, 20 normal individuals – who had no clinical sign of
the disease and were tested negative for HIV-1 infection – were recruited for G4
group. To find normal values for each cytokine, means were calculated for this
control group and were added to one standard deviation; this result was considered
normal. Cytokine profiles were made by comparing normal values with those from G1,
G , and G2 3 in each method (ELISA or RT-PCR). Results showed that mature Th-0
was the dominant profile in both serum levels (ELISA) and mononuclear cell
determinations (RT-PCR) (Tables 2, 3 and 4).
Table 4. Serum and mononuclear cell cytokine subsets according to normal values,
obtained by X +1SD of their respective normal group values (G )* 4
IFN-γ IL-2 IL-4 IL-10
Subset
(pg/mL) (% mRNA) (pg/mL) (% mRNA) (pg/mL) (% mRNA) (pg/mL) (% mRNA)
Th1 > 278 > 5 > 152 > 1 < 12 < -8 < 14 < -8 Mature Th0 > 278 > 5 ≤ 152 ≤ 1 > 12 > -8 > 14 > -8 Th2 < 278 < 5 < 152 < 1 > 12 > -8 > 14 > -8 * Adapted from Spellberg and Edwards (22).
DISCUSSION
Cytokines levels obtained by ELISA in serum and by RT-PCR in mononuclear cells
were compared among groups. This comparison revealed statistical significances for
all cytokines, except for IL-2. It was the only cytokine that, although statistically
significant, did not distinguished groups by ELISA in serum; this ascertaining drew
attention to IL-2. In addition, normal individuals presented lower levels of cytokines
by both methods, with the exception of IL-2 by ELISA. Furthermore, significance was
found for all proteins by ELISA and RT-PCR in linear correlation. However, IL-2
significance level (p) was lower. These findings suggest that similarity indeed exists
between the two methods.
In an earlier publication, Meira et al. (15) exposed the serum cytokine behavior in a
groups following the same criteria applied to the current study. They observed that no
patient in any group had a Th-1 or a virgin Th-0 profile, because mature Th-0
predominated in all groups (22). Low proportions of Th-2 profile were also recorded
in a few patients from each group. The absence of Th-1 and the presence of Th-2
profile in the three groups implied that there was no increase of IL-2 and INF-γ in
these patients, even after treatment. In the present study, IL-2 also showed positive
correlation with INF-γ and CD4+T cells and negative correlation with VL, TNF-α, IL-4
and IL-10, supporting the proposal that IL-2 could be an important marker for immune
recuperation in HIV-1 infections, along with VL and CD4+T determination. In this
sense, only CD4+T cell count without cytokine levels may hinder immune recovery
interpretation under ARV treatment, as this process can increase these cell counts
but without a corresponding rise in IL-2.
Jansen, Baarle and Miedema (12), regarding HIV-1 infection evolution, once asked:
what is in control? Could it be HIV-specific CD4+T cells? Or viremia (VL)? They
reported that in infected individuals with increased VL, virgin and HIV-specific CD4+T
memory cells are continually activated and preferentially induced to differentiate into
INF-γ producers (12), namely Tem2 cells (IL-2-INF-γ+CD45RA– CCR7–). The latter
cells do not have the capacity to produce IL-2 and proliferate; they are only capable
of producing INF-γ. The current study findings agree with these previous
investigations (12, 25).
The interpretation of present results took into account the behaviors of IL-2 and
INF-γ, and, therefore, their repercussions on dominant Th profile. Additionally, it was necessary to consider that mean values of serum IL-2, obtained by ELISA, were
lower than normal in the three patient groups. RT-PCR method, in turn, found low
means that were statistically equal among groups, but a little higher than the control
individuals. In contrast, INF-γ mean values were always greater by both methods,
more than twice the normal mean value. Consequently, mature Th-0 profile was
predominant in G1, G2 and G3 in both studied methods. This observation coincides
with the analysis made by Jansen, Baarle and Miedema (12), in which virgin or
HIV-specific CD4+T memory cells are continually activated. Immune activation increases
VL, causing a depletion in CD4+T cells and, therefore, in AIDS (12). On one hand,
these authors inferred the behavior of individuals with rapid progression from those
activated, inducing differentiation only into INF-γ producers (IL-2-INF-γ+ CD45RA–
CCR7–) (12). And, on the other hand, they deduced the behavior from long-term
non-progressors (LTNP) individuals, which present low viremia and their CD4+T cells
have an IL-2+ INF-γ+ CD45RA–CCR7+ phenotype producer. The CD4+T cells – IL-2
and both IL-2 and INF-γ producers – are found in LTNP, but not in those with rapid
progression (24).
Hel, McGhee and Mestecky (10), referring to the mystery of HIV progression,
mentioned other agents like Mycobacterium tuberculosis, cytomegalovirus and the
herpes viruses, as examples of pathogens that had afflicted humans in the distant
past and had sufficient time to pass through mutual adaptations, both in the infection
and immune processes. HIV-1, however, has been infecting humans for few decades
and has not yet had enough time to develop these mutual adaptations. For this
reason, the infection that causes AIDS is recently in a wild and aggressive phase.
Quoting these authors (10): “There is an irrefutable proof of a drop in CD4+T cells
early in HIV-1 infection, mainly in lymphatic and intestine tissues”. These cells are
destructed by apoptosis, in which INF-α participates in the elimination of thymocytes.
There are many mechanisms, induced by HIV, that lead to cell death, from the virus
protease to IL-7 in the thymus including the syncytium formation (23).
Hel, McGhee and Mestecky (10) mentioned that the eradication of initial viremia from
HIV-1 infection by natural resistance, early in anti-retroviral treatment or even by the
use of vaccines that can protect the CD4+T memory, may result in immune recovery.
CONCLUSIONS
The results of the current study allow us to state that there is an association between
the two methods employed to measure cytokine levels, except for IL-2 values. The
different behaviors between ELISA and RT-PCR regarding this cytokine cannot be
explained based on result analysis. Therefore, other studies are necessary to
investigate this unexpected behavior.
Judging by the persistently low level of IL-2, even in individuals under HAART for
several years and with undetectable viral load, these patients do not show any
ACKNOWLEDGMENTS
This work was supported by the State of São Paulo Research Foundation (FAPESP),
grant 01/14297-8.
ETHICAL APPROVAL
This study was approved by the Ethics Research Committee of Botucatu Medical
School, São Paulo State University, UNESP, Botucatu, São Paulo State, Brazil.
REFERENCES
1 BOYUM A. Separation of leukocytes from blood and bone marrow. Introduction.
Scan. J. Clin. Lab. Invest. Suppl., 1968, 97, 7.
2 CARCELAIN G., LI T., RENAUD M., DEBRE P., AUTRAN B. Immune
reconstitution of the CD4+T-Cell compartment in HIV infection. In: COSSARIZZA A.,
KAPLAN D. (Eds.) Cellular aspects of HIV infection. New York: Willey-Liss Inc., 2002.
p. 399-422.
3 CLERICI M., SHEARER GM. A TH-1/TH-2 switch is a critical step in etiology of HIV
infection. Immunol. Today, 1993, 14, 107-11.
4 CLERICI M., BALOTTA C., SALVAGGIO A., RIVA C., TRABATTONI D.,
PAPAGNO L., BERLUSCONI A., RUSCONI S., VILLA ML., MORONI N., GALLI M.
Human immunodeficiency virus (HIV) phenotype and interleukin-2/interleukin-10 ratio
are associated markers of protection and progression in HIV infection. Blood, 1996,
88, 574-9.
5 CLERICI M., GALLI M., BOSIS S., GERVASONI C., MORONI M., NORBIATO G.
Immunoendocrinologic abnormalities in human immunodeficiency virus infection.
Ann. N. Y. Acad. Sci., 2000, 917, 956-61.
6 GERLI R., LUNARDI C., VINANTE F., BISTONI O., PIZZOLO G., PITZALIS C.
Role of CD30+ T cells in rheumatoid arthritis: a counter-regulatory paradigm for
Th1-driven diseases. Trends Immunol., 2001, 22, 72-7.
7 GOUGEON ML., LOECOUER H., PINTO LMO., LEDRU E. Homeostasis and
restoration of the immune system in HAART-treated HIV-infected patients: implication
of apoptosis. In: COSSARIZZA A., KAPLAN D. (Eds.) Cellular aspects of HIV
8 GREWE M., BRUIJNZEEL-KOOMEN CA., SCHÖPF E., THEPEN T.,
LANGEVELD-WILDSCHUT AG., RUZICKA T., KRUTMANN J. A hole for Th1 and
Th2 in the immunopathogenesis of atopic dermatitis. Immunol. Today, 1998, 19,
359-61.
9 HAASE AT. Population biology of HIV-1 infection: viral and CD4+ T cell
demographics and dynamics in lymphatic tissues. Annu. Rev. Immunol., 1999, 17,
625-56.
10 HEL Z., MCGHEE JR., MESTECKY J. HIV infection: first battle decides the war.
Trends Immunol., 2006, 27, 274-81.
11 IMAMI N., ANTONOPOULOS C., HARDY GA., GAZZARD B., GOTCH FM.
Assessment of type 1 and type 2 cytokines in HIV type 1-infected individuals: impact
of highly active antiretroviral therapy. AIDS Res. Hum. Retroviruses, 1999, 15,
1499-508.
12 JANSEN CA., VAN BAARLE D., MIEDEMA F. HIV-specific CD4+ T cells and
viremia: who′s in control? Trends Immunol., 2006, 27, 119-24.
13 KAMPMANN B., TENA-COKI GN., NICOL MP., LEVIN M., ELEY B.
Reconstitution of antimycobacterial immune responses in HIV-infected children
receiving HAART. AIDS, 2006, 20, 1011-18.
14 MEIRA DA., ANTUNES MC., SOUZA LR., MARCONDES-MACHADO J., CALVI
SA., LIMA CRG., HENRIQUES RMS., PARDINI MI., SILVA VA., IUAN FC., CURI
PR. Nível sérico de citocinas como indicadores de fase evolutiva em indivíduos com
infecção pelo HIV-1, doentes ou não. J. Bras. AIDS, 2000, 1, 17-27.
15 MEIRA DA., SOUZA LR., CALVI SA., LIMA CRG., HENRIQUES RMS., PARDINI
MI., SILVA VA., IUAN FC., MARCONDES-MACHADO J. Correlation between
cytokine serum levels, number of CD4+T cells/mm3 and viral load in HIV-1 infected
individuals with or without antiretroviral therapy. J. Venom. Anim. Toxins incl. Trop.
Dis., 2004, 10, 293-310.
16 MELLORS JW., RINALDO JR CR., GUPTA P., WHITE RM., TODD JA.,
KINGSLEY LA. Prognosis in HIV-1 infection predicted by the quantity of virus in
plasma. Science, 1996, 272, 1167-70.
17 MOSMANN TR. Cytokine patterns during the progression to AIDS. Science, 1994,
18 PEETERS D., PETERS IR., CLERCX C., DAY MJ. Real-time RT-PCR
quantification of mRNA encoding cytokines, CC chemokines and CCR3 in bronchial
biopsies from dogs with eosinophilic broncopneumopathy. Vet. Immunol.
Immunopathol., 2006, 110, 65-77.
19 PERUSSIA B., LOZA MJ. Linear “2-0-1” lymphocyte development: hypotheses on
cellular bases for immunity. Trends Immunol., 2003, 24, 235-41.
20 PIERSON T., MCARTHUR J., SILICIANO RF. Reservoirs for HIV-1: mechanisms
for viral persistence in the presence of antiviral immune responses and antiretroviral
therapy. Annu. Rev. Immunol., 2000, 18, 665-708.
21 PLATZER C., BLANKENSTEIN T. Polymerase chain reaction to quantitative
cytokine mRNA. In: BALKWILL FR. (Ed.) Cytokines: a practical approach. Oxford:
Oxford University Press, 1995. p. 57-75.
22 SPELLBERG B., EDWARDS JR JE. Type-1/Type-2 immunity in infectious
diseases. Clin. Infect. Dis., 2001, 32, 76-102.
23 VRISEKOOP N., HAZENBERG MD., MIEDEMA F., BORGHANS JAM. T cell
dynamics and the role of apoptosis in HIV infection. In: BADLEY AD. (Ed.) Cell death
in HIV infection. Florida: CRC Press, 2006. p. 319-34.
24 WILSON JD., IMAMI N., WATKINS A., GILL J., HAY P., GAZZARD B., WESTBY
M., GOTCH FM. Loss of CD4+ T cell proliferative ability but not loss of human
immunodeficiency virus type 1 specificity equates with progression to disease. J.
Infect. Dis., 2000, 182, 792-8.
25 YOUNES SA., YASSINE-DIAB B., DUMONT AR., BOULASSEL MR.,
GROSSMAN Z., ROUTY JP., SEKALY RP. HIV-1 viremia prevents the establishment
of interleukin 2-producing HIV-specific memory CD4+ T cells endowed with
proliferative capacity. J. Exp. Med., 2003, 198, 1909-22.