NHESSD
3, 6149–6184, 2015Patterns and trends of high-impact weathers in China during 1959–2014
J. Shi et al.
Title Page
Abstract Introduction
Conclusions References
Tables Figures
◭ ◮
◭ ◮
Back Close
Full Screen / Esc
Printer-friendly Version
Interactive Discussion
Discussion
P
a
per
|
Discussion
P
a
per
|
Discussion
P
a
per
|
Discussion
P
a
per
|
Nat. Hazards Earth Syst. Sci. Discuss., 3, 6149–6184, 2015 www.nat-hazards-earth-syst-sci-discuss.net/3/6149/2015/ doi:10.5194/nhessd-3-6149-2015
© Author(s) 2015. CC Attribution 3.0 License.
This discussion paper is/has been under review for the journal Natural Hazards and Earth System Sciences (NHESS). Please refer to the corresponding final paper in NHESS if available.
Patterns and trends of high-impact
weathers in China during 1959–2014
J. Shi1,2, K. Wen1,2, and L. Cui3
1
Shanghai Climate Center, Shanghai Meteorological Bureau, Shanghai, 200030, China
2
Ecological Technique and Engineering College, Shanghai Institute of Technology, Shanghai, 201418, China
3
Shanghai Center for Satellite Remote Sensing and Application, Shanghai, 201199, China
Received: 7 September 2015 – Accepted: 17 September 2015 – Published: 9 October 2015 Correspondence to: J. Shi ([email protected])
NHESSD
3, 6149–6184, 2015Patterns and trends of high-impact weathers in China during 1959–2014
J. Shi et al.
Title Page
Abstract Introduction
Conclusions References
Tables Figures
◭ ◮
◭ ◮
Back Close
Full Screen / Esc
Printer-friendly Version
Interactive Discussion
Discussion
P
a
per
|
Discussion
P
a
per
|
Discussion
P
a
per
|
Discussion
P
a
per
|
Abstract
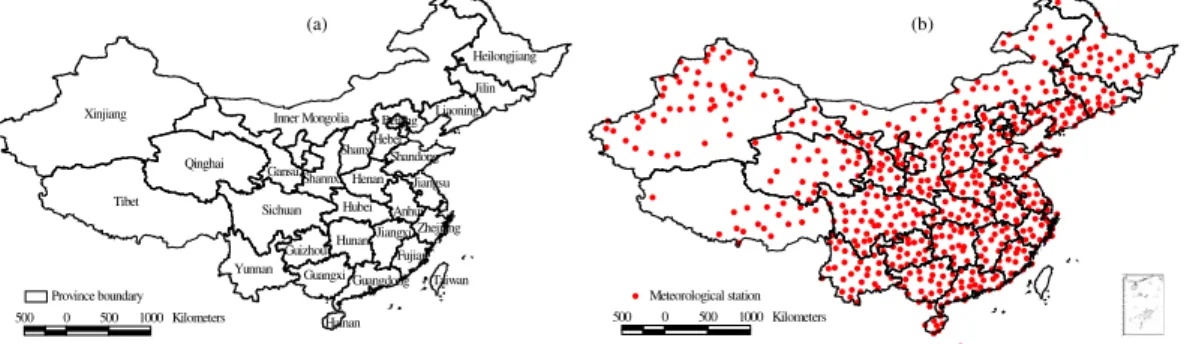
The spatial and temporal characteristics in the frequencies of four types of high-impact weathers (HIWs), i.e. snowfall, thunderstorm, foggy and hailstorm weathers were an-alyzed in China by using daily weather phenomenon data from 604 stations. Results indicate that snowfall, thunderstorm, foggy and hailstorm days showed significant de-5
creasing trends with rates of 2.5, 2.6, 0.8 and 0.5 days per decade respectively, and snowfall, thunderstorm, foggy and hailstorm weather processes decreased significantly at rates of 0.3, 0.4, 0.1 and 0.1 times per decade during 1959–2014. Spatially, snowfall weathers were more in northeastern and western China, and thunderstorm weathers were more in southern and southwestern China. Foggy weathers were more in some 10
high mountain stations, eastern China and central China, and hailstorm weathers were concentrated on Qinghai–Tibet Plateau. Over the past 56 years, snowfall days, thun-derstorm days and thunthun-derstorm weather processes decreased in most parts of China, with decreasing rates of 1.0–6.0 days, 1.5–8.0 days and 0.2–1.0 times per decade re-spectively. Hailstorm days decreased in northeastern China and most parts of northern 15
and western China at a rate of 0.2–4.5 days per decade. The spatial trends of foggy days, foggy weather processes and snowfall weather processes were not significant in most parts of China. With climate change and rapidly economic development, more policies and strategies of reducing social vulnerabilities and/or exposures to HIWs are essential for the government and social publics.
20
1 Introduction
The globally averaged surface temperature data as calculated by a linear trend, show a warming of 0.85 (0.65 to 1.06)◦
C over the period 1880 to 2012, and the increase of global surface temperatures for 2081–2100 relative to 1986–2005 is projected to likely be in the range of 0.3–4.8◦C (IPCC, 2013). High-impact weathers (HIWs) are 25
NHESSD
3, 6149–6184, 2015Patterns and trends of high-impact weathers in China during 1959–2014
J. Shi et al.
Title Page
Abstract Introduction
Conclusions References
Tables Figures
◭ ◮
◭ ◮
Back Close
Full Screen / Esc
Printer-friendly Version
Interactive Discussion
Discussion
P
a
per
|
Discussion
P
a
per
|
Discussion
P
a
per
|
Discussion
P
a
per
|
activity (Sills, 2009). Storm, typhoon, snowfall, fog and haze can often lead to flood, flash flood, debris flow and low visibility, and bring significant economic, social and environmental impacts and damages, thus, these kinds of weathers are called HIWs (Li et al., 2013; Done et al., 2015; Shi et al., 2015). During 2001–2010, our world suffered unparalleled high-impact climate extremes in history, and over 370 000 people 5
died from extreme weather and climate events (WMO, 2013). Analysis of the long-term climatic characteristics of HIWs, is conducive to improving the weather forecast capacity, reducing the loss of human life and property and developing climate change mitigation and adaptation plans (de Vyver, 2012; Li et al., 2013), which further has great significance for national economic and social development.
10
China, a region with complex topography and strongly influenced by Asian monsoon circulation, is especially vulnerable to frequent weather and climate disasters (Jiang et al., 2012). The main HIWs in China include typhoon, rainstorm, thunderstorm, gale, heat wave, fog, haze, hailstorm, tornado and snowstorm (Shi and Cui, 2012). Previ-ous studies have investigated the variations of some HIWs in China, for example, Yu 15
et al. (2012) analyzed the frequency variation of thunderstorm, hailstorm and gale in eastern China from 1971 to 2000. Fu et al. (2013) examined the variability in the fre-quency of extreme precipitation events in China during 1961–2009. Zhu et al. (2014) investigated the spatiotemporal variation patterns of snowfall days in Qinghai province from 1962 to 2012. Sun et al. (2014) quantified the causes of extreme summer heat of 20
2013 and projected its future likelihood in eastern China. Shi et al. (2015) analyzed the evolution characteristics of eight types of HIWs and the causes in the Yangtze River Delta during 1959–2010.
However, there are some insufficiencies in the previous studies. First of all, the study areas of some studies are only parts of China, so the results are incapable of reflecting 25
NHESSD
3, 6149–6184, 2015Patterns and trends of high-impact weathers in China during 1959–2014
J. Shi et al.
Title Page
Abstract Introduction
Conclusions References
Tables Figures
◭ ◮
◭ ◮
Back Close
Full Screen / Esc
Printer-friendly Version
Interactive Discussion
Discussion
P
a
per
|
Discussion
P
a
per
|
Discussion
P
a
per
|
Discussion
P
a
per
|
or process of HIWs with daily data. Finally, most of former studies focus on tempera-ture and/or precipitation extremes, and few researches consider other types of HIWs, such as thunderstorm, fog, snowfall or hailstorm (Yu et al., 2012; Zhu et al., 2014; Shi et al., 2015). The evolution characteristics of these types of HIWs are actually essential to social production and people’s living under the background of climate change. 5
The objectives of this study were to examine the distribution patterns and variation trends in the number of days and processes of four types of HIWs, i.e. snowfall, thun-derstorm, foggy and hailstorm weathers based on the daily weather monitoring data of the whole China during 1959–2014. This will give some insights to the dynamic change of HIWs, which is necessary to plan the climate change adaptation strategies in China. 10
The outline of the paper is as follows. After describing the dataset and the methodol-ogy in Sect. 2, the spatial and temporal characteristics of HIWs are analyzed in Sect. 3. This is followed by a discussion of the main findings in Sect. 4, and finally, a summary of the main conclusions is provided in Sect. 5.
2 Data and method
15
2.1 Data
The daily weather phenomenon data were used to form the frequencies and processes of high-impact weathers (HIWs) in China. The data provided by the National Meteoro-logical Information Center (NMIC) of the China MeteoroMeteoro-logical Administration (CMA) have 756 available stations and span from 1951 to 2014, we excluded those data 20
NHESSD
3, 6149–6184, 2015Patterns and trends of high-impact weathers in China during 1959–2014
J. Shi et al.
Title Page
Abstract Introduction
Conclusions References
Tables Figures
◭ ◮
◭ ◮
Back Close
Full Screen / Esc
Printer-friendly Version
Interactive Discussion
Discussion
P
a
per
|
Discussion
P
a
per
|
Discussion
P
a
per
|
Discussion
P
a
per
|
The good data quality and high station density are useful for assessing the distri-bution and change of climatic extremes (Fischer et al., 2012). The selected stations are maintained according to the criterions of WMO’s Guide to the Global Observing System and CMA’s Technical Regulations on Weather Observations. The missing val-ues were filled in by weather phenomenon data of the neighboring stations through the 5
simple linear regression method or by the climatological standard normals, 1981–2010 of the station itself, and this gap filling method was considered as having little influence on the long-term temporal trend (Zhang et al., 2008).
2.2 Method
2.2.1 The definition of high-impact weathers
10
In this study, the definition of four types of HIWs is in accordance with Standard of the Surface Observation about Meteorology (China Meteorological Administration, 2003). Snowfall is precipitation in the form of flakes of crystalline water ice that falls from clouds. Thunderstorm is a storm in which there is thunder and lightning and a lot of heavy rain. Fog is a visible mass consisting of cloud water droplets or ice crystals 15
at or near the Earth’s surface, which reduces visibility to less than 1 km. Hailstorm is a form of solid precipitation that consists of balls or irregular lumps of ice, each of which is called a hailstone. If above-mentioned weather phenomenon occurred on one day individually or simultaneously, the day was recorded as the corresponding type of HIWs.
20
2.2.2 The sequence of the days of high-impact weathers
NHESSD
3, 6149–6184, 2015Patterns and trends of high-impact weathers in China during 1959–2014
J. Shi et al.
Title Page
Abstract Introduction
Conclusions References
Tables Figures
◭ ◮
◭ ◮
Back Close
Full Screen / Esc
Printer-friendly Version
Interactive Discussion
Discussion
P
a
per
|
Discussion
P
a
per
|
Discussion
P
a
per
|
Discussion
P
a
per
|
annual average days of HIWs in each province of China were calculated firstly with the station-averaged method according to the number of stations in that province, and then, based on the provincial values, annual average days of HIWs in China were cal-culated with the area-weighted average method according to the area of each province. For the sequence of annual maximum days of HIWs in China, the maximum days of 5
snowfall, thunderstorm, foggy and hailstorm weathers were selected directly from the 604 stations in each year respectively.
2.2.3 The sequence of the processes of high-impact weathers
Here, a weather process is defined as the same type of HIWs which lasted for no less than 3 days, so a process of HIWs may be longer with over 10 consecutive days, or 10
it has only 3 consecutive days. Based on the daily weather phenomenon data, the weather processes were determined and the number of processes for each type of HIWs, i.e. snowfall weather process, thunderstorm weather process, foggy weather process or hailstorm weather process, was counted annually in each station. Similarly, annual average number of processes for each type of HIWs was calculated firstly with 15
the station-averaged method in each province, and then the area-weighted average method was used to obtain the sequence of annual average number of processes in China. Annual maximum processes of HIWs in China were also selected directly from the 604 stations to obtain the maximum values in each year for each type of HIWs.
2.2.4 Temporal characteristics in the frequencies of high-impact weathers
20
To find out the timing dynamics of the frequency of HIWs in China, the distribution and trend of annual average number and annual maximum number of days and processes of HIWs was analyzed respectively. Trend was defined as the linear regression coeffi -cient (Niu et al., 2004). Based on the annual sequence of the days and processes of HIWs in China, the linear trend of annual days and annual number of processes was 25
NHESSD
3, 6149–6184, 2015Patterns and trends of high-impact weathers in China during 1959–2014
J. Shi et al.
Title Page
Abstract Introduction
Conclusions References
Tables Figures
◭ ◮
◭ ◮
Back Close
Full Screen / Esc
Printer-friendly Version
Interactive Discussion
Discussion
P
a
per
|
Discussion
P
a
per
|
Discussion
P
a
per
|
Discussion
P
a
per
|
2013; de Lima et al., 2013), and was tested for statistical significance at the 0.05 con-fidence level using a two-tailedttest (Wang et al., 2013).
2.2.5 Spatial characteristics in the frequencies of high-impact weathers
Based on the annual sequence of HIWs in each station, the long-time average annual number of days and processes of each type of HIWs was calculated respectively in 5
each station, and the linear trend of annual number of days and processes of HIWs was also calculated with the method of ordinary least squares regression in each sta-tion. According to the longitude and latitude of each station, the spatial distribution and trend in the number of days and processes of HIWs were established using the IDW (Inverse Distance Weighted) interpolation technique and were drawn with surfer 8 10
(a professional drawing software). The spatial distribution indicates the general pattern of HIWs in China, and the spatial trend manifests the linear regression coefficient on a decade time scale.
3 Results
3.1 Temporal characteristics in the days of high-impact weathers in China
15
3.1.1 The variation in annual average days of high-impact weathers
During 1959–2014, annual average number of snowfall weathers decreased at a sig-nificant rate of 2.5 days per decade in China (Fig. 2a). Snowfall days slightly increased at first and then decreased continuously. In the 1970s (1971–1980), snowfall weathers were more, with an annual average of 40.0 days, and during 2001–2014, they were 20
NHESSD
3, 6149–6184, 2015Patterns and trends of high-impact weathers in China during 1959–2014
J. Shi et al.
Title Page
Abstract Introduction
Conclusions References
Tables Figures
◭ ◮
◭ ◮
Back Close
Full Screen / Esc
Printer-friendly Version
Interactive Discussion
Discussion
P
a
per
|
Discussion
P
a
per
|
Discussion
P
a
per
|
Discussion
P
a
per
|
with an annual average of 42.4 days, and they were less during 2001–2014, with an annual average of 31.5 days (Table 1).
Annual average number of foggy weathers decreased at a rate of 0.8 days per decade in China, and the trend was also significant during 1959–2014 (Fig. 2c). Foggy days decreased at first and then increased and later decreased continuously. Foggy 5
weathers were more in the 1970s and the 1980s (1981–1990), and they were less during 2001–2014, with an annual average of 11.5 days (Table 1). The number of hail-storm weathers decreased significantly, and the average decrease rate was 0.5 days per decade in China (Fig. 2d). Hailstorm days increased initially and decreased after-wards over the past 56 years. In the 1970s, hailstorm weathers were more, with an 10
annual average of 3.5 days per year, and they were less during 2001–2014, with an annual average of 1.4 days (Table 1).
3.1.2 The variation in annual maximum days of high-impact weathers
Annual maximum number of snowfall weathers decreased significantly at a rate of 8.6 days per decade in China during 1959–2014 (Fig. 3a). The maximum number of 15
snowfall days changed little during 1959–1990, but after 1991 it increased rapidly at a rate of 24.5 days per decade. Snowfall weathers were the most at Tulogart station of Xinjiang in 1966, which were 239 days. Annual maximum number of thunderstorm weathers decreased significantly at a rate of 6.3 days per decade in China (Fig. 3b). The maximum number of thunderstorm days decreased continuously over the past 56 20
years. Thunderstorm weathers were the most at Jinghong station of Yunnan in 1964, which were 149 days.
Annual maximum number of foggy weathers decreased significantly in China, and the average decrease rate was 3.4 days per decade during 1959–2014 (Fig. 3c). The maximum number of foggy days decreased continuously. Foggy weathers were the 25
NHESSD
3, 6149–6184, 2015Patterns and trends of high-impact weathers in China during 1959–2014
J. Shi et al.
Title Page
Abstract Introduction
Conclusions References
Tables Figures
◭ ◮
◭ ◮
Back Close
Full Screen / Esc
Printer-friendly Version
Interactive Discussion
Discussion
P
a
per
|
Discussion
P
a
per
|
Discussion
P
a
per
|
Discussion
P
a
per
|
weathers increased at a rate of 3.7 days per decade during 1959–1980, and after then it decreased at a rate of 4.7 days per decade. Hailstorm weathers were the most at Nagchu station of Tibet in 1976, which were 53 days.
3.2 Spatial characteristics in the days of high-impact weathers in China
3.2.1 Spatial distribution in average annual days of high-impact weathers
5
During 1959–2014, average annual days of snowfall weathers were more in northern and westnorthern China, but less in southnorthern China (Fig. 4a). In Heilongjiang, Jilin, east-ern Liaoning, Gansu, Qinghai, Tibet, westeast-ern Sichuan and most parts of Inner Mongolia and Xinjiang, the number of snowfall weathers was over 25 days per year on average, especially in most parts of Heilongjiang, eastern Jilin, northeastern Inner Mongolia, 10
northern Xinjiang, central and southern Qinghai, northeastern Tibet and northwest-ern Sichuan, the number of snowfall weathers was over 50 days per year. In eastnorthwest-ern Sichuan, Guangdong, Guangxi, Fujian, Hainan, the southern parts of Zhejiang, Hunan and Guizhou, and most parts of Jiangxi and Yunnan, the number of snowfall weathers was less than 10 days per year. At Tulogart station of Xinjiang, the number of snow-15
fall weathers was the greatest, with an annual average of 196 days, and at 42 stations mainly distributed in Hainan, southern Guangdong, southern Guangxi and southwest-ern Yunnan, there was no snowfall weather during 1959–2014.
Average annual days of thunderstorm weathers were more in southern and south-western China, but less in northsouth-western China except for a few stations of south-western Xin-20
jiang (Fig. 4b). In southwestern Zhejiang, Jiangxi, most parts of Hunan and Guizhou, western Sichuan, southern Qinghai, central and eastern Tibet, Yunnan, Guangxi, Guangdong and Hainan, the number of thunderstorm weathers was over 45 days per year on average, especially in southwestern Fujian, southern Jiangxi, Guangdong, Guangxi, Hainan, Yunnan, southwestern Sichuan and central Tibet, the number of 25
thun-NHESSD
3, 6149–6184, 2015Patterns and trends of high-impact weathers in China during 1959–2014
J. Shi et al.
Title Page
Abstract Introduction
Conclusions References
Tables Figures
◭ ◮
◭ ◮
Back Close
Full Screen / Esc
Printer-friendly Version
Interactive Discussion
Discussion
P
a
per
|
Discussion
P
a
per
|
Discussion
P
a
per
|
Discussion
P
a
per
|
derstorm weathers was less than 20 days per year. At Mengle station of Yunnan, the number of thunderstorm weathers was the greatest, with an average of 113 days per year.
Average annual days of foggy weathers were more at some high mountain stations, but less in western China and Inner Mongolia during 1959–2014 (Fig. 4c). At Mount Tai, 5
Huang, Jvxian and Emei stations, the number of foggy weathers was over 100 days per year on average. In eastern China, central China and some areas of southwestern and northeastern China, including southern Hebei, central and eastern Henan, Shandong, Jiangsu, Anhui, Shanghai, Jiangxi, Zhejiang, Fujian, Hubei, Hunan, southern Shannxi, eastern Sichuan, Guizhou, southern Yunnan, northern Heilongjiang, eastern Jinli and 10
eastern Liaoning, the number of foggy weathers was over 20 days per year. In Tibet, Qinghai, southern and central Xinjiang, Ningxia, most parts of Gansu and Inner Mon-golia, the number of foggy weathers was less than 10 days per year. At Mount Emei station of Sichuan, the number of foggy weathers was the greatest, with an annual av-erage of 312 days, and at 21 stations mainly distributed in northern Qinghai, western 15
Sichuan and eastern Tibet, there was no foggy weather during 1959–2014.
During 1959–2014, average annual days of hailstorm weathers were more in south-ern Qinghai and central Tibet, with an average of over 8 days per year (Fig. 4d). In Qinghai, Tibet, southwestern Gansu, western Sichuan, some small parts of western Xinjiang, mid-eastern Inner Mongolia, northern Hebei and northern Shanxi, the num-20
ber of hailstorm weathers was over 2 days per year. In other regions, the number of hailstorm weathers was less than 2 days per year. At Nagchu station of Tibet, the num-ber of hailstorm weathers was the greatest, with an annual average of 32 days, and at 22 stations mainly distributed in southern Fujian, southern Guangdong, southern Guangxi and Hainan, there was no hailstorm weather during 1959–2014.
25
3.2.2 Spatial trend in annual days of high-impact weathers
NHESSD
3, 6149–6184, 2015Patterns and trends of high-impact weathers in China during 1959–2014
J. Shi et al.
Title Page
Abstract Introduction
Conclusions References
Tables Figures
◭ ◮
◭ ◮
Back Close
Full Screen / Esc
Printer-friendly Version
Interactive Discussion
Discussion
P
a
per
|
Discussion
P
a
per
|
Discussion
P
a
per
|
Discussion
P
a
per
|
Jiangxi, Guangxi, Guangdong, Fujian, eastern Sichuan, and some scattered areas of other provinces, the number of snowfall weathers decreased almost all with a rate of 0–1.0 days per decade, but the trend was not significant. In other regions, snowfall weathers decreased significantly at a rate of over 1.0 days per decade, especially in most parts of Qinghai and Tibet, some parts of eastern Inner Mongolia, mid-eastern 5
Heilongjiang, eastern Jilin, western Sichuan, southern Gansu and central Shannxi, it decreased at a rate of over 3.0 days per decade.
Thunderstorm weathers showed a decreasing trend in almost the entire China dur-ing 1959–2014 (Fig. 5b). In southwestern and southeastern Xinjiang, northwestern Qinghai, northwestern Gansu, southeastern Tibet and some scattered areas of other 10
provinces, the number of thunderstorm weathers decreased at a rate of below 1.5 days per decade, but the trend was not significant. In other regions, it decreased signifi-cantly and the decreasing trend was greater in southern China than in northern China. In northeastern China and northern China, the number of thunderstorm weathers de-creased mainly at a rate of 1.5–3.0 days per decade, but in regions south of Shan-15
dong, Henan, northern Shannxi, eastern and northern Gansu, northwestern Qinghai and northwestern Tibet, it decreased mainly at a rate of 3.0–8.0 days per decade.
The trend of foggy weathers was not significant in most of China during 1959–2014 (Fig. 5c). In western China and Inner Mongolia, including Xinjiang, Qinghai, Tibet, Gansu, western Sichuan and most parts of Inner Mongolia, the number of foggy weath-20
ers decreased at a rate of 0–1.0 days per decade in most areas, though the trend was not significant. In northeastern China, including Heilongjiang, Jilin and northeastern Inner Mongolia, and western Yunnan and northern Fujian, the number of foggy weath-ers decreased significantly at a rate of 1.0–15.0 days per decade. In Huang-Huai-Hai plain, eastern and central Guangxi, eastern Yunnan and a few scattered areas of other 25
provinces, the number of foggy weathers increased mainly at a rate of 0–5.0 days per decade but the trend was not significant in most areas.
NHESSD
3, 6149–6184, 2015Patterns and trends of high-impact weathers in China during 1959–2014
J. Shi et al.
Title Page
Abstract Introduction
Conclusions References
Tables Figures
◭ ◮
◭ ◮
Back Close
Full Screen / Esc
Printer-friendly Version
Interactive Discussion
Discussion
P
a
per
|
Discussion
P
a
per
|
Discussion
P
a
per
|
Discussion
P
a
per
|
southwestern Gansu, southern and eastern Qinghai, western Sichuan, most parts of Tibet and some scattered areas of Xinjiang, the number of hailstorm weathers decreased with a significant rate of 0.2–4.5 days per decade. In east-central Xin-jiang, some small areas of ZheXin-jiang, Jiangsu, Anhui, Jiangxi, Fujian, Guangdong and Sichuan, the number of hailstorm weathers increased at a rate of 0–0.5 days per 5
decade, though the trend was not significant. In other places, it decreased at a rate of 0–0.2 days per decade and the trend was also not significant.
3.3 Temporal characteristics in the processes of high-impact weathers in
China
3.3.1 The variation in annual average number of processes of high-impact
10
weathers
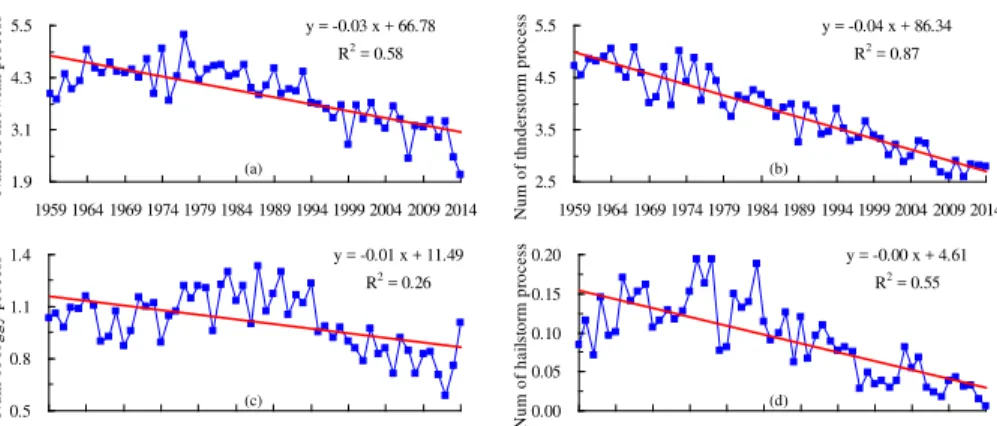
Annual snowfall weather processes decreased at a rate of 0.3 times per decade and the trend was statistically significant in China during 1959–2014 (Fig. 6a). Snowfall weather process increased firstly and then decreased continuously. In the 1970s, snow-fall weather processes were more, with an annual average of 4.46 times, and during 15
2001–2014, they were less, with an average of 3.09 times per year (Table 2). Annual thunderstorm weather processes decreased at a rate of 0.4 times per decade, and the trend was also significant in China (Fig. 6b). During 1959–1970, thunderstorm weather processes were more, with an average of 4.66 times per year, and they were less during 2001–2014, with an annual average of 2.91 times (Table 2).
20
Annual foggy weather processes decreased significantly at a rate of 0.1 times per decade in China (Fig. 6c). Foggy weather process decreased at first and then in-creased and later dein-creased continuously over the past 56 years. In the 1980s, foggy weather processes were more, with an annual average of 1.17 times, and during 2001– 2014, they were less, with an average of 0.81 times per year (Table 2). Annual hail-25
NHESSD
3, 6149–6184, 2015Patterns and trends of high-impact weathers in China during 1959–2014
J. Shi et al.
Title Page
Abstract Introduction
Conclusions References
Tables Figures
◭ ◮
◭ ◮
Back Close
Full Screen / Esc
Printer-friendly Version
Interactive Discussion
Discussion
P
a
per
|
Discussion
P
a
per
|
Discussion
P
a
per
|
Discussion
P
a
per
|
decreased afterwards. In the 1970s, hailstorm weather processes were more, with an average of 0.14 times per year, and during 2001–2014, they were less, with an annual average of 0.04 times (Table 2).
3.3.2 The variation in annual maximum number of processes of high-impact
weathers
5
Annual maximum number of snowfall weather processes decreased at a rate of 1.0 times per decade and the trend was significant in China during 1959–2014 (Fig. 7a). Snowfall weather processes were the most at Tulogart station of Xinjiang, which were 33 times and occurred in 1976. Annual maximum number of thunderstorm weather processes decreased with a rate of 0.9 times per decade and the trend was also sig-10
nificant in China (Fig. 7b). The number of thunderstorm weather processes decreased continuously over the past 56 years. Thunderstorm weather processes were the most at Jinghong station of Yunnan, which were 25 times and occurred in 1968.
During 1959–2014, annual maximum number of foggy weather processes changed little and the trend was not significant in China (Fig. 7c). Foggy weather processes 15
were the most at Mount Emei station of Sichuan, which were 35 times and occurred in 2009. Annual maximum number of hailstorm weather processes decreased at a rate of 0.5 times per decade and the trend was also significant in China (Fig. 7d). The number of hailstorm weather processes increased during 1959–1976, and after then it decreased. Hailstorm weather processes were the most at at Nagchu station of Tibet, 20
NHESSD
3, 6149–6184, 2015Patterns and trends of high-impact weathers in China during 1959–2014
J. Shi et al.
Title Page
Abstract Introduction
Conclusions References
Tables Figures
◭ ◮
◭ ◮
Back Close
Full Screen / Esc
Printer-friendly Version
Interactive Discussion
Discussion
P
a
per
|
Discussion
P
a
per
|
Discussion
P
a
per
|
Discussion
P
a
per
|
3.4 Spatial characteristics in the processes of high-impact weathers in China
3.4.1 Spatial distribution in average annual number of processes of
high-impact weathers
During 1959–2014, snowfall weather processes were more in northeastern China, northwestern Xinjiang and Qinghai–Tibetan Plateau, but less in southern China 5
(Fig. 8a). In northeastern Inner Mongolia, most parts of Heilongjiang and Tibet, east-ern Jilin, northwesteast-ern Xinjiang, easteast-ern and southeast-ern Qinghai, westeast-ern Sichuan and southwestern Gansu, snowfall weather processes were over 4 times per year on aver-age, especially in some parts of southern Qinghai and north-central Tibet, they were over 10 times per year. In central and southern Jiangsu, the southern parts of Zhejiang, 10
Hunan and Guizhou, eastern and southern Jiangxi, Fujian, Guangdong, Guangxi, Hainan, most parts of Yunnan, and some parts of eastern Sichuan and western Liaon-ing, snowfall weather processes were less than once a year. At Tulogart station of Xinjiang, snowfall weather processes were the most, with an average of 25.7 times per year, and at 58 stations mainly distributed in Hainan, southern Guangxi, southern 15
Guangdong and southwestern Yunnan, there was no snowfall weather process during 1959–2014.
Thunderstorm weather processes were more in southern and southwestern China, but less in most areas of northwestern China (Fig. 8b). In most parts of Zhejiang and Hunan, southern Anhui, western Sichuan, southern Qinghai, central and eastern Ti-20
bet, Yunnan, Guizhou, Guangxi, Guangdong, Hainan, Jiangxi, Fujian and several sta-tions of western Xinjiang, thunderstorm weather processes were over 4 times per year on average, especially in southeastern Guangxi, western and southern Guangdong, southern Yunnan and Hainan, they were over 9 times per year. In western Inner Mon-golia, northwestern and eastern Gansu, Ningxia, northwestern Qinghai, eastern and 25
NHESSD
3, 6149–6184, 2015Patterns and trends of high-impact weathers in China during 1959–2014
J. Shi et al.
Title Page
Abstract Introduction
Conclusions References
Tables Figures
◭ ◮
◭ ◮
Back Close
Full Screen / Esc
Printer-friendly Version
Interactive Discussion
Discussion
P
a
per
|
Discussion
P
a
per
|
Discussion
P
a
per
|
Discussion
P
a
per
|
Foggy weather processes were more at some high mountain stations, but less in western China and eastern and central Inner Mongolia during 1959–2014 (Fig. 8c). At Mount Wutai, Tai, Hua, Huang, Jvxian, Lu, Emei, Heng and Huajialing stations, foggy weather processes were over 15 times per year. In eastern China, central China, south-ern Hebei, eastsouth-ern and southsouth-ern Shanxi, central and southsouth-ern Shannxi, southeastsouth-ern 5
Gansu, central and eastern Sichuan, southern Yunnan, Guizhou, and some parts of Heilongjiang, Inner Mongolia, Jilin, Liaoning and Xinjiang, foggy weather processes were over once a year in most areas. In other regions, foggy weather processes were less than once a year. At Mount Lu station of Jiangxi, foggy weather processes were the most, with an annual average of 26.9 times, and at 99 stations mainly distributed 10
in Tibet, Qinghai, western Sichuan, Gansu and southeastern Xinjiang, there was no foggy process during 1959–2014.
Hailstorm weather processes were more in southwestern Qinghai and north-central Tibet, with an annual average of over 0.5 times during 1959–2014 (Fig. 8d). In most areas of China, including northeastern China, northern China, eastern China, central 15
China, southern China, and Xinjiang, Gansu, central and eastern Sichuan, Yunnan and Guizhou, there was no hailstorm weather process over the past 56 years. At Nagchu station of Tibet, hailstorm weather processes were the most, with an average of 2.6 times per year.
3.4.2 Spatial trend in annual number of processes of high-impact weathers
20
Except for several stations in western Xinjiang, central Tibet, western Gansu and north-eastern China, snowfall weather processes decreased in the whole China during 1959– 2014 (Fig. 9a). In eastern and southern Qinghai, eastern Tibet, northwestern Sichuan, eastern and central Inner Mongolia, mid-eastern Heilongjiang, eastern Jilin, southeast-ern Gansu and some parts of central Shannxi and northsoutheast-ern Shanxi, snowfall weather 25
NHESSD
3, 6149–6184, 2015Patterns and trends of high-impact weathers in China during 1959–2014
J. Shi et al.
Title Page
Abstract Introduction
Conclusions References
Tables Figures
◭ ◮
◭ ◮
Back Close
Full Screen / Esc
Printer-friendly Version
Interactive Discussion
Discussion
P
a
per
|
Discussion
P
a
per
|
Discussion
P
a
per
|
Discussion
P
a
per
|
western Liaoning, western Jilin, and some scattered areas of Gansu, Inner Mongo-lia, Hebei and Shanxi, snowfall weather processes decreased at a rate of less than 0.2 times per decade, but the trend was not significant.
Thunderstorm weather processes decreased in the entire China during 1959–2014 (Fig. 9b), and the decreasing trend was greater in southern China than in northern 5
China. In eastern and southern Xinjiang, northwestern Qinghai, northwestern Tibet, the western parts of Gangsu and Inner Mongolia, thunderstorm weather processes decreased at a rate of less than 0.2 times per decade in most areas, but the trend was not significant. In northeastern China, central Inner Mongolia, the western parts of Xin-jiang, Tibet and Shannxi, eastern Gansu, Ningxia and northern Shanxi, thunderstorm 10
weather processes decreased significantly at a rate of 0.2–0.4 times per decade, and in most parts of Jiangxi, Guangdong, Guizhou and Yunnan, western Fujian, southern Hunan, Guangxi, Hainan, western Sichuan and southeastern Qinghai, they decreased significantly at a rate of over 0.7 times per decade.
Foggy weather processes varied mainly with a rate of−0.2 to 0.3 times per decade
15
(Fig. 9c), but the trend was not significant in most areas of China. In eastern Xinjiang, the northwestern parts of Gansu and Qinghai, western and east-central Inner Mon-golia, western and southern Liaoning, northeastern and southern Hebei, most parts of Shandong, Jiangsu and Henan, southeastern Shanxi, central and northern Anhui, southern Yunnan and some scattered areas of other provinces, foggy weather pro-20
cesses increased but the trend was not significant. In eastern Jilin, most parts of Fu-jian, eastern Hainan, southwestern Yunnan, and some scattered areas of Heilongjiang, Inner Mongolia, Shannxi, Sichuan, Guizhou, Hunan, Jiangxi and Guangdong, foggy weather processes decreased with a rate of over 0.2 times per decade, and the trend was significant.
25
de-NHESSD
3, 6149–6184, 2015Patterns and trends of high-impact weathers in China during 1959–2014
J. Shi et al.
Title Page
Abstract Introduction
Conclusions References
Tables Figures
◭ ◮
◭ ◮
Back Close
Full Screen / Esc
Printer-friendly Version
Interactive Discussion
Discussion
P
a
per
|
Discussion
P
a
per
|
Discussion
P
a
per
|
Discussion
P
a
per
|
creased at a rate of over 0.05 times per decade. In other regions of China, hailstorm weather processes varied mainly with a rate of−0.05 to 0.04 times per decade, and
the trend was also not significant.
4 Discussion
High-impact weathers (HIWs) refer to the weather events or climatic phenomena 5
or their abnormities that may cause serious disasters and have impacts on social economies, natural environment and human activities (Shi et al., 2015). HIWs can dis-rupt transportation and communication, damage homes and property, claim the lives of people, and etc. In China, HIWs are frequent due to the various climate regimes, complex topography and the strong influence of East Asian monsoon system (Fu 10
et al., 2013). Every year there are many Chinese people suffer from typhoons, storms, floods, hail, drought, wind and other meteorological disasters. Meteorological disasters are estimated to cause an economic loss of 3 to 6 % of GDP each year since 1990 (Jiang et al., 2012). More accurate information on HIWs is thus a critical need of soci-ety (Done et al., 2015). The temporal patterns and spatial trends of catastrophic floods, 15
droughts, storms, and heat waves or cold spells have been receiving much attention in recent years as a result of the tremendous losses from meteorological disasters (Zhai and Liu, 2012; Wu et al., 2014). A deep understanding of HIWs is also essential for en-hancing forecast capability, strengthening risk management and planning adaptation measures (Fischer et al., 2012).
20
A significant decreasing trend in the frequency of snowfall days was observed be-tween 1959 and 2014 in almost the whole of China (Fig. 5a), and this trend was also found by other studies from different parts of the China. For example, Wang et al. (2011) analyzed the changing characteristics of snowfall and snowfall days in Liaoning Province during 1961–2007, and the results showed that there was no signifi-25
reduc-NHESSD
3, 6149–6184, 2015Patterns and trends of high-impact weathers in China during 1959–2014
J. Shi et al.
Title Page
Abstract Introduction
Conclusions References
Tables Figures
◭ ◮
◭ ◮
Back Close
Full Screen / Esc
Printer-friendly Version
Interactive Discussion
Discussion
P
a
per
|
Discussion
P
a
per
|
Discussion
P
a
per
|
Discussion
P
a
per
|
tion of snowfall days was mainly due to the reduction of days of light snow and trace snow, especially the trace snow. Zhu et al. (2014) analyzed the spatiotemporal varia-tion patterns of snowfall days in Qinghai Province during 1962 to 2012 and the results also showed a decreasing trend of snowfall days at rates of 1–3 days per decade. The climate characteristics in the frequency of snowfall days in Ningxia during the period 5
of 1961 to 2010 were also analyzed and the results showed that the total numbers of snowfall days had decreased, with the reduction of light snow, heavy snow and snow-storms days, and the opposite trend of moderate snow days (Ding et al., 2012).
With global warming, it is very important to consider the potential effects of climate change on thunderstorms (Brooks, 2013). Thunderstorm is frequently accompanied by 10
gale, rainstorm and sometimes hail, and it can cause many people killed or seriously injured in each year despite the advance warning. During 1959–2014, a significant de-creasing trend was detected in the frequency of thunderstorm days in China (Fig. 2b), and the thunderstorm days decreased more in southern China than in northern China (Fig. 5b). Chen et al. (2009) examined the occurring days of thunderstorm at 743 sta-15
tions in China based on the observations from 1951 to 2005, and the results showed that except slight increase in Qinghai–Tibet Plateau, the thunderstorm days had a de-creasing tendency in the other areas of China. Yu et al. (2012) analyzed the frequency variation of thunderstorm in eastern China from 1971 to 2000 and the results indicated that the frequency of thunderstorm had a decreasing trend, especially in the south of 20
the Yangtze River, the frequency of thunderstorm showed a more significant decreas-ing trend. However, the research on the relationship between thunderstorm and global climate has been more limited. Marsh et al. (2009) indicated that in Europe, climate models were able to produce reasonable distributions of severe thunderstorms, though the interpretation of the magnitudes is unconfident. Global models have the horizontal 25
resolution of tens or larger kilometers, so it is also difficult to deal with the thunderstorm with small horizontal scale (Brooks, 2013).
de-NHESSD
3, 6149–6184, 2015Patterns and trends of high-impact weathers in China during 1959–2014
J. Shi et al.
Title Page
Abstract Introduction
Conclusions References
Tables Figures
◭ ◮
◭ ◮
Back Close
Full Screen / Esc
Printer-friendly Version
Interactive Discussion
Discussion
P
a
per
|
Discussion
P
a
per
|
Discussion
P
a
per
|
Discussion
P
a
per
|
tected in the frequency of foggy days in terms of the whole of China, and foggy days decreased at first and then increased and later decreased continuously (Fig. 2c). Shi et al. (2010) studied the change characteristics and causes of foggy days in eastern China and the results also indicated that the number of foggy days increased firstly and then decreased during 1961–2007. The significant decrease of foggy days had 5
also been observed in the Gansu and Shanxi Province of China (Wang et al., 2005). Spatially, the change trend of foggy days was not statistically significant in most parts of China (Fig. 5g). Akimoto and Kusaka (2015) studied the climatological characteristics of fog in Japan and the results indicated that the numbers of foggy days decrease at many of the observation sites during a 40 year period from 1966 to 2005. Temperature 10
increase or vapor reduction due to urbanization, global warming followed by synoptic-scale climate change, and variation in aerosol concentration, may affect the formation of fog (Shi et al., 2010; Akimoto and Kusaka, 2015). The decrease of fog in urban areas has also been reported in some cities in the US, where it is said to reflect an intensifi-cation of the heat island phenomenon caused by urbanization (LaDochy, 2005). 15
Due to their local-scale extent and large spatial and temporal variability (Baldi et al., 2014), and a lack of appropriate monitoring systems, hailstorms are not cap-tured reliably and comprehensively over long periods by current observation systems (Mohr and Kunz, 2013). However, in China, there are many stations with daily obser-vation of the occurrence or non-occurrence of hailstorm, and recordation of the size 20
of the largest hailstone (Brooks, 2013). A significant decreasing trend in the frequency of hailstorm days was detected in China during 1959–2014 (Fig. 2d). Xie et al. (2008) analyzed the variation and trend in hailstorm frequency during 1960–2005 in China and the results showed no trend in the mean annual hailstorm days from 1960 to early 1980s but a significant decreasing trend afterwards. Hailstorm damage is usually pro-25
NHESSD
3, 6149–6184, 2015Patterns and trends of high-impact weathers in China during 1959–2014
J. Shi et al.
Title Page
Abstract Introduction
Conclusions References
Tables Figures
◭ ◮
◭ ◮
Back Close
Full Screen / Esc
Printer-friendly Version
Interactive Discussion
Discussion
P
a
per
|
Discussion
P
a
per
|
Discussion
P
a
per
|
Discussion
P
a
per
|
Alps, Eccel et al. (2012) found that the size of hailstorm had increased, though the frequency or cumulative hit surface had no significant change over a number of years. From hail pad data over France between 1989 and 2009, Berthet et al. (2011) also found that the frequency of hailstorm did not change significantly during 1989–2009, while the intensity increased by 70 % during April and May.
5
Climate variability and change are key driving forces influencing the vulnerability, and therefore sustainability, of socioecological systems (IPCC, 2012). In recent years, society has faced a steep rise in economic and insured losses from weather and cli-mate related hazards, largely due to significant increase in exposure (Kunreuther and Michel-Kerjan, 2009). Globally, the annual average population exposed to flooding in-10
creased by 114 % during 1970–2010, while the world’s total population increased from 3.7 to 6.9 billion, with an increasing rate of 87 % (WMO, 2013). Various social changes, including an increasing number of people lived in high-risk coastal areas and major cities, a growing property and wealth exposed to meteorological or hydrological dis-asters, and the lifestyle changes, lead to the increase of social vulnerability and the 15
increasing losses from HIWs and natural hazards. In China, an increasing popula-tion lives in areas vulnerable to HIWs such as floods, rainstorms, thunderstorms and fogs, which becomes more important variables in hampering sustainable development, and increases the damage potentials of ecosystems and socio-economic sphere (Feng et al., 2007; Fischer et al., 2012).
20
Identifying and understanding the trend of societal vulnerability have great impor-tance for guiding governmental decisions and actions. Generally speaking, it is difficult to change the frequency and intensity of HIWs, so for the majority of natural hazards, we can only minimize the risk through reducing the societal exposure and/or vulner-ability (Shi and Cui, 2012). Improved weather forecasts and multi-hazard early warn-25
NHESSD
3, 6149–6184, 2015Patterns and trends of high-impact weathers in China during 1959–2014
J. Shi et al.
Title Page
Abstract Introduction
Conclusions References
Tables Figures
◭ ◮
◭ ◮
Back Close
Full Screen / Esc
Printer-friendly Version
Interactive Discussion
Discussion
P
a
per
|
Discussion
P
a
per
|
Discussion
P
a
per
|
Discussion
P
a
per
|
in the world during 2001–2010, thanks to powerful early warning systems, increased disaster preparedness and mitigation efforts, as well as multiple training for disaster re-sponse. For China, guidelines and policies for reducing social vulnerabilities, including but not limited to, the improvement of monitoring and warning capability of HIWs, the redesign and arrangement of infrastructure and socio-ecological systems to decrease 5
the risk of natural disasters, the enhancement of engineering design standards and/or defense measures according to the projections of future HIWs changes, the promo-tion of environmentally friendly methods and systems of energy producpromo-tion, and the encouragement of scientific research and technological development to make certain the nature and change of HIWs and to understand the vulnerability of human societies 10
and natural ecosystems (Zhai and Liu, 2012; Ly et al., 2013).
5 Conclusions
The spatial and temporal characteristics of four types of high-impact weathers (HIWs) were analyzed and the results show that during 1959–2014, significant decreasing trends were detected in the number of days and processes of snowfall, thunderstorm, 15
foggy and hailstorm weathers in China. The number of thunderstorm days and thunder-storm weather processes decreased continuously, and that of snowfall days, snowfall weather processes, hailstorm days and hailstorm weather processes slightly increased at first and then decreased continuously. The number of foggy days and foggy weather processes decreased firstly, then increased rapidly, and later decreased continuously 20
over the past 56 years.
Spatially, snowfall days and snowfall weather processes were more in northeastern and western China, but less in southern China, and thunderstorm days and thunder-storm weather processes were more in southern and southwestern China, but less in northwestern China. The number of foggy days and foggy weather processes was 25
NHESSD
3, 6149–6184, 2015Patterns and trends of high-impact weathers in China during 1959–2014
J. Shi et al.
Title Page
Abstract Introduction
Conclusions References
Tables Figures
◭ ◮
◭ ◮
Back Close
Full Screen / Esc
Printer-friendly Version
Interactive Discussion
Discussion
P
a
per
|
Discussion
P
a
per
|
Discussion
P
a
per
|
Discussion
P
a
per
|
in western China and Inner Mongolia, and hailstorm days and hailstorm weather pro-cesses were mainly concentrated on Qinghai–Tibet Plateau.
Over the past 56 years, snowfall days, thunderstorm days and thunderstorm weather processes decreased in most parts of China, and the decreasing trend of thunderstorm weathers was more in southern China than in northern China. The number of hailstorm 5
days decreased in northeastern China, most parts of northern China and western China, and that of hailstorm weather processes decreased only in north-central Tibet and southwestern Qinghai. The spatial trend of foggy days, foggy weather processes and snowfall weather processes was not significant in most parts of China.
The variation characteristics of snowfall days, thunderstorm days and foggy days in 10
China are mainly consistent with other existing results, but the characteristics of hail-storm days has some differences with the results from other countries or regions. With climate change and rapidly economic and social development, more population and wealth are exposed to HIWs and subsequent hazards in China, which undoubtedly increases the vulnerabilities of social economy systems, so more mitigation and adap-15
tation strategies for HIWs are essential and urgent for local government and the social publics.
Acknowledgements. The present research was supported by the National Natural Science
Foundation of China (No. 41571044 and 41001283) and China Clean Development Mechanism (CDM) Fund Project (No. 2012043). We thank Haizhen Mu and Zhongping Shen, Shanghai
Cli-20
mate Center, Shanghai Meteorological Bureau, China for their contributions.
References
Akimoto, Y. and Kusaka, H.: A climatological study of fog in Japan based on event data, Atmos. Res., 151, 200–211, 2015.
Baldi, M., Ciardini, V., Dalu, J. D., Filippis, T. D., Maracchi, G., and Dalu, G.: Hail occurrence in
25
Italy: towards a national database and climatology, Atmos. Res., 138, 268–277, 2014. Berthet, C., Dessens, J., and Sanchez, J. L.: Regional and yearly variations of hail frequency
NHESSD
3, 6149–6184, 2015Patterns and trends of high-impact weathers in China during 1959–2014
J. Shi et al.
Title Page
Abstract Introduction
Conclusions References
Tables Figures
◭ ◮
◭ ◮
Back Close
Full Screen / Esc
Printer-friendly Version
Interactive Discussion
Discussion
P
a
per
|
Discussion
P
a
per
|
Discussion
P
a
per
|
Discussion
P
a
per
|
Brooks, H. E.: Severe thunderstorms and climate change, Atmos. Res., 123, 129–138, 2013. Chen, S., Zhu, W., and Zhou, B.: Climate characteristic and variation tendency of thunderstorm
in China, Trans. Atmos. Sci., 32, 703–710, 2009.
China Meteorological Administration: Standard of the surface observation about meteorology, China Meteorological Press, Beijing, 151 pp., 2003.
5
de Lima, M. I. P., Santo, F. E., Ramos, A. M., and de Lima, J. L. M. P.: Recent changes in daily precipitation and surface air temperature extremes in mainland Portugal, in the period 1941–2007, Atmos. Res., 127, 195–209, 2013.
de Vyver, H. V.: Evolution of extreme temperatures in Belgium since the 1950s, Theor. Appl. Climatol., 107, 113–129, 2012.
10
Ding, Y., Feng, J., Ma, S., and Zheng, G.: Climate characteristics of snowfall day numbers in Ningxia and structure of atmospheric circulation, Meteorol. Mon., 38, 1523–1531, 2012. Done, J., Holland, G., Bruyère, C., Leung, L. Y. R., and Suzuki-Parker, A.: Modeling high-impact
weather and climate: lessons from a tropical cyclone perspective, Climatic Change, 129, 381–395, 2015.
15
Eccel, E., Cau, P., Riemann-Campe, K., and Biasioli, F.: Quantitative hail monitoring in an alpine area: 35 year climatology and links with atmospheric variables, Int. J. Climatol., 32, 503–517, 2012.
Feng, S., Nadarajah, S., and Hu, Q.: Modeling annual extreme precipitation in China using the generalized extreme value distribution, J. Meteorol. Soc. Jpn., 85, 599–613, 2007.
20
Fischer, T., Gemmer, M., Liu, L., and Su, B.: Change-points in climate extremes in the Zhujiang River Basin, South China, 1961–2007, Climatic Change, 110, 783–799, 2012.
Fu, G., Yu, J., Yu, X., Ouyang, R., Zhang, Y., Wang, P., Liu, W., and Min, L.: Temporal variation of extreme rainfall events in China, 1961–2009, J. Hydrol., 487, 48–59, 2013.
IPCC: Managing the risks of extreme events and disasters to advance climate change
adapta-25
tion, in: A special report of working groups I and II of the Intergovernmental Panel on Climate Change, edited by: Field, C. B., Barros, V., Stocker, T. F., Qin, D., Dokken, D. J., Ebi, K. L., Mastrandrea, M. D., Mach, K. J., Plattner, G.-K., Allen, S. K., Tignor, M., and Midgley, P. M., Cambridge University Press, Cambridge, UK, and New York, NY, USA, 582 pp., 2012. IPCC: Climate Change 2013: The Physical Science Basis, in: Contribution of Working Group I
30
NHESSD
3, 6149–6184, 2015Patterns and trends of high-impact weathers in China during 1959–2014
J. Shi et al.
Title Page
Abstract Introduction
Conclusions References
Tables Figures
◭ ◮
◭ ◮
Back Close
Full Screen / Esc
Printer-friendly Version
Interactive Discussion
Discussion
P
a
per
|
Discussion
P
a
per
|
Discussion
P
a
per
|
Discussion
P
a
per
|
Xia, Y., Bex, V., and Midgley, P. M., Cambridge University Press, Cambridge, UK and New York, NY, USA, 1535 pp., doi:10.1017/CBO9781107415324, 2013.
Jiang, Z., Song, J., Li, L., Chen, W., Wang, Z., and Wang, J.: Extreme climate events in China: IPCC-AR4 model evaluation and projection, Climatic Change, 110, 385–401, 2012.
Kruger, A. C. and Sekele, S. S.: Trends in extreme temperature indices in South Africa: 1962–
5
2009, Int. J. Climatol., 33, 661–676, 2013.
Kunreuther, H. and Michel-Kerjan, E.: At War With the Weather: Managing Large-scale Risks in a New Era of Catastrophes, MIT Press, New York, 416 pp., 2009.
LaDochy, S.: The disappearance of dense fog in Los Angeles: another urban impact?, Phys. Geogr., 26, 177–191, 2005.
10
Li, J., Swinbank, R., Ding, R., and Duan, W.: Dynamics and predictability of high-impact weather and climate events, B. Am. Meteorol. Soc., 94, ES179–ES182, 2013.
Ly, M., Traore, S. B., Alhassane, A., and Sarr, B.: Evolution of some observed climate extremes in the West African Sahel, Weather Clim. Extrem., 1, 19–25, 2013.
Marsh, P. T., Brooks, H. E., and Karoly, D. J.: Preliminary investigation into the severe
thunder-15
storm environment of Europe simulated by the Community Climate System Model 3, Atmos. Res., 93, 607–618, 2009.
Mohr, S. and Kunz, M.: Recent trends and variabilities of convective parameters relevant for hail events in Germany and Europe, Atmos. Res., 123, 211–228, 2013.
Niu, T., Chen, L., and Zhou, Z.: The characteristics of climate change over the Tibetan Plateau
20
in the last 40 years and the detection of climatic jumps, Adv. Atmos. Sci., 21, 193–203, 2004. Shi, J. and Cui, L.: Characteristics of high impact weather and meteorological disaster in
Shang-hai, China, Nat. Hazards, 60, 951–969, 2012.
Shi, J., Cui, L., He, Q., and Sun, L.: The changes and causes of fog and haze days in eastern China, Acta Geogr. Sin., 65, 533–542, 2010.
25
Shi, J., Chen, B., Mu, H., and Liang, P.: Characteristics and causes of high-impact weathers in the Yangtze River Delta, Plateau Meteorol., 34, 173–182, 2015.
Sills, D. M.: On the MSC forecasters forums and the future role of the human forecastser, B. Am. Meteorol. Soc., 90, 619–627, 2009.
Sun, Y., Zhang, X., Zwiers, F. W., Song, L, Wan, H., Hu, T., Yin, H., and Ren, G.: Rapid increase
30
NHESSD
3, 6149–6184, 2015Patterns and trends of high-impact weathers in China during 1959–2014
J. Shi et al.
Title Page
Abstract Introduction
Conclusions References
Tables Figures
◭ ◮
◭ ◮
Back Close
Full Screen / Esc
Printer-friendly Version
Interactive Discussion
Discussion
P
a
per
|
Discussion
P
a
per
|
Discussion
P
a
per
|
Discussion
P
a
per
|
Wang, L., Chen, S., and Dong, A.: The distribution and seasonal variations of fog in China, Acta Geogr. Sin., 60, 689–697, 2005.
Wang, S., Zhang, M., Wang, B., Sun, M., and Li, X.: Recent changes in daily extremes of temperature and precipitation over the western Tibetan Plateau, 1973–2011, Quatern. Int., 313–314, 110–117, 2013.
5
Wang, Y., Zhao, C., Yan, X., and Li, D.: Changing characteristics of snowfall and snowfall days in Liaoning Province during 1961–2007, J. Glaciol. Geocryol., 33, 729–737, 2011.
WMO: The Global Climate 2001–2010: a decade of climate extremes, WMO – no. 1103, World Meteorological Organization, Geneva, Switzerland, 110 pp., 2013.
Wu, J., Fu, Y., Zhang, J., and Li, N.: Meteorological disaster trend analysis in China: 1949–2013,
10
Nat. Resour. J., 29, 1520–1530, 2014.
Xie, B., Zhang, Q., and Wang, Y.: Trends in hail in China during 1960–2005, Geophys. Res. Lett., 35, L13801, doi:10.1029/2008GL034067, 2008.
Xie, B., Zhang, Q., and Wang, Y.: Observed characteristics of hail size in four regions in China during 1980–2005, J. Climate, 23, 4973–4982, 2010.
15
Yu, R., Zhang, X., Li, G., and Gao, Q.: Analysis of frequency variation of thunderstorm, hail and gale in eastern China from 1971 to 2000, Meteorol. Mon., 38, 1207–1216, 2012.
Zhai, P. and Liu, J.: Extreme weather/climate events and disaster prevention and mitigation under global warming background, Eng. Sci., 14, 55–63, 2012.
Zhang, Q., Xu, C. Y., Zhang, Z., Ren, G., and Chen, Y. D.: Climate change or variability? The
20
case of Yellow river as indicated by extreme maximum and minimum air temperature during 1960–2004, Theor. Appl. Climatol., 93, 35–43, 2008.
Zhu, X., Zhang, M., Wang, S., Li, X., Dong, L., and Ren, Z.: Spatiotemporal variation patterns of the beginning and ending dates of snowfall, and snowfall days in Qinghai Province during 1962 to 2012, Chinese, J. Ecol., 33, 761–770, 2014.
NHESSD
3, 6149–6184, 2015Patterns and trends of high-impact weathers in China during 1959–2014
J. Shi et al.
Title Page
Abstract Introduction
Conclusions References
Tables Figures
◭ ◮
◭ ◮
Back Close
Full Screen / Esc
Printer-friendly Version
Interactive Discussion
Discussion
P
a
per
|
Discussion
P
a
per
|
Discussion
P
a
per
|
Discussion
P
a
per
|
Table 1.Annual average days of high-impact weathers in China for different periods.
High-impact weathers Periods of time
1959–1970 1971–1980 1981–1990 1991–2000 2001–2014
NHESSD
3, 6149–6184, 2015Patterns and trends of high-impact weathers in China during 1959–2014
J. Shi et al.
Title Page
Abstract Introduction
Conclusions References
Tables Figures
◭ ◮
◭ ◮
Back Close
Full Screen / Esc
Printer-friendly Version
Interactive Discussion
Discussion
P
a
per
|
Discussion
P
a
per
|
Discussion
P
a
per
|
Discussion
P
a
per
|
Table 2.Average annual number of high-impact weather processes in China for different peri-ods.
High-impact weather process Periods of time
1959–1970 1971–1980 1981–1990 1991–2000 2001–2014
Snowfall 4.35 4.46 4.30 3.69 3.09
Thunderstorm 4.66 4.38 3.95 3.51 2.91
Fog 1.02 1.12 1.17 1.02 0.81
NHESSD
3, 6149–6184, 2015Patterns and trends of high-impact weathers in China during 1959–2014
J. Shi et al.
Title Page Abstract Introduction Conclusions References Tables Figures ◭ ◮ ◭ ◮ Back Close
Full Screen / Esc
Printer-friendly Version Interactive Discussion Discussion P a per | Discussion P a per | Discussion P a per | Discussion P a per |
500 0 500 1000 Kilometers Province boundary Guangdong Jiangsu Beijing Tibet Xinjiang Qinghai Inner Mongolia Yunnan Heilongjiang Liaoning Shandong Henan Hunan Gansu Guangxi Fujian Shanxi Zhejiang Jiangxi Hubei Anhui Taiwan Hainan Sichuan Jilin Hebei Shannxi Guizhou # # # # # # # # # # # # ## ## ## #### # # # # # ##### # # ## # ### # # # # ## # # # ## # # ### # # # # # ### # # # # # #### # # # # ### # # # # ### # # # # # # # # # # # # ## # ## # # # # # ###### # # # # # # # # # ## # ## # # ## ## # # # # # # # # # # # # # ### ## ## # # ## ### ## ## # ## ## # # # ## # #### # # ## # # # #### # # # ## ## # # # # # # # # ## # # # ###### ### # ### ## ######## ##### ## # # ## ## ## ### # ### # # # #### # # # ##### # ## ## ### # # # # # # # # # ## # ## # # # # # # ### # ## ## # # #### ### # # # # # # # # ## # ## # #### # ## ## ## # ## # # # # # # # # #### ## ## # ### # #### ## ## # # ## # ####### # # #### ## # # #### # ### # # # # # # # # #### # ## # # # # # # # # # ## # # # # # # ###### # # ### ## ### ## # ## # # #### # # ### ## # ## # # ## # # # ### # # # ## ####### ## # #### # # #### #### ###### ## # ## # ##### ##### # # # # ## # ## # # # # # ## # ## # ##### ### ### # # # ## ###### ## # # # # ## # ## #### #### # # # ### ## #
500 0 500 1000 Kilometers
# Meteorological station
(a) (b)
NHESSD
3, 6149–6184, 2015Patterns and trends of high-impact weathers in China during 1959–2014
J. Shi et al.
Title Page Abstract Introduction Conclusions References Tables Figures ◭ ◮ ◭ ◮ Back Close
Full Screen / Esc
Printer-friendly Version Interactive Discussion Discussion P a per | Discussion P a per | Discussion P a per | Discussion P a per |
y = -0.25 x + 530.90
R2 = 0.65 22 27 32 37 42 47
1959 1964 1969 1974 1979 1984 1989 1994 1999 2004 2009 2014
A nnua l s now fa ll da ys
y = -0.26 x + 546.89
R2 = 0.86 28 33 38 43 48
1959 1964 1969 1974 1979 1984 1989 1994 1999 2004 2009 2014
A nnua l t hunde rs tor m da ys
y = -0.08 x + 169.36
R2 = 0.43 8 10 12 14 16 18
1959 1964 1969 1974 1979 1984 1989 1994 1999 2004 2009 2014
A
nnua
l f
oggy da
ys
y = -0.05 x + 92.45
R2 = 0.74 0.5 1.2 1.9 2.6 3.3 4
1959 1964 1969 1974 1979 1984 1989 1994 1999 2004 2009 2014
A nnua l ha il st or m da ys
(a) (b)
(c) (d)
NHESSD
3, 6149–6184, 2015Patterns and trends of high-impact weathers in China during 1959–2014
J. Shi et al.
Title Page Abstract Introduction Conclusions References Tables Figures ◭ ◮ ◭ ◮ Back Close
Full Screen / Esc
Printer-friendly Version Interactive Discussion Discussion P a per | Discussion P a per | Discussion P a per | Discussion P a per |
y = -0.86 x + 1897.70
R2 = 0.36 110 140 170 200 230 260
1959 1964 1969 1974 1979 1984 1989 1994 1999 2004 2009 2014
M a x s now fa ll da ys
y = -0.63 x + 1378.84
R2 = 0.55 90 100 110 120 130 140 150
1959 1964 1969 1974 1979 1984 1989 1994 1999 2004 2009 2014
M a x t hunde rs tor m da ys
y = -0.34 x + 989.35
R2 = 0.32 290 300 310 320 330 340
1959 1964 1969 1974 1979 1984 1989 1994 1999 2004 2009 2014
M
a
x f
oggy da
ys
y = -0.26 x + 551.40
R2 = 0.31 15 25 35 45 55
1959 1964 1969 1974 1979 1984 1989 1994 1999 2004 2009 2014
M a x ha il st or m da ys
(a) (b)
(c) (d)
NHESSD
3, 6149–6184, 2015Patterns and trends of high-impact weathers in China during 1959–2014
J. Shi et al.
Title Page
Abstract Introduction
Conclusions References
Tables Figures
◭ ◮
◭ ◮
Back Close
Full Screen / Esc
Printer-friendly Version
Interactive Discussion
Discussion
P
a
per
|
Discussion
P
a
per
|
Discussion
P
a
per
|
Discussion
P
a
per
|
Figure 4.Spatial distribution of annual days of high-impact weathers in China during 1959– 2014 (unit: days yr−1; (a) snowfall days;(b) thunderstorm days; (c)foggy days; (d)hailstorm
NHESSD
3, 6149–6184, 2015Patterns and trends of high-impact weathers in China during 1959–2014
J. Shi et al.
Title Page
Abstract Introduction
Conclusions References
Tables Figures
◭ ◮
◭ ◮
Back Close
Full Screen / Esc
Printer-friendly Version
Interactive Discussion
Discussion
P
a
per
|
Discussion
P
a
per
|
Discussion
P
a
per
|
Discussion
P
a
per
|
Figure 5. Spatial trend of annual days of high-impact weathers in China during 1959–2014 (unit: days decade−1; (a) snowfall days; (b) thunderstorm days; (c) foggy days; (d)hailstorm