73
LITHUANIANă CONSUMERS’ă ATTITUDESă ANDă PURCHASINGă
BEHAVIOUR TOWARDS DOMESTIC LIVESTOCK PRODUCTS
Ovidija EIČAITĖ,ăVidaăDABKIENĖ
Lithuanian Institute of Agrarian Economics, LAEI, 18–2, V. Kudirkos Street, 03105, Vilnius, Lithuania, Phone: 00 370 5 262 2429, E-mail: ovidija@laei.lt; vida@laei.lt
Corresponding author: ovidija@laei.lt
Abstract
This study aimed to identify and analyze Lithuanian consumers’ attitudes and purchasing behaviour towards domestic livestock products. In order to get necessary information, Lithuanian residents were interviewed. A multi-stage stratified random sampling was used to select the respondents. This study draws on a survey of 1009 respondents. The analysis of collected data was performed using the methods of mathematical statistics. The results suggest that the vast majority of Lithuanian consumers regularly buy domestic livestock products. Among this group of respondents, the top reasons for purchasing are freshness, good taste and favourable prices. Only a small share of Lithuanian consumers rarely or never buys domestic livestock products. Among this group of respondents, the top reasons for not purchasing are unfavourable prices, short shelf-life and insufficient range of products. Domestic livestock products buyers tend to be older, higher educated and have higher level of income than non-buyers.
Key words: attitudes, purchasing behaviour, domestic livestock products, Lithuania
INTRODUCTION
Due the globalization, the food market is affected by import of food products. Recently the import of livestock products is constantly increasing in Lithuania. In 2013, compared to 2011, the value of imported dairy products, eggs and milk grew by 23% and the value of imported meat and sub-products rose by 46% [1, 2]. The distribution of imported livestock products had some impact on Lithuanian consumer preferences and purchasing behaviour. During the period of 2011–2013 the shares of some Lithuanian livestock product categories sold on the domestic market decreased, i.e. for dairy products from 86 to 82% and for eggs from 85 to 83%. Though the share of Lithuanian meat products sold on the domestic market remained the same (56%) [1, 6]. Due these changes on the domestic market, there is a need to analyze consumers’ attitudes and purchasing behaviour towards domestic livestock products. The Lithuanian preferences neither for domestic food products nor for livestock products have not yet been examined.
Studies on consumers’ attitudes and perceptions towards domestic and foreign
food products have been carried out in different countries. The researchers from UK summarizes the outcome of a nationally representative consumer survey conducted to examine consumers’ attitudes and behaviour towards and willingness to pay for local and national foods compared to imported alternatives. The results indicated that attitudes towards local food purchase were generally positive, with most respondents believing them to be tastier and fresher [5]. The study in Serbia determined the consumer perception of Serbian agricultural and food products and especially perception of home-made products. The main finding was that the most important advantages of domestic agricultural and food products were quality, tradition in the production, domestic origin of products, favourable price and safety. The greatest weaknesses of domestic agricultural and food products were poor marketing, changeable and not the highest quality, and inadequate package [7].
PRINT ISSN 2284-7995, E-ISSN 2285-3952
74
because of their flavour and freshness [3]. The study in Romania examined the consumer preferences for different categories of domestic and imported food products. It was found that the majority of respondents said they prefer domestic products from Romanian manufacturers. Taste, freshness and being natural were the strengths of Romanian products. The most important weaknesses were small hygienic control, unsafe ingredients used, uncertain shelf-life and unattractive package [4].
MATERIALS AND METHODS
The aim of this paper is to identify and analyze Lithuanian consumers’ attitudes and purchasing behaviour towards domestic livestock products. In order to achieve this aim and collect data, a survey method was used. In total, 1009 Lithuanian residents aged 18 year and over were interviewed across the country. The results of such size sample have an error of no more than plus/minus 3%. A multi-stage stratified random sampling was used to select the respondents. All respondents were screened to be consumers of livestock products.
The survey was carried out from August to September in 2014 by Lithuanian-British market research and public opinion company “Baltic Surveys Ltd.” Respondents were interviewed face-to face in their homes, using a standardized questionnaire. The questionnaire included questions on factors influencing the purchase decisions of livestock products, frequency of purchasing domestic livestock products, main motives and barriers to purchasing domestic livestock products. Additional questions were designed to determine socio-demographic characteristics of respondents (i.e. gender, age, personal income, educational level and main occupation).
The statistical package for social science (SPSS) was employed for processing and analyzing of collected data. Out of 1009 survey respondents, women accounted for 55.1% and men 44.9% of the sample group. The distribution of respondents by age was as follows: 20.5% were between the ages of
18-29 years, 34.1% were between the ages of 30-49 years and 45.4% were 50 years old and over. While 21.6% of respondents indicated a monthly income of less than 1500 LTL (1 EUR = 3.4528 LTL), 24.1% reported their monthly income was within the range of 1501-2500 LTL and 26.2% claimed a monthly income of more than 2500 LTL. The other respondents (28.1%) did not reveal their income. As concerns educational level, 45.0% of respondents had higher education, 44.3% had secondary education and 10.7% had incomplete secondary education. Regarding main occupation, 25.9% of respondents were in a white-collar occupation, 28.7% were in a blue-collar occupation and 45.4% were non-workers (students, retired individuals, unemployed people and housekeepers). According to frequency of purchasing domestic livestock products, respondents were divided into two groups: domestic livestock products buyers, i.e. those who always, often and sometimes buy domestic livestock products, and non-buyers, i.e. those who rarely and never buy domestic livestock products. The significant differences between domestic livestock products buyers and non-buyers were determined using a Chi-square test. A p value of less than 0.05 (p < 0.05) was considered to indicate a statistically significant difference. In order to make comparisons between all pairs of groups, post hoc tests were conducted.
RESULTS AND DISCUSSIONS
The first part of the analysis focuses on the factors influencing the purchase decisions of livestock products. All respondents were asked to rank the importance (on a scale of 1 to 5 with 1 as very unimportant and 5 as very important) of ten attributes in selecting livestock products that they purchase. The main intention of asking this question was to find out whether Lithuanian customers consider domestic origin as an important factor when choosing livestock products. Table 1 presents the mean scores of all attributes.
75 mean score of 4.66. 94% of respondents said
that freshness was very important or important for their choice of livestock products.
Table 1. Importance of livestock products attributes ranked by mean score
Attribute Mean score
Freshness 4.66
Taste 4.52
Price 4.46
Healthiness 4.22 Lithuanian origin 4.16 Appearance 4.12
Organic 3.83
Environmental impact 3.50 Animal welfare 3.44
Brand 3.06
Other top ranked attributes included taste, price and healthiness. Lithuanian origin came in the fifth place with mean score of 4.16. 77% of respondents said that Lithuanian origin was very important or important for their choice of livestock products.
The second part of analysis focuses on the purchasing behaviour towards domestic livestock products and socio-demographic characteristics that distinguish between domestic livestock buyers and non-buyers. All respondents were asked to indicate how frequently they purchase domestic livestock products. A simple 5-point scale (with response categories, such as always, often, sometimes, rarely or never) was used, but allowing a “Don’t know” category. As survey results show, the vast majority of respondents were domestic livestock products buyers (88.2%): 19.3% reported always buying domestic livestock products, 60.0% indicated often buying and 8.9% reported sometimes buying. Only a small share of respondents was non-buyers (7.6%): 6.1% reported rarely buying domestic livestock products and 1.5% of respondents indicated never buying domestic livestock products. 4.2% of respondents replied “Don’t know”. Figure 1 shows the frequency of purchasing domestic livestock products by socio-demographic characteristics.
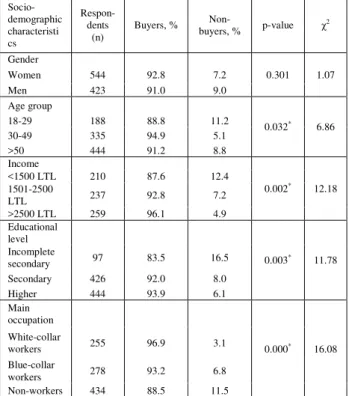
In the socio-demographic characteristics, four of five characteristics indicated significant differences between domestic livestock buyers and non-buyers (Table 2). Specifically,
there were significant differences between the two groups for age, income, educational level and main occupation.
Domestic livestock products buyers tended to be middle-aged and non-buyers tended to be young. Respondents with the highest income and higher education were more likely to buy domestic livestock products. Conversely, respondents with the lowest income and incomplete secondary education were least likely to buy these products. Domestic livestock products buyers were more likely to be in a white-collar occupation and non-buyers were more likely to be non-workers.
Table 2. Socio-demographic characteristics of domestic livestock products buyers and non-buyers
Socio-demographic characteristi cs Respon- dents (n)
Buyers, %
Non-buyers, % p-value χ
2
Gender
0.301 1.07
Women 544 92.8 7.2
Men 423 91.0 9.0
Age group
0.032* 6.86
18-29 188 88.8 11.2
30-49 335 94.9 5.1
>50 444 91.2 8.8
Income
0.002* 12.18
<1500 LTL 210 87.6 12.4
1501-2500
LTL 237 92.8 7.2
>2500 LTL 259 96.1 4.9
Educational
level
0.003* 11.78
Incomplete
secondary 97 83.5 16.5
Secondary 426 92.0 8.0
Higher 444 93.9 6.1
Main
occupation
0.000* 16.08
White-collar
workers 255 96.9 3.1
Blue-collar
workers 278 93.2 6.8
Non-workers 434 88.5 11.5
Notes: All n did not add up to total number of respondents because of missing data.
*Statistically: p < 0.05 (Chi-square test).
In terms of age, the highest percentage of domestic livestock products buyers was found in respondents between the ages of 30-49 years (94.9%).
PRINT ISSN 2284-7995, E-ISSN 2285-3952
76
Fig.1. Frequency of purchasing domestic livestock products by: A – age of respondents; B – monthly income; C – educational level; D – occupation (all respondents)
Significantly more respondents with the highest income (96.1%) bought domestic livestock products as compared to respondents with the lowest income (87.6%) (p = 0.01). There was no statistically significant difference in the percentage of respondents with income of more than 2500 LTL and respondents with income of 1501-2500 LTL (92.8%) (p = 0.104) who bought domestic livestock products. The percentage of domestic livestock products buyers was slightly higher for respondents with higher education (93.9%) than respondents with secondary education (92.0%), the difference was not statistically significant (p = 0.273). Significantly more respondents with higher and secondary education bought domestic
livestock products as compared to respondents with incomplete secondary education (83.5%) (p < 0.000 and p = 0.010, respectively). In terms of main occupation, the highest percentage of domestic livestock buyers was found in white-collar workers (96.9%). This percentage was not significantly greater than that found in blue-collar workers (93.2%) (p = 0.052). Significantly more white-collar workers and blue-collar workers bought domestic livestock products as compared to non-workers (88.5%) (p < 0.000 and p = 0.039, respectively).
77 domestic livestock products was freshness (a
reason for 75% of buyers) (Fig. 2). This factor was more often mentioned by women, the respondents of 30-49 years old, the consumers with the highest income (more than 2500 LTL) and higher education and the persons in a blue-collar occupation. Further reasons for purchasing domestic livestock products were good taste (55%) and favourable prices (49%). Good taste as a motive to purchasing domestic livestock products was more often declared by women, the respondents of 18-29 years old, the consumers with the highest income (more than 2500 LTL) and secondary education and the persons in a white-collar occupation. Favourable prices as a motive to purchasing domestic livestock products was more often indicated by men, the respondents of 30-49 years old, the consumers with the lowest income (less than 1500 LTL) and incomplete secondary education and the persons in a blue-collar occupation.
Fig.2. Main reasons for purchasing domestic livestock products
The non-buyers were asked why they did not purchase domestic livestock products. Among this group of respondents, predictably, the most important reason for not purchasing domestic livestock products was unfavourable prices (a reason for 55% of non-buyers) (Fig. 3). This factor was more often mentioned by men, the oldest respondents (age group of 50 years old and over), the customers with the lowest income (less than 1500 LTL) and secondary education and non-workers. Further reasons for not purchasing domestic livestock products were short shelf-life (15%) and
insufficient range of products (15%). Short shelf-life as a barrier to purchasing domestic livestock products was more often declared by men, the respondents of 30-49 years old, the customers with the lowest income (less than 1500 LTL) and secondary education and the persons in a white-collar occupation. Insufficient range of products as a barrier to purchasing domestic livestock products was more often indicated by men, the young respondents (age group of 18-29 years old), the consumers with the highest personal income (more than 2500 LTL) and secondary education and the persons in a white-collar occupation.
Fig.3. Main reasons for not purchasing domestic livestock products
CONCLUSIONS
This study aimed to identify and analyzing Lithuanian consumers’ attitudes and purchasing behaviour towards domestic livestock products. The survey results suggest that for consumers, the most important factor influencing the purchase decisions of livestock products was freshness. Although Lithuanian origin was not top ranked attribute, 77% of respondents pointed out that this attribute was very important or important when buying livestock products.
PRINT ISSN 2284-7995, E-ISSN 2285-3952
78
livestock products. The non-buyers were more likely to be young, had a lower level of income and incomplete secondary education and were non-workers.
For buyers, the main motives to purchasing domestic livestock products were freshness, good taste and favourable prices. For non-buyers, the main barriers to purchasing
domestic livestock products were
unfavourable prices, short shelf-life and insufficient range of products.
REFERENCES
[1]Agriculture in Lithuania 2012. Vilnius: Statistics Lithuania, 2013. ISSN 2029-3658.
[2]Foreign trade data statistics [2014 1 05]. http://db1.stat.gov.lt/statbank/SelectTable/Omrade0.asp ?SubjectCode=S6&ShowNews=OFF&PLanguage=0 [3]Kretter, A., Kadekova, Z., Sedlakova, J., 2010, Country of origin of the food and consumer preferences in segment of university students, Delhi Business Review, 2010, 11 (2): 569-63.
[4]Ladaru, R.G., Cirstea, A.C., 2013, Study of consumers preferences for domestic vs imported food products, in: Popescu, G., Istudor, N., Boboc, D. Competitiveness of agro-food products and environmental economy, Romania, 394-400.
[5]Lobb, A.E., Arnoult, M.H., Chambers, S.A., 2006,
Willingness to pay for, and consumers’ attitudes to,
local, national and imported foods: A UK survey, Workpackage No 2, 3-61.
[6]Production of commodities 2009–2013. Vilnius: Statistics Lithuania. ISSN 1648-5777.