AACL BI OFLUX
Aqu a cu lt u r e , Aqu a r iu m , Con se r va t ion & Le gisla t ion
I n t e r n a t ion a l Jou r n a l of t h e Bioflu x Socie t y
D e t e r m in a n t s of r u ra l h ou se h old w illin gn e ss t o
pa y for sa fe w a t e r in Kw a ra St a t e , N ige r ia
Laudia Tit ilola Ogunniyi, Wasiu Adekunle Sanusi, and Ayinde Alani Ezekiel
Depart m ent of Agricult ural Econom ics, Ladok e Ak int ola Universit y of Technology, Ogbom oso, Oy o St at e, Nigeria. Corresponding aut hor: L. T. Ogunniy i,
t it iogunniyi@yahoo. com , Ogunniyi@laut ech.edu. ng
Abst r a ct. The paper exam ines t he use of t he cont ingent valuat ion m et hod t o st udy t he det er m inant s of r ur al households’ willingness t o pay ( WTP) for safe wat er in Kwar a St at e. A sam ple of 12 0 h ouseholds was sur veyed and a Tobit m odel was applied t o explain household pr efer ences for qualit y and quant it y of dom est ic wat er supply and der ive est im at es of WTP for such a ser vice. The r esult s confir m t hat household age had a negat ive and st at ist ically significant im pact on WTP for bot h quant it y and qualit y. I ncom e, wat er consum pt ion and wat er sour ce ar e p osit ively associat ed wit h WTP for bet t er quant it y but wit h a negat ive sign. This im plies t hat t he m or e t he incom e, wat er consum es, wat er sour ce, t he less t hat household would be WTP for bet t er wat er quant it y. Willingness t o pay for im pr oved w at er qualit y is posit ively r elat ed t o wait ing t im e and educat ion. Rur al households showed a m uch higher WTP for bet t er wat er quant it y t han for im pr oved wat er qualit y. Ther e is t her efor e scope t o im pr ove wat er ser vice levels in t he st udy ar ea.
Ke y W or ds: Willingness t o pay, wat er , r ur al, qualit y, quant it y.
I n t r odu ct i on. Access t o safe w at er suppl y has been one of t he t op pri orit i es i n
dev el opi ng count ri es ov er t he past t hree t o f our decades and m oney had been i nv est ed i n pur suit of t he goal of univ ersal ser v i ce ( World Bank 2005) and y et t he gener al consensus at t he 2002 Uni t ed Nat i on Worl d Sum m it on sust ainable dev el opm ent w as t hat t he cur r ent r ealit y as w ell as t he si t uat i on ex pect ed i n t he near f ut ur e ar e f ar f r om t he goal ( Uni t ed Nat i ons 2002) . I n f act r ecent r eport s em phasi ze t hat t he w orld i s f aci ng a seri ous w at er crisis and w at er access and serv ice deliv ery i n t he dev el opi ng w orl d need t o be i m pr ov ed dram at i cally and ur gent ly especially i f w e ar e t o m ak e gai ns i n fight agai nst pov ert y , hunger and disease ( UN/ WWAP 2003) .
Worl d l eaders not onl y agr ee t hat w at er is an i m port ant part of cor e dev el opm ent agenda but hav e also com m i t t ed t o am bi t ious t ar get s f or ex pandi ng access t o w at er ser v ices. At t he Unit ed Nat ions Mill enni um Sum m i t i n 2000 and subsequent ly at t he Johannesbur g Eart h Sum m it i n 2002, w orl d leader s agreed t o a set of t im e bound and m easurable dev el opm ent t ar get s w idely k now n as t he Millenni um Dev el opm ent Goal s f or 2015 w hi ch i ncl ude a com m it m ent t o halv e t he pr opor t i on of people w i t hout access t o saf e dri nk i ng w at er .
Many ex pert s seem t o agree t hat poor access t o w at er supply is oft en a r esult of poor polici es and m anagem ent pr act ices; how ev er t here is signi ficant di sagr eem ent ov er t he appr oach t o addr essi ng t he pr oblem . I n di r ect opposit i on t o l obbies dem andi ng t hat w at er be t r eat ed as a hum an r ight , ex per t s at agencies such as t he Uni t ed Nat i ons and t he World Bank ar gue t hat a f i rst or cr ucial st ep t ow ard i m pr ov i ng t he w at er si t uat i on and it s m anagem ent is t o t reat w at er as an econom i c good ( World Bank 2003; UN/ WWAP 2003) .
w at er f or el ect ricit y generat i on w hi ch i n t ur n has l ead t o i ncessant el ect ricit y supply ex peri ence t hr oughout t he count ry ( WHO 2002) .
The dem and f or saf e w at er ref ers t o t he r elat ionship bet w een prices char ged f or safe w at er and t he am ount of saf e w at er use by househol ds. Vi r t ually all of t he ex i st i ng st udi es of r esi dent ial w at er dem and hav e f ocused on w at er sy st em s serv i ng l ar ge popul at ions and negl ect i ng sm all sy st em s i n light of di f ficul t ies encount ered in ef f or t s t o acqui re dat a due t o l ow educat i on l ev el ( Ronal d et al 2007) .
I n Nigeria, w at er is generally regarded m ore or less as a nat ure giv en resource. I t is also seen as a public good, how ev er, t he form in w hich w at er is used eit her in t erm s of consum pt ion or product ion act ivit ies are not free in t he st rict econom ic sense, access t o clean pot able w at er is ident ified. Wat er can also be considered as a unit ary service since all w at er in t he hy drological cycle form s part of one w hole ( Olow a & Om onona 2008) .
The dev el opm ent of t he w at er r esour ces i n Ni ger ia holds im m ense pot ent ial f or dev el opm ent and gr ow t h of t he agricul t ur al sect or and ov er all econom i c gr ow t h. I nt ense st udi es hav e been car ried out on r ur al w at er, r ur al w at er dem and, m anagem ent and pl anni ng but w it h di f fer ent debat es on it s ef ficiency , source and ut ili t y . St udy on r ur al household dem and f or saf e w at er becom es necessary because of i t s i ncl usi on i n al m ost ev er y li fe act iv it i es. The li f e act iv i t ies could be di r ect dri nk i ng, heat dri nk i ng ( eat i ng) , cleani ng, t o m ent i on but a few . Rural household dem and f or saf e w at er encom passes t he pr ov isi on of pot able w at er as i t s absence could lead t o det rim ent al ef f ect s on ani m al s and pl ant s. Al so, w at er det er m i nes t he ex t ent t o w hi ch m i cr obes i n st aple f ood, f r esh f ood and t he env ir onm ent s w oul d be eli m i nat ed t hus i ncr easi ng hum ani t y saf et y m argi n ( Duane & Bol and 2001) .
Many schol ar s cl aim ed t hat w at er supply pr oj ect s could be sust ai nable w hen consum ers ar e w illing t o pay user s char ges t hat ar e suf fici ent t o cov er all cost s in ex cess of gr ant s. Willi ngness t o pay ( WTP) can be const r ued as an i ndicat i on of t he dem and f or i m pr ov ed serv i ces and t heir pot ent ial sust ai nabilit y ( Kaliba et al 2003) . I n cont r ast , ot her obser v er s hav e concluded t hose r ur al w at er sy st em s are unlik ely t o be sust ai nabl e unl ess gr ant s are av ailable t o fi nance m ost or all i nit i al const r uct i on cost ( Bohm et al 1998) .
The m ain obj ect iv es of t his st udy w ere t o det erm ine how m uch Nigerian rural households are willing t o pay ( WTP) for an im prov em ent in t heir w at er qualit y and quant it y as w ell as est ablishing t he possible fact ors affect ing t heir WTP. Specifically , t he st udy is designed t o:
- ex am ine t he w at er source and t he source charact erist ics;
- quant ify t he WTP for im prov ed w at er qualit y and quant it y by t he households in rural area;
- inv est igat e t he det erm inant s of t heir WTP.
M a t e r ial an d Me t h od. The st udy w as carried out in Asa Local Gov ernm ent Area of
Kw ara St at e, bet ween March and June 2008. I t is sit uat ed in t he ext erior part of Kw ara St at e, w hich is locat ed in t he m iddle belt region of Nigeria. The Local Gov ernm ent is large and som e of t he im port ant v illages are Ot t e, At ogbede, Afon, Ow ode, Budo Adio and Odunj o. The populat ion of t he st udy area is 126435 according t o 2006 census. The people are predom inant ly farm ers.
The t arget populat ion of t his st udy w as defined as households t hat use w at er for dom est ic purposes in Asa Local Gov ernm ent Area of Kw ara St at e. A m ult ist age random sam pling t echnique w as used in select ing t he respondent s. The t hree dist rict s w ere t ak en as t he sam pling unit s as a first st age of sam pling. At t he second st age, t w o v illages were random ly select ed t o represent t he dist rict m aking a t ot al of six villages. The last st age inv olv ed random select ion of t w ent y respondent s in each village m aking a t ot al of one hundred and t w ent y respondent s ( 120) . Prim ary dat a w as collect ed wit h t he aid of a w ell st ruct ured quest ionnaires and int erview schedules ( see Annex 1) . The dat a w as analy zed using descript iv e st at ist ics and Tobit regression.
w at er ( Mit chell & Carson 1989) . Whit t ingt on et al ( 1993) hav e carried out cont ingent v aluat ion st udies of households' WTP for im prov ed sanit at ion services. Banda et al ( 2004) applied a CVM t o analy ze det erm inant s of qualit y and quant it y v alues of w at er for dom est ic uses in t he St eelpoort sub- basin of Sout h Africa. A Tobit m odel w as applied t o household surv ey dat a, t o ex plain household preferences for qualit y and quant it y of dom est ic w at er supply and t o deriv e est im at es of WTP for such a service. The Tobit m odel t ak es t he following funct ional form ( Tobin 1958) :
yi = xi β + εi ( 1)
w here:
yi = yi if yi > 0 ( 2)
or:
yi = 0 if yi ≤0 ( 3)
The v ariable yi is t he observ ed cont ingent v aluat ion bid by individual i, yi is a
lat ent m easure, xi are the independent variables. β is a vector of parameters and εi t he
error t erm dist ribut ed as independent normal with zero mean and constant variance (σ2) .
The ex planat ory v ariables in t he regression m odel are a set of v ariables dealing wit h dem ographic charact erist ics, socio- econom ic charact erist ics, w at er source and source charact erist ics. The m et hod elicit s t he probabilit y and not t he act ual v alue of WTP1 w hich
is subsequent ly calculat ed t hrough descript iv e st at ist ics. Following Greene ( 1997) , t he WTP probabilit y is com put ed as:
P( Y= 1) = ezi ( 4) 1 + ezi
w here:
E ( Y/ X) = 0 [ 1- F (β1X)] + 1 [F (β1X) ] ( 5)
and F( . ) is t he cum ulat iv e densit y funct ion. I rrespect ive of t he dist ribut ion used, t he m arginal effect is obt ained as follow s:
δE( Y/ X) = d F (β1X) ( 6)
δX d (β1X)
The response for WTP is a binary v ariable t hat t akes t he v alue of 0 if t he response t o t he quest ion ‘y es’ and 1 if t he response is no. Let t he binary v ariable be WTP and t he underlying lat ent v ariable be WTP* . Then t he general form ulat ion of t he em pirical Tobit m odel is giv en as:
WTPi*= β1Xi + Ei ( 7)
w here xi is a vector of explanatory factors in the regression for the individual i, β is a
v ect or of fit t ed coefficient s and WTPi* is t he st at ed WTP for individual i since WTP* is
observ ed, it is t he underlying lat ent v ariable t hat is relat ed t o t he observ ed WTP as follow s:
WTPi = 1 if WTPi* > 0 ( 8)
and:
WTPi = 0 if WTPi* < 0 ( 9)
An econom et ric analy sis w as used t o t est t he relat ionship bet w een WTP and socio-econom ic fact ors. Quest ions w ere ask ed in an or dered, cat egorical form and t hen w ere t ransform ed int o binary v ariables. The respondent s w ere ask ed if t hey were WTP for a bet t er quant it y and im prov em ent in t he qualit y of w at er.
WTP can be funct ionally expressed as follow s:
WTP = f ( HMI , WATCON, WATSOU, AGE, HSZ, GEN, WAI TI M, EDU) or, in a linear regression form :
WTP = β0 + β1 HMI + β2 WATCON + β3 WATSOU + β4 AGE + β5 HSZ + β6 GEN + β7
WAITIM + β8 EDU+ εi,
w here: HMI is household’s m ont hly incom e ex pressed in Naira ( N) ; WATCON is w at er consum pt ion ex pressed in lit ers/ m ont h/ household; WATSOU is t he w at er source for t he
β = F (β
1household; AGE is t he age of household individual (in years) ; HSZ is household size ex pressed in num ber of individuals; GEN is gender a dum m y v ariable indicat ing t he sex of household’s individual; WAI TI M is w ait ing t im e t o collect w at er; EDU is household individual’s lev el of educat ion ex pressed in num ber of y ears spent in educat ion; and εi is
t he error t erm represent ing t he unpredict ed or unex plained v ariat ion in t he dependent v ariable and is assum ed t o be regularly dist ribut ed.
Re su lt s a n d D iscu ssion
Socio- e con om ic ch ar a ct er ist ics of t h e r espon de n t s. The sum m ary of t he
socio-econom ic v ariables is present ed in Table 1.
Table 1 Sum m ary st at ist ics of socio- econom ic v ariables ( Source: field surv ey, 2009)
Variable Mean St andard dev iat ion Minim um Max im um
Age ( y ears) 34. 37 10. 06 18 65
Educat ion ( y ears) 7. 92 3. 27 0 18
Household size ( num ber) 7. 9 4. 28 1 24
Mont hly incom e ( N) 6779. 28 5834. 73 1500 50000
The result indicat es t hat , t he m ean age of t he respondent s w as 34. 37 y ears w it h st andard deviat ion of 10. 06 y ears. The survey also rev eals t hat all respondent s w ere w it hin t he age defined by FAO ( 1983) as econom ically product iv e populat ion. The m ean y ear of educat ion w as 7. 92 y ears. This is in accordance w it h com m on fact t hat m aj orit y of rural farm ers are charact erized by high rat e of illit eracy ( Obibuak u 1983) . The av erage m ont hly incom e w as 6779. 28 N.
Sou r ce s of w a te r. Table 2 show s t hat about 35% of t he w at er consum ers use borehole
and 54. 3% use unsafe sources such as unpr ot ect ed w ell and st ream . This is in line w it h t he findings by Alaba ( 2001) w ho report ed t hat 31. 1% of t he rural w at er consum ers in Nigeria use borehole w hile ov er 50% uses unsaf e sources such as w at er holes, ponds, unprot ect ed w ell and st ream . About 31% collect ed w at er from m echanized sources of w hich only 20% are piped and t reat ed ( FOS 1999) .
Table 2 Dist ribut ion of respondent s by sources of w at er ( Source: field surv ey, 2009)
Source of w at er Frequency Percent age
Borehole 42 35. 0
Prot ect ed w ell 12 10. 0
Unprot ect ed w ell 50 41. 7
Hand pum p 2 1. 7
St ream 14 12. 6
Tot a l 1 2 0 1 0 0 .0
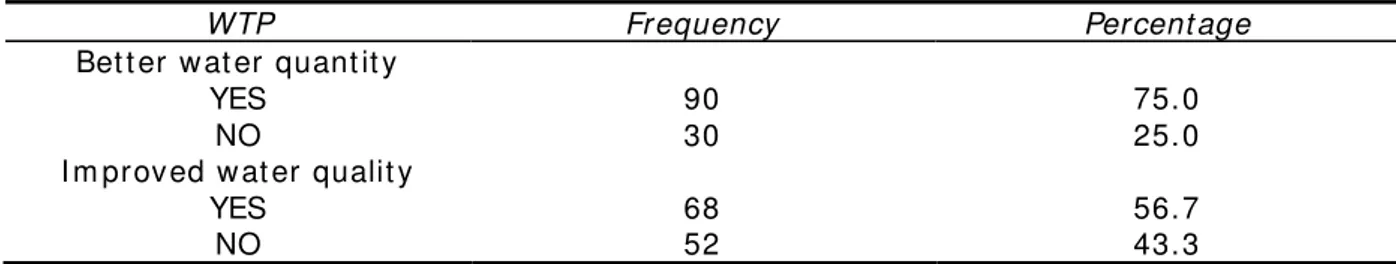
Ru r a l h ou se h old W illin gne ss To Pa y for im pr ove m e n t in qu a n t it y a n d qu alit y
W illin gne ss To Pa y ( W TP) for be t t er w a t e r qu a n t it y a n d im pr ove d w a te r qu a lit y.
t he st udy conduct ed by Farolfi et al ( 2007) in Sw aziland w here rural households are m ore WTP for im prov ed w at er qualit y t han for increased w at er quant it y .
Table 3 Dist ribut ion of respondent s WTP for im prov ed w at er quant it y ( n= 120)
( Source: field surv ey , 2009)
WTP Frequency Percent age
Bet t er w at er quant it y
YES 90 75. 0
NO 30 25. 0
I m prov ed w at er qualit y
YES 68 56. 7
NO 52 43. 3
Am ou n t w illin g t o pa y. For t he households t hat w ere WTP, t he st udy inquired about
t he am ount of m oney t hey declared t o be WTP for bet t er w at er quant it y and im prov ed qualit y. Table 4 provides t he am ount s households w ould be WTP in Naira/ household/ m ont h. I t is not ed t hat rural households are WTP a higher am ount of m oney for a bet t er w at er quant it y t han im prov ed w at er qualit y despit e t heir m uch low er incom e.
Table 4 WTP in Naira/ household/ m ont h for bet t er quant it y and im prov ed qualit y
( Source: field surv ey , 2009)
Am ount Willing t o Pay
Variable ↓ Bet t er w at er quant it y I m prov ed w at er qualit y
Mean 1320. 00 1058. 75
St andard dev iat ion 1169. 45 994. 85
Maxim um 6000 4800
Minim um 0 0
Fa ct or s a ffect in g w illin gne ss t o pa y for sa fe w a t e r. Regression analysis w as run in
order t o ex am ine t he fact ors affect ing willingness t o pay for safe w at er. Tw o regression analy ses w ere conduct ed adopt ing t he m odel illust rat ed in chapt er t hree, w here t he probabilit y t hat t he household w ould be willing t o pay ( WTP) for higher w at er quant it y w as t he dependent v ariable for t he first regression, and t he probabilit y t hat t he household w ould be WTP for an im prov ed w at er qualit y w as t he dependent v ariable for t he second regression. Probabilit y of WTP w as t hen relat ed t o a set of ex planat ory v ariables.
Tobit r e su lt s of W TP for be t t e r w a t e r qu an t it y. These result s are show n in Table 5.
The v ariable household incom e had a negat iv e and st at ist ically significant im pact on WTP for quant it y . Households wit h higher incom e are t herefore less willing t o pay for im prov ed w at er quant it y : t his is not in line wit h earlier findings by Farolfi et al ( 2007) w ho report ed a posit ive and significant im pact bet ween WTP for quant it y and household incom e.
Wat er consum pt ion w as also st at ist ically significant , but wit h a negat iv e sign w hen regressed on WTP for quant it y , t his result is quit e int uit iv e t oo. The negat iv e sign m eans t hat t he m ore a household consum es w at er, t he less t hat household is WTP t o hav e an im prov ed w at er av ailabilit y in t erm s of quant it y .
Age of t he respondent s had a st at ist ically significant and negat iv e effect on t he household WTP. Younger heads of households hav e higher WTP t han t heir older count erpart s: t his is also not in consonance w it h t he findings of Farolfi et al ( 2007) .
Gender had a posit iv e and significant im pact on t he WTP for quant it y . Male household heads hav e lower WTP t han fem ale household heads. This result could be ex plained by t he fact t hat y ounger w om en are usually inv olv ed in collect ing w at er; t hey are t he ones m ost lik ely t o perceiv e t he st rain of w alking long dist ances w hen collect ing w at er in t he st udy area.
Table 5 Tobit result s of WTP for bet t er w at er quant it y ( Source: field surv ey, 2009)
Wat er quant it y Coefficient St andard error t P> / t /
Const ant 0. 215 0. 096 2. 231
I ncom e - 0. 012 4. 743 - 2. 530* * 0. 011
Wat er consum pt ion - 0. 745 0. 223 - 3. 345* * 0. 001 Wat er source - 0. 246 0. 095 - 2. 602* * * 0. 010
Age - 36. 469 12. 654 - 2. 2882* * * 004
Household size 0. 060 0. 261 0. 230 0. 818
Gender 0. 153 0. 034 4. 465* * * 000
Wait ing t im e 2. 467 3. 107 0. 794 0. 427
Educat ion - 21. 101 38. 226 - 0. 552 0. 581
Observ at ion sum m ary : 90 left - censored observ at ions at WTP quant it y < 30 uncensored observ at ions.
* * and * * * m eans st at ist ically significance at 5% and 1% levels r espect ively; Num ber of obser vat ion = 12 0;
Pseudo R2
= 0. 207;
Log likelihood fu nct ion = - 66 3. 506.
Tobit r e su lt s of W TP for im pr ove d w a t e r qu a lit y. Table 6 indicat es t hat age of t he
respondent s had a st at ist ically significant and negat iv e effect on t he household’s WTP for im prov ed w at er qualit y . This im plies t hat older households hav e low er WTP for qualit y t han t heir y ounger count erpart s.
Table 6 Tobit result s of WTP for im prov ed w at er qualit y ( Source: field surv ey, 2009)
Wat er quant it y Coefficient St andard error t P> / t / Const ant 0. 127 0. 038 3. 355 0008
I ncom e 0. 175 1. 882 0. 093 0. 926 Wat er consum pt ion - 15. 048 21. 528 - 0. 699 0. 485 Wat er source - 2. 246 4. 206 - 0. 534 0. 5930
Age - 0. 102 0. 049 - 2. 0728* * 0. 038 Household size 0. 044 1. 023 0. 043 0. 966 Gender 0. 020 0. 024 0. 817 0. 414 Wait ing t im e 1. 625 0. 817 1. 989* * 0. 047 Educat ion 0. 048 0. 015 3. 232* * * 0. 001 Observ at ion sum m ary : 68 left - censored observ at ions at WTP qualit y < 52 uncensored observ at ions.
* * and * * * m eans st at ist ically significance at 5% and 1% levels r espect ively; Num ber of obser vat ion = 12 0;
Pseudo R 2
= 0. 19 1;
Log likelihood fu nct ion = - 88. 4 26.
Years of educat ion of t he respondent s had a posit ive and st at ist ical significant im pact on t he WTP for w at er qualit y . This im plies t hat educat ed household has higher WTP for qualit y t han illit erat e households. Higher educat ion lev els are also associat ed wit h higher lev els of w at er use, perhaps because consum ers are m ore aw are of hy gienic pract ices. One m ight also ex pect t hat bet t er educat ed people hav e higher incom es and can t herefore afford bet t er w at er services.
Con clusion. Provision of safe w at er is necessary in order t o have hy gienic and healt hy
rural dw ellers. I n line wit h t hese research findings, effort s should be int ensified on reliabilit y of m ost sources. Wat er been a necessit y should be m ade av ailable for all and sundry .
The st udy t herefore recom m ends t hat gov ernm ent should help t he public by prov iding t ap w at er, im proving w at er qualit y and quant it y , and educat ing t he general public on t he im port ance of safe w at er.
Re fe r en ce s
Alaba A. O., 2001 Econom ics of Wat er Healt h and Households Labour Mark et Part icipat ion, A Final Report Subm it t ed t o t he African Econom ic Research Consort ium ( AERC) , Nairobi, Keny a.
Banda B. , Farolfi S., Hassan R. , 2004 Det erm inant s of qualit y and quant it y v alues of w at er for dom est ic uses in t he St eelpoort Sub- basin: a cont ingent v aluat ion approach. Proceedings of t he conference: Wat er m anagem ent for local dev elopm ent , Losk op Dam , 8 - 11 Nov em ber 2004.
Bohm R. , Essenburg T., Fox W., 1998 Sust ainabilit y of pot able w at er services in t he Philippians. Wat er Resource Research 2 9( 7) : 1955- 1963.
Duane D. B. , Boland J. W. , 2001 Urban w at er dem and, m anagem ent and planning. Mcgraw-Hill 6 8( 3) : 135- 137.
FAO, 1983 Agricult ural developm ent in Africa ( 1965- 1980) , FAO Publicat ion, FAO, I t aly, Rom e.
Farolfi S. , Mabugu R. E. , Nt shingila S. N. , 2007 Dom est ic w at er use and v alues in Sw aziland: a cont ingent v aluat ion analy sis. Agrekon 4 6( 1) : 163- 164.
Federal Office of St at ist ics, 1999 Pov ert y Profile for Nigeria 1980- 1996 ( april). Greene W. H., 1997 Econom et ric Analy sis, 3rd Edit ion, Prent ice Hall, 1075 pp.
Kaliba A., Norm an D. , Chang Y., 2003 Willingness t o pay t o im prov e dom est ic w at er supply in rural areas of Cent ral Tanzania. I m plicat ion for policy. I nt ernat ional Journal of Sust ainable Dev elopm ent and World Ecology 1 0( 2) : 119- 132.
Mit chell R. C. , Carson R. T., 1989 Using surv ey s t o v alue public goods: t he cont ingent v aluat ion m et hod. Washingt on, D. C. : Resources for t he Fut ure.
Obibuak u L. O., 1983 Agricult ural ex t ension as a st rat egy for agricult ural t ransform at ion, Univ ersit y of Nigeria Press, Nsukk a, Nigeria.
Olow a O. W., Om onona B. T. , 2008 Wat er resources dev elopm ent ; opport unit ies for increased agricult ural product ion in Nigeria. Agricult ural Journal 3( 5) : 366- 374. Ronald C., Mary B. W. , Krist in R., 2007 Conserv at ion pricing of household w at er use in
rural com m unit ies. Proceedings of t he 2007 Geor gia Wat er Resources Conference held March 27- 29, 2007 at t he Univ ersit y of Georgia, pp. 1- 4.
Tobin J., 1958 Est im at ion of relat ionships for lim it ed dependent v ariables. Econom et rica
2 6( 1) : 24- 36.
Whit t ingt on D. , Lauria D. T., Wright A. M. , Choe K., Hughes J. A. , Sw arna V., 1993 Household dem ands for im prov ed sanit at ion serv ices in Kum asi, Ghana. Wat er
ResourcesResearch 2 9( 6) : 1539- 1560.
Unit ed Nat ions, 2002 Report of t he w orld sum m it on sust ainable developm ent , Johannesburg, Sout h Af rica, Docum ent A/ CONF, 199/ 20 ( New York : Unit ed Nat ions) .
UN/ WWAP ( Unit ed Nat ions World Wat er Assessm ent Program m e) , 2003 Wat er for people,
w w w . unesco. org/w a t e r/ ww ap/ w w dr/ ex. .. / ex _sum m ary _en. pdf. ( accessed on t he 24t h of May , 2010) .
World Bank, 2003 Wat er Resources St rat egy : get t ing serious about Meet ing t he Millennium Dev elopm ent Goals, A Com prehensiv e Developm ent Fram ew ork Progress Report , Washingt on D. C.
World Bank, 2005 World Dev elopm ent Report 2005, Washingt on D. C.
World Healt h Organizat ion, 2002 The World Healt h Report 2002: Reducing risk s, prom ot ing healt hy life, Genev a.
Received: 11 July 201 1. Accept ed: 04 Oct ober 2011. Published online: 14 Novem ber 2 011. Aut hor s:
Laudia Tit ilola Ogunniyi, Depar t m ent of Agr icult ur al Econom ics, Ladoke Akint ola Univer sit y of Technology, Ogbom oso, Oy o St at e, Niger ia, 210001, e- m ail: t it iogunniyi@yahoo. com ; lt ogunniyi@laut ech. edu. ng Wasiu Adekunle Sanusi, Depar t m ent of Agr icult ur al Econom ics, Ladoke Akint ola Univer sit y of Technology, Ogbom oso, Oy o St at e, Niger ia, 210001, e- m ail: sanusiwa@yah oo. com
Ayinde Alani Ezekiel, Depar t m ent of Agr icult ur al Econom ics, Ladoke Akint ola Univer sit y of Technology , Ogbom oso, Oy o St at e, Niger ia, 210001, e- m ail: ayinlani@yah oo. com
How t o cit e t his ar t icle:
Annex 1 QUESTI ONNAI RE
Det erm inant s of Rural Household willingness t o pay for Safe Wat er in Asa Local Gov ernm ent Area of Kw ara St at e, Nigeria.
Please t ick t he appropriat e answ er t o t he quest ions below and kindly supply answ er in t he spaces provided.
SECTI ON A: Socio- Econom ic Charact erist ics of t he Respondent s 1. Nam e of v illage?- - -
2. Gender of respondent ? Male Fem ale
3. Age of respondent ? - - - y ears
4. Marit al st at us of respondent ? Married Single Widow ( er)
Div orced Separat ed Ot hers ( specify ) - - -
5. Years of educat ion? - - - y ears
6. Household size?
( i) Num ber of wife ( v es) - - -
( ii) Num ber of child ( ren) - - -
( iii) Num ber of dependant - - -
7. Maj or occupat ion? - - -
8. Secondary occupat ion? - - -
9. Household incom e? N- - - ( m ont hly )
SECTI ON B: Household Dem and Pat t ern for Safe Wat er
10. Do y ou hav e access t o safe w at er? Yes No
11. I f y es, how readily av ailable is y our safe w at er? Alw ay s Not alw ay s
Ot hers ( specify ) - - - -- - -
12. What is y our opinion regarding y our safe w at er? Fav orable Not fav orable
13. What is t he source, unit of m easurem ent , quant it y dem anded, t im e
spent and cost of safe w at er?
Source of w at er
Unit of m easurem ent
( k egs)
Quant it y dem anded
Walking t im e ( hours)
Queuing t im e ( hours)
Cost
Borehole Wells Rain w at er
St ream s Hand Pum ps Riv ers Ponds
14. I s y our source of safe w at er in y our house? Yes No
15. I f no, do y ou t ransport y ourself t o y our source of safe w at er? Yes No
17. Do y ou purify y our w at er? Yes No
18. What is t he source of w at er, cost of t ransport ing w at er from source t o user, cost
of w at er t reat m ent and t he t y pe of w at er t reat m ent use?
Source of w at er
Cost of t ransport ing
w at er from source t o users
Cost of w at er t reat m ent
Ty pe of w at er t reat m ent use
Borehole Wells Rainw at er
St ream s Hand pum ps
Riv ers Ponds
19. Do y ou pay for y our safe w at er? Yes No
20. How m uch are y ou w illing t o pay for w at er?- - - -( k egs)
21. I f t he price of safe w at er increases, will y ou st ill buy ? Yes No
22. Are y ou w illing t o pay for bet t er w at er quant it y ? Yes No
23. Are y ou w illing t o pay for im provem ent in w at er qualit y ? Yes No
24. Do y ou engage in av oidance m easure against w at er- relat ed disease?
Yes No
25. What is t he exist ing source, cost , qualit y and reliabilit y against t hose of t he
im prov ed w at er supply ?
Ex ist ing source of w at er
Cost ( N) Qualit y ( Yes/ No) Reliabilit y ( Yes/ No)
I m prov ed w at er supply
Cost ( N) Qualit y ( Yes/ No) Reliabilit y ( Yes/ No)
26. How m any day s in a w eek do y ou fet ch w at er?- - -
27. What is t he am ount of w at er used w eekly in y our household? - - - Kegs
28. I n w hat w ay has Gov ernm ent being of help? Digging of boreholes