CPD
10, 4277–4363, 2014Twelve thousand years of dust
S. Albani et al.
Title Page
Abstract Introduction
Conclusions References
Tables Figures
◭ ◮
◭ ◮
Back Close
Full Screen / Esc
Printer-friendly Version Interactive Discussion
Discussion
P
a
per
|
Discussion
P
a
per
|
Discussion
P
a
per
|
Discussion
P
a
per
|
Clim. Past Discuss., 10, 4277–4363, 2014 www.clim-past-discuss.net/10/4277/2014/ doi:10.5194/cpd-10-4277-2014
© Author(s) 2014. CC Attribution 3.0 License.
This discussion paper is/has been under review for the journal Climate of the Past (CP). Please refer to the corresponding final paper in CP if available.
Twelve thousand years of dust: the
Holocene global dust cycle constrained
by natural archives
S. Albani1,2, N. M. Mahowald1, G. Winckler3,4, R. F. Anderson3,4,
L. I. Bradtmiller5, B. Delmonte2, R. François6, M. Goman7, N. G. Heavens8, P. P. Hesse9, S. A. Hovan10, K. E. Kohfeld11, H. Lu12, V. Maggi2, J. A. Mason13, P. A. Mayewski14, D. McGee15, X. Miao16, B. L. Otto-Bliesner17, A. T. Perry1,
A. Pourmand18, H. M. Roberts19, N. Rosenbloom17, T. Stevens20, and J. Sun21
1
Department of Earth and Atmospheric Science, Cornell University, Ithaca, NY, USA
2
Department of Environmental Sciences, University of Milano-Bicocca, Milano, Italy
3
Lamont-Doherty Earth Observatory, Columbia University, Palisades, NY, USA
4
Department of Earth and Environmental Sciences, Columbia University, New York, NY, USA
5
Department of Environmental Studies, Macalester College, Saint Paul, MN, USA
6
Department of Earth and Ocean Sciences, University of British Columbia, Vancouver, BC, Canada
7
Department of Geography and Global Studies, Sonoma State University, Rohnert Park, CA, USA
8
CPD
10, 4277–4363, 2014Twelve thousand years of dust
S. Albani et al.
Title Page
Abstract Introduction
Conclusions References
Tables Figures
◭ ◮
◭ ◮
Back Close
Full Screen / Esc
Printer-friendly Version Interactive Discussion
Discussion
P
a
per
|
Discussion
P
a
per
|
Discussion
P
a
per
|
Discussion
P
a
per
|
9
Department of Environment and Geography, Macquarie University, Sydney, Australia
10
Department of Geoscience, Indiana University of Pennsylvania, Indiana, PA, USA
11
School of Resource and Environmental Management, Simon Fraser University, Burnaby, BC, Canada
12
School of Geographic and Oceanographic Sciences, Nanjing University, Nanjing, China
13
Department of Geography, University of Wisconsin, Madison, WI, USA
14
Climate Change Institute, University of Maine, Orono, ME, USA
15
Department of Earth, Atmospheric and Planetary Sciences, Massachusetts Institute of Technology, Cambridge, MA, USA
16
Illinois State Geological Survey, Champaign, IL, USA
17
National Center for Atmospheric Research, Boulder, CO, USA
18
Department of Marine Geosciences, Rosenstiel School of Marine and Atmospheric Science, University of Miami, Miami, FL, USA
19
Institute of Geography and Earth Sciences, Aberystwyth University, Aberystwyth, Wales, UK
20
Department of Earth Sciences, Uppsala University, Uppsala, Sweden
21
Key laboratory of Cenozoic Geology and Environment, Institute of Geology and Geophysics, Chinese Academy of Science, Beijing, China
Received: 30 September 2014 – Accepted: 24 October 2014 – Published: 13 November 2014
Correspondence to: S. Albani ([email protected])
CPD
10, 4277–4363, 2014Twelve thousand years of dust
S. Albani et al.
Title Page
Abstract Introduction
Conclusions References
Tables Figures
◭ ◮
◭ ◮
Back Close
Full Screen / Esc
Printer-friendly Version Interactive Discussion
Discussion
P
a
per
|
Discussion
P
a
per
|
Discussion
P
a
per
|
Discussion
P
a
per
|
Abstract
Mineral dust plays an important role in the climate system by interacting with radia-tion, clouds, and biogeochemical cycles. In addiradia-tion, natural archives show that the dust cycle experienced variability in the past in response to global and local climate change. The compilation of the DIRTMAP paleodust datasets in the last two decades
5
provided a target for paleoclimate models that include the dust cycle, following a time slice approach. We propose an innovative framework to organize a paleodust dataset that moves on from the positive experience of DIRTMAP and takes into account new scientific challenges, by providing a concise and accessible dataset of temporally re-solved records of dust mass accumulation rates and particle grain-size distributions.
10
We consider data from ice cores, marine sediments, loess/paleosol sequences, lake sediments, and peat bogs for this compilation, with a temporal focus on the Holocene period. This global compilation allows investigation of the potential, uncertainties and confidence level of dust mass accumulation rates reconstructions, and highlights the importance of dust particle size information for accurate and quantitative
reconstruc-15
tions of the dust cycle. After applying criteria that help to establish that the data consid-ered represent changes in dust deposition, 43 paleodust records have been identified, with the highest density of dust deposition data occurring in the North Atlantic region. Although the temporal evolution of dust in the North Atlantic appears consistent across several cores and suggest that minimum dust fluxes are likely observed during the
20
Early to mid-Holocene period (6000–8000 years ago), the magnitude of dust fluxes in these observations is not fully consistent, suggesting that more work needs to be done to synthesize datasets for the Holocene. Based on the data compilation, we used the Community Earth System Model to estimate the mass balance and variability of the global dust cycle during the Holocene, with dust load ranging from 17.1 to 20.5 Tg
25
CPD
10, 4277–4363, 2014Twelve thousand years of dust
S. Albani et al.
Title Page
Abstract Introduction
Conclusions References
Tables Figures
◭ ◮
◭ ◮
Back Close
Full Screen / Esc
Printer-friendly Version Interactive Discussion
Discussion
P
a
per
|
Discussion
P
a
per
|
Discussion
P
a
per
|
Discussion
P
a
per
|
1 Introduction
Paleoclimate records from natural archives have laid foundations for understanding the variability of the Earth’s climate system over different time scales. Paleoclimate proxies shed light on past environmental conditions such as the composition of the atmosphere, global ice volume, sea level, and surface temperatures (Bradley, 1999).
5
Paleodust reconstructions paired with other proxies showed the response of the climate system to orbitally induced forcing, including feedback mechanisms. Dust feedbacks on the climate system include scattering and absorption of solar radiation and indirect effects on clouds and the global carbon cycle (e.g. Boucher et al., 2013; Martin, 1990). The story told by paleodust archives suggests that increased aridity (An et al., 1991;
10
Liu, 1985; Liu et al., 1998) and wind gustiness (McGee et al., 2010; Muhs et al., 2013) enhanced the dust cycle during cold periods over glacial-interglacial time scales, with additional mechanisms introducing characteristic geographic patterns and/or imprint-ing the archives with characteristic signals in different geographical settings. These mechanisms include increased sediment availability by glacial erosion (Delmonte et al.,
15
2010a; Petit et al., 1999), reorganization of the atmospheric circulation between mid and high latitudes (Fuhrer et al., 1999; Lambert et al., 2008; Mayewski et al., 1997, 2014), shifts in the Inter-Tropical Convergence Zone (ITCZ) (McGee et al., 2007; Rea, 1994), changes in the monsoonal variability (Clemens and Prell, 1990; Hovan et al., 1991; Tiedemann et al., 1994), and regional drying (Lu et al., 2010).
20
The growing number of paleodust archives and the inclusion of the dust cycle in cli-mate models has promoted synthesis efforts in the compilation of global dust datasets (Mahowald et al., 1999). The Dust Indicators and Records from Terrestrial and MArine Palaeoenvironments (DIRTMAP) Project (Kohfeld and Harrison, 2001) formalized the compilation of Dust Mass Accumulation Rates (dust MAR, or DMAR) from marine and
25
CPD
10, 4277–4363, 2014Twelve thousand years of dust
S. Albani et al.
Title Page
Abstract Introduction
Conclusions References
Tables Figures
◭ ◮
◭ ◮
Back Close
Full Screen / Esc
Printer-friendly Version Interactive Discussion
Discussion
P
a
per
|
Discussion
P
a
per
|
Discussion
P
a
per
|
Discussion
P
a
per
|
traps. DMAR is the fundamental measurement necessary to cross-correlate variability among dust archives and sites. Without it, only the relative timing and amplitude of individual records can be studied. In combination with global climate models, DMAR datasets enable quantitative reconstructions of the global dust cycle. The DIRTMAP compilation showed a globally averaged glacial/interglacial ratio of∼2.5 in dust
de-5
position. Subsequent work expanded upon the initial compilation (DIRTMAP2: Tegen et al., 2002), and the most recent version of the database (DIRTMAP3: Maher et al., 2010) also contains an extensive repository of additional metadata from the original publications. The DIRTMAP datasets have proven to be an invaluable tool for paleocli-mate research and model-data inter-comparison.
10
The full definition of the global dust cycle in terms of DMAR is unavoidably linked to the dust grain size distributions that characterize the mass balance and its spatial evolution. The more advanced dust models define a model particle size range and dis-tribution, which would require (although this has been often neglected) explicitly con-sidering the size range of dust found in the dust deposition data in model-observation
15
inter-comparisons. This aspect was initially taken into account for terrestrial sediments in Mahowald et al. (2006) to match the specific model size range (0.1–10 µm), and re-cently extended by Albani et al. (2014). Still the necessity of more extensive grain size information from dust data has been emphasized by Maher et al. (2010), as well as by other review papers on dust (e.g. Formenti et al., 2011; Mahowald et al., 2014).
Coher-20
ent information on grain size is missing in DIRTMAP3 (Maher et al., 2010), because of the difficulty of making a synthesis from measurements produced by a variety of particle-size measurement techniques often yielding quite different results (Mahowald et al., 2014; Reid, 2003).
A time slice approach is often used by the paleoclimate modelling community to
25
CPD
10, 4277–4363, 2014Twelve thousand years of dust
S. Albani et al.
Title Page
Abstract Introduction
Conclusions References
Tables Figures
◭ ◮
◭ ◮
Back Close
Full Screen / Esc
Printer-friendly Version Interactive Discussion
Discussion
P
a
per
|
Discussion
P
a
per
|
Discussion
P
a
per
|
Discussion
P
a
per
|
opening up doors to performing transient simulations on paleoclimate time scales, both to intermediate complexity (Bauer and Ganopolski, 2014) and more complex Earth System Models (ESMs) (Liu et al., 2009). PMIP3 called for additional key transient experiments to study abrupt climate change, with the implication that at the same time target observational datasets with the necessary temporal continuity and resolution are
5
needed (Otto-Bliesner et al., 2009).
We propose an innovative framework to organize a paleodust dataset that moves on from the positive experience of DIRTMAP and takes into account new scientific chal-lenges outlined above, by providing a synthesized and accessible dataset of temporally resolved records of dust MARs and size distributions. We aim to provide a database
10
that is a concise and accessible compilation of time series, including age (with uncer-tainty), dust MAR (with unceruncer-tainty), and dust particle size distribution (where avail-able), standardized by the use of a common binning scheme, and complemented by a categorical attribution of confidence based on general consensus. Besides the ba-sic information mentioned above, we also report the ancillary information necessary
15
to re-derive the dust MARs time series, i.e. the detailed depths and the relevant dust variables.
We focus on dust variability during the Holocene, with emphasis on the MH as a key PMIP scenario and also in relation to the large variability that affected the present largest dust source in the world, North Africa, with the termination of the African Humid
20
Period (AHP) (deMenocal et al., 2000; McGee et al., 2013). For this reason we only selected paleodust records encompassing the MH with some degree of temporal res-olution (see Sect. 3), although we show in the paper the time series from the LGM to provide reference to other key climate conditions and to place in a fuller context with respect to the DIRTMAP compilation. The developed framework is suitable for a more
25
extensive compilation.
CPD
10, 4277–4363, 2014Twelve thousand years of dust
S. Albani et al.
Title Page
Abstract Introduction
Conclusions References
Tables Figures
◭ ◮
◭ ◮
Back Close
Full Screen / Esc
Printer-friendly Version Interactive Discussion
Discussion
P
a
per
|
Discussion
P
a
per
|
Discussion
P
a
per
|
Discussion
P
a
per
|
simplification is inherent in a synthesis. For the sake of accessibility we refrain from reporting extensive information that cannot be coherently organized. We therefore pro-vide a brief summary, and refer to the relevant literature for detailed description of specific records (Supplement). In addition, because our purpose is to provide a quanti-tative constraint on the dust cycle, we only considered sedimentary records that allow
5
the derivation of meaningful dust MARs with the information we could access. Many more studies focused on dust and provide important, good quality information, but did not allow a time-resolved estimate of dust MAR. We refer to these studies when appro-priate, as they provide further context to ensure our interpretations.
Finally, we use the Community Earth System Model (CESM) in combination with the
10
DMAR and size data (Albani et al., 2014; Mahowald et al., 2006) from the compilation to estimate the mass balance of the global dust cycle and its variability during the Holocene.
Section 2 gives an overview of the kind of natural archives initially considered for this compilation, while in Sect. 3 we explain our methodological approach to select and
15
organize the records. In Sect. 4 we present the database and model-based reconstruc-tions, and discuss its emerging properties in relation to the climate features in different spatial domains. We summarize our work in Sect. 5.
2 Paleodust archives
Natural archives that preserve dust sediments have different characteristics in terms
20
of: geographical settings and spatial distributions around the globe; the accuracy of the age models and temporal resolution; the ability to isolate eolian dust from other depositional contributions. Each type of paleodust archive has its own strengths and limitations, and it is only by considering high quality records of all types (from land, ice, and ocean archives) that we can hope to build a consistent reconstruction of the global
25
CPD
10, 4277–4363, 2014Twelve thousand years of dust
S. Albani et al.
Title Page
Abstract Introduction
Conclusions References
Tables Figures
◭ ◮
◭ ◮
Back Close
Full Screen / Esc
Printer-friendly Version Interactive Discussion
Discussion
P
a
per
|
Discussion
P
a
per
|
Discussion
P
a
per
|
Discussion
P
a
per
|
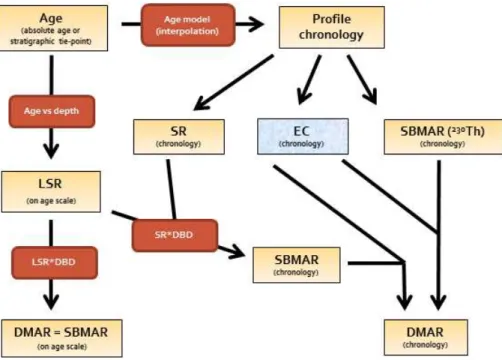
Natural archives preserve eolian dust within a sedimentary matrix. The essential elements for a paleodust record are the possibility of establishing a reliable chronology, the estimation of the sedimentation rates, and the isolation of the eolian component (Fig. 1).
One of the key elements in the production of a paleodust record is the possibility of
5
establishing a depth-age relation. Typically the starting point for this procedure is the attribution of age to a series of specific depth layers along the profile, based on numer-ical dating or stratigraphic correlations. Numernumer-ical dating can be based on counting of annual layers, radionuclide decays (e.g. 14C), or exposure to radiation (e.g. Thermo-Luminescence (TL)/Optically Stimulated Thermo-Luminescence (OSL)) (Brauer et al., 2014).
10
Stratigraphic correlations either exploit stratigraphic markers such as known volcanic eruptions and spikes in tracers of the atmospheric thermonuclear test explosions, or are attributed by wiggle-matching an age-carrier profile from the study site (e.g.δ18O of foraminifera in marine sediment cores, methane concentration in ice cores) with a ref-erence record of global signatures such as global ice volume (e.g. Martinson et al.,
15
1987), or the variations in atmospheric methane concentrations (e.g. Loulergue et al., 2008).
Sediment chronologies can be established based on the initial age-depth relations identified along a profile. With “chronology” we identify a continuous function that pro-vides a unique attribution of the depth-age relation along the entire profile, based on
20
some kind of age model. Age models can vary from simple linear sedimentation mod-els, to complex Bayesian models (Brauer et al., 2014).
A general expression for dust (or eolian – the two terms will be used equivalently throughout the text) MARs is the following: DMAR=SBMAR
·EC, where SBMAR is the Sediment Bulk Mass Accumulation Rate and EC is Eolian Contribution.
25
CPD
10, 4277–4363, 2014Twelve thousand years of dust
S. Albani et al.
Title Page
Abstract Introduction
Conclusions References
Tables Figures
◭ ◮
◭ ◮
Back Close
Full Screen / Esc
Printer-friendly Version Interactive Discussion
Discussion
P
a
per
|
Discussion
P
a
per
|
Discussion
P
a
per
|
Discussion
P
a
per
|
appliedfformed by the accumulation of, resulting in diverse SR profiles. The other ap-proach is specific for the marine sediments realm, and it is largely (other than for decay-correction) independent from the underlying age model: it is based on the assumption that the rapid scavenging of230Th produced in the water column by decay of dissolved uranium results in its flux to the seafloor being equal/close to its known rate of
pro-5
duction. Measurements of 230Th in marine sediments therefore allow us to estimate instantaneous SBMARs that are independent from LSRs (François et al., 2004).
Because eolian DMAR is the product of at least two factors (SBMAR and EC), the sampling (depth) resolution at which the two of them are available will determine the DMAR resolution, and in some cores the resolutions may coincide. Sometimes a
con-10
stant LSR is assumed between dated depth layers whereas stratigraphic samples are analysed at higher resolution and an estimated age is assigned based on the age model (Fig. 2). At the time scale of interest, it should be noted that deviations from the ideal pairing of EC and SBMAR measurements along a profile might be considered acceptable if the resolutions are not too different. On the other hand, if one variable
15
(typically EC) has a much higher resolution than the other, then its high resolution is not informative with respect to their product (DMAR), and misinterpretations could arise. In those cases the lower resolution variable should be used to provide the pace of the record’s resolution.
An additional aspect to consider when dealing with dust MARs is the relationship
20
between the dust Deposition Flux (DF) and the dust MAR i.e. to what extent the mea-sured DMAR is representative (in a quantitative way) of the dust deposition, which is of primary interest: ideally DMAR=DF. Deviations from this ideal relation occur, for instance, when sediment redistribution disturbs the ocean sediments (François et al., 2004), or when erosion leaves hiatuses in loess/paleosol sequences (Stevens et al.,
25
2007).
CPD
10, 4277–4363, 2014Twelve thousand years of dust
S. Albani et al.
Title Page
Abstract Introduction
Conclusions References
Tables Figures
◭ ◮
◭ ◮
Back Close
Full Screen / Esc
Printer-friendly Version Interactive Discussion
Discussion
P
a
per
|
Discussion
P
a
per
|
Discussion
P
a
per
|
Discussion
P
a
per
|
addition, size data is a necessary piece of information to determine the provenance of dust. In remote accumulation sites, size distribution allows (together with geochemical and mineralogical data) the identification of local vs. remote inputs (Albani et al., 2012a; Delmonte et al., 2010b). In terrestrial sites proximal to the source areas it is necessary to evaluate the amount of dust actually available for long-range transport (Mahowald
5
et al., 2006; Muhs et al., 2013; Roberts et al., 2003).
We next analyse the main characteristics of the different kinds of paleodust records considered for this compilation: ice cores, marine sediments, loess/paleosol se-quences, lake sediments and peat bogs.
2.1 Ice cores
10
Ice cores constitute a natural sampler of past atmospheric composition, including greenhouse gases and aerosols. Isolation of the eolian component from the ice matrix is rather straightforward – it is usually obtained by melting the ice at room temperature (Delmonte et al., 2004), although sublimation of the ice is another option (Iizuka et al., 2013) – so that the ice allows the most pristine preservation of the locally deposited
15
atmospheric aerosol.
The presence of perennial ice limits the geographical coverage of ice core records worldwide, and the recovery of long dust stratigraphies is limited to the high latitudes and a few alpine glaciers in the low and mid latitudes. Often the EC is a direct mea-sure of the insoluble dust concentration and size distribution in the ice samples, using
20
either a Coulter Counter (Delmonte et al., 2004) or a laser diffraction particle counter (Lambert et al., 2008). Alternatively a geochemical dust proxy can be used (e.g. Mc-Connell et al., 2007), and the most common approach considers non-sea salt calcium (Fischer et al., 2007). Despite the fact that the dust-calcium relation should be taken with caution under certain circumstances (Ruth et al., 2002, 2008), this approach has
25
CPD
10, 4277–4363, 2014Twelve thousand years of dust
S. Albani et al.
Title Page
Abstract Introduction
Conclusions References
Tables Figures
◭ ◮
◭ ◮
Back Close
Full Screen / Esc
Printer-friendly Version Interactive Discussion
Discussion
P
a
per
|
Discussion
P
a
per
|
Discussion
P
a
per
|
Discussion
P
a
per
|
Since in most cases both dust (insoluble) and calcium records were produced at the same location, we focus on insoluble particle records, which also include dust size distributions. Possible non-dust contributions include volcanic tephra, which are usually identifiable and excluded from the records (e.g. Narcisi et al., 2012). For Greenland there is only one record spanning the Holocene, GISP2, for which we consider calcium
5
as a proxy for dust (Mayewski et al., 1997).
For the estimation of SBMAR, post-depositional changes may potentially affect snow/ice accumulation rates through surface redistribution or sublimation. In the po-lar ice sheets plateaus these effects are probably negligible on domes where ice cores are usually drilled (Frezzotti et al., 2007), so that dust DMAR=DF.
10
Polar ice cores’ age models are in continuous evolution and they benefit from the growing number of deep ice cores. The striking feature is the absolute counting of an-nual layers in Greenland ice cores (Vinther et al., 2006), which in combination with several ice and stratigraphic markers (e.g. methane spikes, volcanic signals) allows establishing consistent chronologies for both Greenland and Antarctic ice cores. In this
15
work we use the most recent AICC2012 chronology for Antarctic ice cores (Veres et al., 2013). Because of the high sediment accumulation rates compared to other natural archives, polar ice cores usually provide the highest resolution dust records. Dust con-centration records are also available from alpine glaciers (e.g. Thompson et al., 1995, 1997). While it is possible to derive estimates of dust MARs on the glacial/interglacial
20
time scale (Kohfeld and Harrison, 2001), it is problematic to calculate DMAR time se-ries. This is because there are no reliable age models due to the difficulty in establishing adequate accumulation stratigraphies in such environments.
With a few exceptions from sites on the edges of the ice sheets both in Greenland (Renland: Hansson, 1994) and Antarctica (e.g. TALDICE: Albani et al., 2012a;
Del-25
CPD
10, 4277–4363, 2014Twelve thousand years of dust
S. Albani et al.
Title Page
Abstract Introduction
Conclusions References
Tables Figures
◭ ◮
◭ ◮
Back Close
Full Screen / Esc
Printer-friendly Version Interactive Discussion
Discussion
P
a
per
|
Discussion
P
a
per
|
Discussion
P
a
per
|
Discussion
P
a
per
|
2.2 Marine sediments
With the oceans covering two thirds of the Earth’s surface marine sediment cores rep-resent key paleoclimate archives, recording among other things global land ice vol-umes, ocean productivity linked to the carbon cycle and the main characteristics of the ocean deep circulation. Dust particles deposited to the ocean’s surface attach to other
5
suspended particles and get scavenged throughout the water column, determining the accumulation of eolian material in pelagic sediments. Despite the complexity and un-certainties in the dynamics of particle sedimentation throughout the water column (e.g. Bory and Newton, 2000; De La Rocha et al., 2008) and well as their potential advection downstream (Siegel and Deuser, 1997; Han et al., 2008), we can reasonably make
10
the approximation that dust DF(surface)=DF(benthic). This is valid in most regions (Siegel and Armstrong, 2002; Kohfeld and Tegen, 2007), with the notable exception of the Southern Ocean.
The pelagic environment is characterized by low deposition rates, so that most ma-rine records naturally have a lower temporal resolution than ice cores. Chronologies for
15
marine sediment cores are often derived by stratigraphic correlation of δ18O records of benthic or pelagic foraminifera (representative of a combination of global ice vol-ume and temperature) with reference stacks such as SPECMAP (Imbrie et al., 1984; Martinson et al., 1987) or LR04 (Lisiecki and Raymo, 2005).
In many studies, which is especially relevant for the Holocene, additional constraints
20
for the age models are given by radiocarbon-dating foraminifera (e.g. Anderson et al., 2006; McGee et al., 2013) or tephras (Nagashima et al., 2007). The age-depth rela-tion is usually assigned by linear interpolarela-tion between dated layers. Chronologies only based on stratigraphic correlation ofδ18O records are inherently affected by a signifi-cant degree of uncertainty for the Holocene, because the youngest tie-points inδ18O
25
CPD
10, 4277–4363, 2014Twelve thousand years of dust
S. Albani et al.
Title Page
Abstract Introduction
Conclusions References
Tables Figures
◭ ◮
◭ ◮
Back Close
Full Screen / Esc
Printer-friendly Version Interactive Discussion
Discussion
P
a
per
|
Discussion
P
a
per
|
Discussion
P
a
per
|
Discussion
P
a
per
|
is 0 ka BP, although the surface sediments may be disturbed or partially lost during the core recovery.
Two main strategies are used to derive dust records from marine cores. In the first, more traditional “operational” approach SBMAR=LSR·DBD, with LSR calculated from the age model and DBD measured or estimated. EC is determined by isolating the
5
lithogenic fraction from the sediment matrix by subsequent removal of the organic component, carbonates, and biogenic opal by thermal/chemical treatments (Rea and Janecek, 1981). In this approach the basic assumption is that the entire lithogenic fraction is eolian in origin. Corrections for volcanic contributions were attempted by visual inspection (Hovan et al., 1991) or by the use of geochemical tracers (Olivarez
10
et al., 1991), which could also help to distinguish fluvial vs. eolian inputs (Box et al., 2011). Other spurious lithogenic inputs may include material from turbidite currents, hemipelagic sediments, or ice-rafted debris (e.g. Rea and Hovan, 1995). Additionally, sediment redistribution may alter the depositional stratigraphy biasing the true sed-imentation rates (François et al., 2004), which is usually not accounted for in studies
15
following this kind of approach. Here we exclude sites known (or very likely) to be signif-icantly affected by sediment redistribution (e.g. nepheloid layers: Kohfeld and Harrison, 2001), ice-rafted debris (Kohfeld and Harrison, 2001), and those close to the continen-tal margins (e.g. Serno et al., 2014).
The other strategy consists in deriving SBMAR from230Th profiling (François et al.,
20
2004). Briefly, 230Th (half-life=75 690 years) is produced uniformly throughout the ocean by radioactive decay of dissolved234U. Due to its high particle reactivity,230Th is efficiently scavenged by particulate matter and has a short residence time in the ocean (<30 years) (Bacon and Anderson, 1982). The rain rate of scavenged 230Th to the sediments is therefore equal to its known rate of production in the overlying water
col-25
CPD
10, 4277–4363, 2014Twelve thousand years of dust
S. Albani et al.
Title Page
Abstract Introduction
Conclusions References
Tables Figures
◭ ◮
◭ ◮
Back Close
Full Screen / Esc
Printer-friendly Version Interactive Discussion
Discussion
P
a
per
|
Discussion
P
a
per
|
Discussion
P
a
per
|
Discussion
P
a
per
|
At sites potentially influenced by sediment redistribution, the230Th profiling method is probably the more reliable approach for the determination of SBMAR, as it accounts for sediment focusing (Anderson et al., 2008; François et al., 2004). If it can be as-sumed that the lithogenic fraction is of eolian origin, EC can be derived from the232Th concentration in the sediment of a dust proxy (232Th). As232Th concentrations in dust
5
are generally more than an order of magnitude higher than in most volcanic materials,
232
Th levels closely track continental inputs and are insensitive to volcanic inputs. In addition,232Th offers the advantage compared to other dust proxies, that its concen-tration in global dust sources is relatively invariable and close to the upper continental crust concentration (McGee et al., 2007). If non-eolian contributions (such as volcanic)
10
are present, multi-proxy approaches (using REE,4He) can provide a means to isolate the eolian fraction (Serno et al., 2014). On continental margin settings high sedimen-tation rates are related to the presence of fluvial inputs, which can be isolated from the eolian component by use of grain size end-member modelling (McGee et al., 2013).
Bioturbation i.e. surface sediment mixing by the benthic fauna is a common
uncon-15
strained feature of marine sediments, that acts as a smoothing filter on the sedimentary stratigraphy, including ages and other profiles interest, with a typical vertical smoothing scale of 8–10 cm. A few studies evaluated the potential effects of bioturbation of their records, although they do not correct their profiles (François et al., 1990; McGee et al., 2013), based on a simple de-convolution linear model (Bard et al., 1987).
20
2.3 Loess/paleosol sequences
The possibility of reconstructing the global dust cycle requires observations distributed geographically to constrain different regions, but also encompassing the evolution of dust spread from the source areas to the areas downwind and to remote regions. Ter-restrial sediment records are therefore necessary to constrain the location and
magni-25
CPD
10, 4277–4363, 2014Twelve thousand years of dust
S. Albani et al.
Title Page
Abstract Introduction
Conclusions References
Tables Figures
◭ ◮
◭ ◮
Back Close
Full Screen / Esc
Printer-friendly Version Interactive Discussion
Discussion
P
a
per
|
Discussion
P
a
per
|
Discussion
P
a
per
|
Discussion
P
a
per
|
dust (Pye, 1995; Liu, 1985), covering vast regions (∼10 %) of the land masses (e.g. Derbyshire et al., 1995; Rousseau et al., 2011). The formation of loess deposits is of-ten associated with the proximity of major dust sources, the availability of fine-grained erodible sediments and adequate winds, and a suitable accumulation site (Pye, 1995; Liu, 1985). This requires that a complex deposition-erosion balance determines the
5
actual rate of accumulation at a site and the alternation of accumulation/weathering phases depending on the dominant environmental conditions (Kemp, 2001; Muhs et al., 2003a). Loess/paleosol records (or soil profiles) spanning the Late Quaternary have shown to be important proxies and dust archives, both on glacial-interglacial (e.g. Ko-hfeld and Harrison, 2003; Muhs et al., 2008; Lu and Sun, 2000; Liu et al., 1999) and
10
millennial time scales (e.g. Mason et al., 2003).
Because of their nature, loess records are more challenging to interpret than ma-rine or ice dust stratigraphies in quantitative terms, but they hold great potential under opportune circumstances. In the case of loess/paleosol sequences, the assumption is often made that EC=1, because the other soil component i.e. the organic matter
con-15
tent is usually very low i.e.<1 % (e.g. Miao et al., 2007). Nonetheless in carbon rich soils where the organic matter can be∼10 %, this should be taken into account (Muhs et al., 2013). Therefore, the implication is that the dust MAR is entirely determined by SBMAR=LSR·DBD. Depending on the study DBD is either measured or assumed based on literature surveys, which adds significant uncertainty to calculations. The LSR
20
is determined based on the age-depth relation. For this compilation, focused on the Holocene, we only consider profiles were absolute ages (or more correctly, numerical ages) have been measured, rather than relying on stratigraphic correlations.
Depending on the availability of suitable material at loess sites, radiocarbon dating is carried out on different organic components such as plant material (e.g. charcoal, plant
25
CPD
10, 4277–4363, 2014Twelve thousand years of dust
S. Albani et al.
Title Page
Abstract Introduction
Conclusions References
Tables Figures
◭ ◮
◭ ◮
Back Close
Full Screen / Esc
Printer-friendly Version Interactive Discussion
Discussion
P
a
per
|
Discussion
P
a
per
|
Discussion
P
a
per
|
Discussion
P
a
per
|
techniques (Roberts, 2008). In particular OSL dating of quartz grains with the Single Aliquot Regenerative (SAR) dose protocol (Wintle and Murray, 2006) is considered to be quite robust (Roberts, 2008).
Bioturbation by faunal burrowing is an active process complicating the interpretations of soil profiles, as indicated by stratigraphic age inversions. In addition human activities
5
such as agriculture may cause significant perturbations to the upper sections of soil profiles (Roberts et al., 2001). Additional problems in the interpretation of soil profiles may arise in cases where the origin of the loess is not primarily eolian, but rather the product or reworking of local deposits (Kemp, 2001). We therefore, did not consider sections from areas where such occurrence was identified.
10
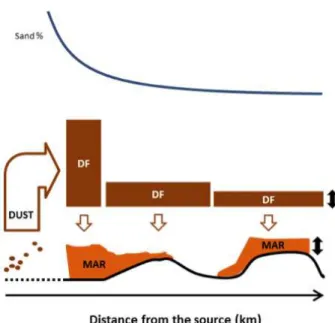
Even when reworked origin can be excluded, it should not be taken for granted that the DMAR=DF relation necessarily holds in the case of loess deposits. Conceptually, we can imagine the process of dust emission and deposition in a regional setting as follows: dust emanates from a source and starts to be deposited downwind at rates decreasing with distance from the source (Fig. 3). A clear example of this is evident
15
in the maps showing the spatial variability of the thickness of last glacial Peoria loess deposits in North America (Bettis et al., 2003), or the loess deposition in the Chinese Loess Plateau (CLP) (Liu, 1985; Lu and Sun, 2000). Understanding the spatial scale of this process is essential.
Grain size data from sampling transects at various locations suggest that a sharp
20
decrease in DMAR immediately downwind of source areas is associated with a de-crease in the size distribution within 20–50 km, before a slower decline in DMAR and size takes place (Chewings et al., 2014; Mason et al., 2003; Muhs et al., 2004; Winton et al., 2014), and then slowly keeps on the same trajectory on broader spatial scales (Ding et al., 2005; Lawrence and Neff, 2009; Porter, 2001; Prins et al., 2007; Sun et al.,
25
CPD
10, 4277–4363, 2014Twelve thousand years of dust
S. Albani et al.
Title Page
Abstract Introduction
Conclusions References
Tables Figures
◭ ◮
◭ ◮
Back Close
Full Screen / Esc
Printer-friendly Version Interactive Discussion
Discussion
P
a
per
|
Discussion
P
a
per
|
Discussion
P
a
per
|
Discussion
P
a
per
|
climate models and reconstructions of the mass balance of global dust cycle in gen-eral, because a misinterpretation of the significance of bulk DMARs can drive large overestimation of DF (Albani et al., 2014).
On the other hand it happens that sites located in close proximity to the sources have the highest accumulation rates, allowing for better chances of obtaining high resolution
5
profiles that are of great utility in paleoclimate reconstructions. Thus, often some of the better-resolved sites, especially those having an adequate time resolution to show variability during the Holocene, tend to be close to the sources.
After the steep decline in bulk DMAR close to the source areas, we can imagine the DF blanketing over the surface of the Earth, slowly decreasing as the distance from
10
the source increases, but approximately homogeneous over a broad area at a coarse enough spatial resolution (Fig. 3). In reality the DMAR is highly dependent on the lo-cal landforms, both for accumulation and preservation of the deposited dust (Stevens and Lu, 2009). Thus loess deposited on escarpments facing the wind direction may be favourable for an enhanced dust deposition (Bowen and Lindley, 1977; Mason et al.,
15
2003). More often erosion is a major player, so that DMAR<DF. Upland sites are gen-erally considered more suitable geomorphological settings to recover well-preserved profiles of DF (Derbyshire, 2003; Kohfeld and Harrison, 2003; Mason et al., 2003; Muhs et al., 2003a). Field examination of the broad area where a profile was studied may pro-vide epro-vidence of erosion (Lu et al., 2006), i.e. if the horizon’s stratigraphy is not widely
20
reproduced regionally, but in some cases evidence for erosion is only available via de-tailed independent age models (Buylaert et al., 2008; Stevens et al., 2008). In addition, supporting data from other proxies in the profile, i.e. bio- or chemo-stratigraphy, can provide grounds to establish the degree of coherence of specific sections (Marković et al., 2011).
25
2.4 Other paleodust archives: lake sediments and peat bogs
CPD
10, 4277–4363, 2014Twelve thousand years of dust
S. Albani et al.
Title Page
Abstract Introduction
Conclusions References
Tables Figures
◭ ◮
◭ ◮
Back Close
Full Screen / Esc
Printer-friendly Version Interactive Discussion
Discussion
P
a
per
|
Discussion
P
a
per
|
Discussion
P
a
per
|
Discussion
P
a
per
|
opportune medium range distance between the source areas and the more remote oceanic and polar sites. In addition, the preservation of large amounts of organic mat-ter involve the possibility of high-resolution radiocarbon dating, which is of great value especially for a period such as the Holocene (Muhs et al., 2003b; Marx et al., 2009; Le Roux et al., 2012).
5
While diverse in nature, lakes and peat bogs also share some common issues that generally need to be addressed in order to provide reliable paleodust profiles: the pos-sibility of quantitatively isolating remote from local dust deposition, and the basin-scale representativeness of eolian DMARs compared to DF.
In some circumstances (when fluvial inputs and rain outwash can be excluded)
10
lake deposits can preserve reliable dust stratigraphies, with little or no unconformi-ties and relatively abundant organic matter for radiocarbon dating (e.g. Muhs et al., 2003b). Maar lakes developed in craters formed by explosive excavations associated with phreatomagmatic eruptions, are often an ideal setting, when the mafic composition of the basin is substantially different than the mineralogical and geochemical
charac-15
teristics of the remotely originated dust. However, a major problem with lakes is the possibility of sediment focusing in the deeper parts of the basin, which may substan-tially affect SBMAR. With one exception, we were not able to retrieve adequate DMARs from lakes for this compilation, mostly because of problems with the age model, or a re-liable estimation of EC (Supplement).
20
In recent years substantial progress was made in recovering dust profiles from om-brotrophic peats. Estimation of SBMAR depends on the radiocarbon dating of the or-ganic matter. The EC is determined by the elemental composition of the residual ash after combustion of the organic matter. The identification of an adequate proxy for dust can be challenging (Kylander et al., 2013), so that several approaches including
25
CPD
10, 4277–4363, 2014Twelve thousand years of dust
S. Albani et al.
Title Page
Abstract Introduction
Conclusions References
Tables Figures
◭ ◮
◭ ◮
Back Close
Full Screen / Esc
Printer-friendly Version Interactive Discussion
Discussion
P
a
per
|
Discussion
P
a
per
|
Discussion
P
a
per
|
Discussion
P
a
per
|
uncertainties still exist in general in peat bog dust records for one or more of the vari-ables necessary to determine a reliable quantitative estimate of dust MARs relevant for medium/long range transport. Nonetheless we expect that in the near future this goal will be achieved, because of the fast progress of the research in this field (e.g. Ferrat et al., 2011; Kylander et al., 2013; Marx et al., 2009; McGowan et al., 2010; Le Roux
5
et al., 2012; Sapkota et al., 2007; De Vleeschouwer et al., 2012).
3 Methodology
The goal of this compilation is to provide a quality-controlled dataset with specific ref-erence to the possibility of deriving reliable quantitative time series of eolian DMAR relevant to broad spatial scales. According to this principle and considering the specific
10
characteristics of the different paleodust archives, we performed an extensive literature review to identify records suitable for the study of dust variability within the Holocene, encompassing the MH period∼6 ka BP.
There is a spectrum of possible approaches for the compilation of this kind of database, comprised between two extremes: a minimal collection of DMARs (e.g.
sim-15
ilar to DIRTMAP, Kohfeld and Harrison, 2001), and an extensive compilation including a wide variety of metadata (e.g. DIRTMAP3, Maher et al., 2013). For this work, we lean towards the first approach, although we include uncertainties and some additional information, but stick to the age models from the original studies (Appendix A).
The concise operational product of the database is a set of dust MAR time series,
20
with quantitative estimates of the uncertainties associated to both the age and DMAR. Dust MAR uncertainty quantified here is only associated with the calculations, hence it includes the analytical errors and the uncertainty associated with assumptions or approximations in the magnitude of specific variables. We express all quantitative un-certainties as 1σ deviation, assuming a Gaussian distribution of the error. It will be
25
CPD
10, 4277–4363, 2014Twelve thousand years of dust
S. Albani et al.
Title Page
Abstract Introduction
Conclusions References
Tables Figures
◭ ◮
◭ ◮
Back Close
Full Screen / Esc
Printer-friendly Version Interactive Discussion
Discussion
P
a
per
|
Discussion
P
a
per
|
Discussion
P
a
per
|
Discussion
P
a
per
|
This approach does not convey the overall uncertainty related for instance to a spe-cific technique or to a spespe-cific physical setting, which is difficult to express quantitatively. For this reason we complement the dataset with a categorical attribution of the overall confidence on the reliability of the records for the purposes of this work.
In the following paragraphs we report the criteria followed for site selection and
at-5
tribution of a confidence level (Sect. 3.1), and we provide a general description of the approach used to report or calculate the age profiles of eolian DMAR, with relative uncertainties (Sects. 3.2 and 3.3), and the information on the size distributions where available (Sect. 3.4). More specific information for each record is reported in the Sup-plement. In Sect. 3.5 we describe the approach to estimate the mass balance of the
10
global dust cycle throughout the Holocene with the CESM.
3.1 Site selection and attribution of confidence level
In an initial phase of scrutiny of the existing literature we identified paleodust records of interest to our project, based on the requirements that they:
a. have potential for calculating DMAR (i.e., the dust fraction must be identified and
15
quantified in some way; no records with only size information)
b. have sufficient material within the Holocene to quantify DMAR (i.e., at least three data points occur between 0 and 11.7 ka BP, with at least 1 data point between 4.5 and 7.5 ka BP; three data points means three ages for loess/paleosol sequences where EC=1, and three values of dust MAR for all other cases)
20
c. have absolute (i.e., numerical) ages (only for terrestrial sediments)
d. include size information (only for the loess/paleosol records)
We identified 122 sites meeting these criteria. We then labelled each of those sites with a categorical attribution of the overall confidence we have that each record provides a quantitative profile of eolian DMAR with respect to the age, and that it is relevant to
25
CPD
10, 4277–4363, 2014Twelve thousand years of dust
S. Albani et al.
Title Page
Abstract Introduction
Conclusions References
Tables Figures
◭ ◮
◭ ◮
Back Close
Full Screen / Esc
Printer-friendly Version Interactive Discussion
Discussion
P
a
per
|
Discussion
P
a
per
|
Discussion
P
a
per
|
Discussion
P
a
per
|
The attribution of the confidence level is based on whether or not there are substan-tial or critical uncertainties with respect to three aspects: (1) SBMAR (and confidence that DMAR=DF); (2) EC; (3) quantitative distinction between remote and local EC (See Supplement Table 1).
The first criterion (1) is related to the chronology itself, and/or linking the chronology
5
to SBMAR. We consider some types of dates more reliable than others in this context, depending on the kind of natural archive. Among the less reliable, some we consider acceptable per se (“substantial uncertainty”), while others we associate with a “critical uncertainty”.
For marine sediments, we consider both absolute ages, and stratigraphic correlation
10
with oxygen stacks, with the consideration that they are both acceptable in the case of records based on thorium profiling, but only absolute ages are acceptable when isolation of the terrigenous fraction is the method of determination of EC.
For ice cores, we regard age models based on a combination of absolute counting, stratigraphic correlations, and ice thinning modelling (e.g. Veres et al., 2013) with high
15
confidence. These models apply to most of the polar ice cores. On the other hand, records from smaller ice caps and glaciers suffer from the lack of reliable age models, hence ice accumulation profiles, which cannot be resolved on Holocene time scales at present (L. Thompson, P. Gabrielli, C. Zdanowicz, personal communication, 2014.).
For terrestrial sediments, we only considered numerical ages (OSL,14C), in the
ini-20
tial scrutiny phase. This is important as in the case of loess/paleosol sequences, dis-turbances such as erosion and reworking (and agricultural practices, when they are not limited to depths attributed to the last ∼2.5 ka) can disrupt the ideal correspon-dence between dust MAR and DF (Sect. 2.3). We consider evicorrespon-dence of such an occur-rence as a critical uncertainty. In addition, we have attempted to identify sites whose
25
CPD
10, 4277–4363, 2014Twelve thousand years of dust
S. Albani et al.
Title Page
Abstract Introduction
Conclusions References
Tables Figures
◭ ◮
◭ ◮
Back Close
Full Screen / Esc
Printer-friendly Version Interactive Discussion
Discussion
P
a
per
|
Discussion
P
a
per
|
Discussion
P
a
per
|
Discussion
P
a
per
|
When no critical uncertainties are identified, we still consider that SBMAR estimates from loess/paleosol sequences contain substantial uncertainty, according to this crite-rion (1).
The second criterion (2) relates to the ability of a quantitative determination of the EC.
5
For marine cores, we rely on the original and subsequent authors’ evaluation of contamination, e.g., the possibility of non-eolian inputs such as from sediment focus-ing, volcanic, fluvial, hemipelagic, and ice-rafted materials. Marine records that are definitely or very likely to be affected by unaccounted for non-eolian inputs are rated as having critical uncertainty. These include sites in regions that have been
identi-10
fied as being affected by non-eolian inputs such as the volcanic materials and ice-rafted detritus in the North Pacific (Serno et al., 2014), volcanic inputs in the Eastern equatorial Pacific (Olivarez et al., 1991), possible non-eolian detritus in the Western Pacific/Ontong-Java plataeu (Kawahata, 199), or sediment focusing and Ice Rafted Debris (IRD) in the Southern Ocean (Kohfeld and Harrison, 2001). When the
possi-15
ble presence of non-eolian components is more speculative, we attribute a substantial level of uncertainty. In addition, estimates of EC made using quartz concentrations or elemental (e.g. Al) proxies were rated as having substantial uncertainty. Records based on232Th, experimental isolation of eolian component, or a differencing method (EC=1
−CaCO3−opal−Corganic) to determine EC were preferred. 20
For ice cores, primary non-eolian inputs to the insoluble particle material are volcanic in origin, and can usually be singled-out and selectively removed from the records (Nar-cisi et al., 2010). In some cases though, they may be a widespread presence in a record (Gabrielli et al., 2014), which we consider cause for attribution of substantial uncer-tainty. We consider particle counters the more robust methods for the determination
25
CPD
10, 4277–4363, 2014Twelve thousand years of dust
S. Albani et al.
Title Page
Abstract Introduction
Conclusions References
Tables Figures
◭ ◮
◭ ◮
Back Close
Full Screen / Esc
Printer-friendly Version Interactive Discussion
Discussion
P
a
per
|
Discussion
P
a
per
|
Discussion
P
a
per
|
Discussion
P
a
per
|
than in Antarctica (Ruth et al., 2002, 2008). We plainly assume a substantial uncer-tainty for all records based on calcium.
For terrestrial records, we attribute significant uncertainty to the presence of non-eolian inputs, as identified by authors. We attribute substantial uncertainty when an elemental proxy was used for the determination of EC, rather than relying on the
sedi-5
mentation rate of the eolian sediment, or the residual fraction after elimination of non-eolian inputs. A critical uncertainty is attributed to the use of quartz as a quantitative proxy for EC.
The third criterion (3) focuses on the quantitative and size-resolved separation of local vs. remote dust.
10
This criterion in fact does not apply to loess/paleosol sequences, where instead we had applied constraints on the necessity of size information. For the other types of natural archives, all the other records that we found to be most likely affected by unac-counted for local dust inputs, are rated as having critical uncertainty. When the possible presence of local dust inputs is likely, but more speculative, we attribute a substantial
15
level of uncertainty.
Records that meet all criteria are labelled with “high confidence”, whereas failing to meet one criterion results in a record receiving the attribution of “medium confidence” level. A record is given a low level of confidence when either (a) two or more aspects are considered affected by substantial uncertainty, or (b) even one aspect is considered
20
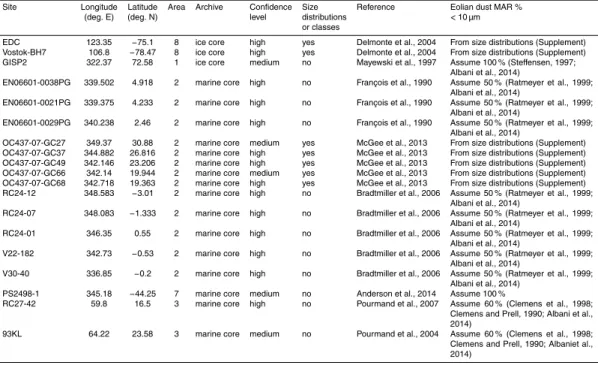
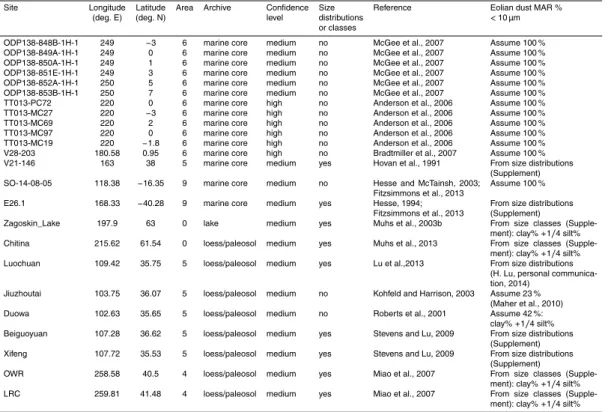
a critical uncertainty. We included in the compilation only records (43 out of 122) with high and medium confidence levels (Table 1; Supplement).
3.2 Ages and chronologies
All the ages reported in this compilation are expressed in thousands of years before 1950 AD (ka BP). We do not re-derive the age models for the records in this
compila-25
CPD
10, 4277–4363, 2014Twelve thousand years of dust
S. Albani et al.
Title Page
Abstract Introduction
Conclusions References
Tables Figures
◭ ◮
◭ ◮
Back Close
Full Screen / Esc
Printer-friendly Version Interactive Discussion
Discussion
P
a
per
|
Discussion
P
a
per
|
Discussion
P
a
per
|
Discussion
P
a
per
|
the Antarctic ice cores, which have been reported to the AICC2012 chronology (Veres et al., 2013), and a specific approach for loess/paleosol sequences described below.
In the previous Sect. 3.1 we explained how loess/paleosol sequences with a medium confidence level satisfy the condition of being representative of large scale patterns. This is based on the possibility of grouping them within sub-regional settings where
5
sequences exhibit a common stratigraphy. These groups should also account for spa-tial variability in the timing of the onset of climatic conditions that are linked to spe-cific loess/paleosol sub-units, e.g. on the CLP. When possible (i.e., for the records in the Western CLP: Duowa and Jiuzhoutai), we constructed SBMAR records for those sites, based on selecting (or interpolating, in the case of Duowa: see Supplement) only
10
the dates at the interface between two consecutive sub-units, in fact reflecting the al-ternation of soil and loess sub-units (S0.S1 – S0.L1 – S0.S2 – S0.L2 – S0.S3). We consider this as a slightly conservative approach, which has the advantage of (a) lim-iting potential abrupt fluctuations in DMARs, which may just be reflecting dating errors (e.g., related to bioturbation), and (b) pairing to some extent the records, consistently
15
with the criteria mentioned earlier. Note that a similar approach was used for the two loess/paleosol sequences from Nebraska included in this compilation (Wauneta, Logan Roadcut). For the central CLP (Beiguoyuan, Xifeng, Luochuan), no such distinction of sub-units within the Holocene paleosol (S0) is visible, thus the time series are based on all the available dates. The same holds for the one single site in Alaska (Chitina).
20
In the previous Section we discussed how either a linear or a more sophisticated age model is used to determine a profile’s chronology. Each numeric age or tie-point is characterized by some uncertainty. The nature and magnitude of the error depend on the specific technique, and include the analytical error, and the calibration or wiggle-matching error when applicable. We try to estimate quantitatively this type of
uncer-25
tainty. Unquantifiable uncertainties include the effects of bioturbation, sample contami-nation, etc.
CPD
10, 4277–4363, 2014Twelve thousand years of dust
S. Albani et al.
Title Page
Abstract Introduction
Conclusions References
Tables Figures
◭ ◮
◭ ◮
Back Close
Full Screen / Esc
Printer-friendly Version Interactive Discussion
Discussion
P
a
per
|
Discussion
P
a
per
|
Discussion
P
a
per
|
Discussion
P
a
per
|
calibration software; OSL measurement in water content); (3) other age model uncer-tainties. For instance radiocarbon dating requires corrections to account for the carbon reservoir effect (Brauer et al., 2014). Calibration software has been developed to per-form this task (e.g. Bronk Ramsey, 1995; Reimer et al., 2009). All radiocarbon ages reported in this paper are calibrated, according to the original references.
5
In the case of age models more complicated than the simple linear relation used to derive a LSR, errors associated with ages are usually reported in the publications. An example of this are the new ice core chronologies, such as AICC2012, which report the associated age uncertainties (Veres et al., 2013).
For a linear sedimentation model, the age of a given depth horizon is calculated
10
by linear interpolation between two dated horizons. In this case the age error of the samples is bound to the uncertainties associated with the bracketing ages. The age-model error of the sample can then be derived through the error propagation formula:
εsample=
q
ε2a+ε2
b (1)
whereεa and εb are the age errors of the two adjacent dated points between which
15
the linearly interpolated sample age was calculated.
The other usual possibility is that the age model of a site was determined without the help of any absolute age marker, but just using stratigraphic correlation. A typical example of such an age model is one based on stratigraphic correlation of a marine sediment core site’sδ18O profile with the SPECMAP stack (Imbrie et al., 1984). In this
20
case and in all other circumstances where the age error is not reported, we arbitrarily assume an uncertainty of 6.8 % (1σ, corresponding to an overall 10 %).
3.3 Eolian dust MARs
Dust MARs constitute the key element of this compilation. We previously discussed (Fig. 2) the non-parallel depth resolution of the age samples and the EC samples.
25
CPD
10, 4277–4363, 2014Twelve thousand years of dust
S. Albani et al.
Title Page
Abstract Introduction
Conclusions References
Tables Figures
◭ ◮
◭ ◮
Back Close
Full Screen / Esc
Printer-friendly Version Interactive Discussion
Discussion
P
a
per
|
Discussion
P
a
per
|
Discussion
P
a
per
|
Discussion
P
a
per
|
resolution, which is determined ultimately by the EC resolution (see also Fig. 1). The typical exceptions are loess/paleosol sequences, where SR alone (hence the resolution of the age samples) determines the dust MAR.
We report both the SBMAR (or SR and DBD) and EC for each point in the records, with relative uncertainties. The uncertainties are taken from the original sources when
5
available, and assigned otherwise. The dust MAR uncertainty is determined from the relative uncertainties in the factors SBMAR and EC, combined through the error prop-agation formula:
εMAR=
s ε
SBMAR
µSBMAR
2 +
ε
EC
µEC
2
(2)
with εSBMAR/EC and µSBMAR/EC representing the absolute errors and the average, re-10
spectively.
In this compilation, there are two cases when SBMAR is provided directly instead of being the combination of SR·DBD: ice cores and marine sediment records derived using the thorium profiling method. In the case of ice cores SBMAR corresponds to the ice accumulation rate, expressed in m (water equivalent) per year, which incorporates
15
information about ice density and thinning with depth (Alley, 2000; Veres et al., 2013). When not reported, we assume that the relative uncertainty is the same as that of the age uncertainty. For marine cores, we consider the relative uncertainty in the thorium excess (xs-Th) parameter. When not reported we assumed a relative uncertainty of 5 %.
20
In all other cases, for SR we consider that the relative uncertainty is the same as the age uncertainty, which again is combined through the error propagation formula to the other uncertainties. DBD is sometimes measured, often just assumed based on the literature from the broad region. When no information was reported in the original works, we assumed a dry bulk density of 1.48 g cm−3for the CLP (Kohfeld and Harrison,
25
2003), and 1.45 g cm−3for North America (Bettis et al., 2003). When not measured, we
CPD
10, 4277–4363, 2014Twelve thousand years of dust
S. Albani et al.
Title Page
Abstract Introduction
Conclusions References
Tables Figures
◭ ◮
◭ ◮
Back Close
Full Screen / Esc
Printer-friendly Version Interactive Discussion
Discussion
P
a
per
|
Discussion
P
a
per
|
Discussion
P
a
per
|
Discussion
P
a
per
|
With the exception of loess, for which we assume EC=1 unless otherwise stated, EC is either expressed in terms of fraction or concentration of dust or a proxy in the bulk sediment. For the Antarctic ice cores considered in this compilation the EC is de-termined after the volume dust concentrations dede-termined by a Coulter Counter; the mass concentration is calculated by multiplying that per the assumed dust density of
5
2.5 g cm−3(Delmonte et al., 2004). The uncertainty in this case is taken from the stan-dard deviation of the∼3 replicate measurements. When a dust proxy is used instead to determine the EC, its concentration is divided by the element’s typical abundance in dust (or crustal abundance). In this case the analytical uncertainty (if not reported, we assume 5 %) is combined with the uncertainty of the dust proxy i.e. the variability
10
of its amount in dust. We keep the proxy-dust relation from the original studies when available.
Several records in this compilation use232Th as a dust proxy, for which we assume 10.7 ppm in dust (McGee et al., 2007) if not specified otherwise in the original papers. We always assumed 9.3 % uncertainty for232Th as a dust proxy (McGee et al., 2007),
15
or a combined uncertainty of 15 % when the analytical uncertainty was not available. In one case (GISP2) we used calcium as a dust proxy (Mayewski et al., 1997), assum-ing a variable calcium-dust relation in Greenland with climate conditions, resultassum-ing in 26 % calcium in dust (Ruth et al., 2002; Steffensen, 1997), with an arbitrarily assigned uncertainty of 20 %.
20
When isolation of the detrital component from the sediment matrix is done by removal of carbonates, opal, and organic matter, then the EC can be estimated from the bulk terrigenous component. We assume 5 % uncertainty in this procedure.
We stress once again that the quantitative uncertainties estimated here do not fully represent the overall uncertainty of a record, which should be pondered in combination
25
CPD
10, 4277–4363, 2014Twelve thousand years of dust
S. Albani et al.
Title Page
Abstract Introduction
Conclusions References
Tables Figures
◭ ◮
◭ ◮
Back Close
Full Screen / Esc
Printer-friendly Version Interactive Discussion
Discussion
P
a
per
|
Discussion
P
a
per
|
Discussion
P
a
per
|
Discussion
P
a
per
|
3.4 Dust grain size distributions
Here we focus on the importance of the grain size information and its intimate link to the DMAR. When possible, we retrieved the size distributions associated to the records in this compilation. Depending on the technique used, the size data was collected in the form of size distributions (e.g. particle counters and laser particle analysers) or size
5
classes (sieve and pipette method), e.g. the percentages of sand, silt, and clay (Muhs et al., 2013; Lu et al., 1999).
Despite the differences and uncertainties associated with specific methods (Ma-howald et al., 2014; Reid, 2003), we include the available information according to the original sources. In the case of size classes, we report the information as provided in
10
the original papers. In addition, we take an innovative approach to organizing the size distribution data. First of all, we carry the original size distributions to a new, common binning, in order to enhance the accessibility of the data and to facilitate the inter-comparison among records. Second, we associate the size distributions to the DMAR time series sample-to-sample where possible, so that DMAR time series for different
15
size ranges can be easily determined.
The re-binning procedure to adapt the original size distributions from observations is organized in a series of steps: (1) definition of a new binning model; (2) building the cumulative distribution from the normalized observations; (3) fitting a spline curve to the observation cumulative distribution; (4) integration of the fitted spline curve into the
20
new bins; (5) evaluation and summary of the fit of the new binned data to the original observations. The fitting spline in (3) is bounded to have values between 0 and 1, and to be monotonically non-decreasing.
One challenge in finding a new binning model is to avoid significant distortion to the original size distribution, given that observations have both a different resolution and
25