Submitted5 October 2015
Accepted 28 January 2016
Published18 February 2016
Corresponding author
Imre Vass, vass.imre@brc.mta.hu
Academic editor
Marion Röder
Additional Information and Declarations can be found on page 19
DOI10.7717/peerj.1708 Copyright
2016 Paul et al.
Distributed under
Creative Commons CC-BY 4.0 OPEN ACCESS
Contrasting response of biomass
and grain yield to severe drought in
Cappelle Desprez and Plainsman V wheat
cultivars
Kenny Paul1, János Pauk2, Zsuzsanna Deák1, László Sass1and Imre Vass1
1Institute of Plant Biology, Biological Research Centre, Szeged, Hungary
2Deparment of Biotechnology, Cereal Research Nonprofit Company, Szeged, Hungary
ABSTRACT
We report a case study of natural variations and correlations of some photosynthetic parameters, green biomass and grain yield in Cappelle Desprez and Plainsman V winter wheat (Triticum aestivumL.) cultivars, which are classified as being drought sensitive and tolerant, respectively. We monitored biomass accumulation from secondary leaves in the vegetative phase and grain yield from flag leaves in the grain filling period. Interestingly, we observed higher biomass production, but lower grain yield stability in the sensitive Cappelle cultivar, as compared to the tolerant Plainsman cv. Higher biomass production in the sensitive variety was correlated with enhanced water-use efficiency. Increased cyclic electron flow around PSI was also observed in the Cappelle cv. under drought stress as shown by light intensity dependence of the ratio of maximal quantum yields of Photosystem I and Photosystem II, as well by the plot of the Photosystem I electron transport rate as a function of Photosystem II electron transport rate. Higher CO2uptake rate in flag leaves of the drought-stressed
Plainsman cv. during grain filling period correlates well with its higher grain yield and prolonged transpiration rate through spikes. The increase in drought factor (DFI) and performance (PI) indices calculated from variable chlorophyll fluorescence parameters of secondary leaves also showed correlation with higher biomass in the Cappelle cultivar during the biomass accumulation period. However, during the grain filling period, DFI and PI parameters of the flag leaves were higher in the tolerant Plainsman V cultivar and showed correlation with grain yield stability. Our results suggest that overall biomass and grain yield may respond differentially to drought stress in different wheat cultivars and therefore phenotyping for green biomass cannot be used as a general approach to predict grain yield. We also conclude that photosynthetic efficiency of flag and secondary leaves is correlated with grain yield and green biomass, respectively. In addition, secondary trait associated mechanisms like delayed senescence and higher water-use efficiency also contribute to biomass stability. Our studies further prove that photosynthetic parameters could be used to characterize environmental stress responses.
SubjectsAgricultural Science, Plant Science
INTRODUCTION
Drought is a complex environmental stress factor, which significantly affects the growth and development of plants. The effects of drought are expected to increase with climate change and increasing water shortage. Plants have evolved specific acclimation and adaptation mechanisms in order to cope with short- and long-term limitation of water availability. These mechanisms depend on species, genotypes and the co-occurrence with other stresses, such as high temperature or evaporative demand. Analysis of these protective mechanisms can be a key for improved understanding of the molecular background of drought stress tolerance and resistance (Harb et al., 2010;Berger, Parent & Tester, 2010).
Plants can respond to limited soil water availability by various strategies including drought escape, which is described as the ability of plants to complete their life cycle before severe stress sets in. Besides the escape strategy plants can resist water scarcity conditions via drought avoidance, or drought tolerance (Levitt, 1980;Price et al., 2002). Drought avoidance is classified as the ability of plants to maintain high tissue water potential despite soil water deficit. This can be achieved via improved water uptake under stress. The capacity of plant cells to hold acquired water and reduce water loss also confers drought avoidance. Plants can survive water stress by improved root traits, decreasing stomatal conductance, leaf area and radiation absorptivity (Price et al., 2002). Drought tolerance on the other hand is the ability of plants to utilize limited amount of water, leading to low tissue water potential, with higher efficiency regarding growth, biomass accumulation and reproduction (Ingram & Bartels, 1996). Plants under drought stress accumulate compatible solutes and thrive on by maintaining cell turgor and reducing evaporative water loss (Yancey et al., 1982).
In different species it has been shown that drought conditions affect the relationship between the carbon content in photosynthetic organs, such as leaves (source), and the carbon content in heterotrophic organs, such as seeds and roots (sink), indicating that the processes related to carbon partitioning are sensitive targets of drought stress ( Cuellar-Ortiz et al., 2008). These alterations cause the abortion of reproductive structures, as well as a decrease in the accumulation of biomass in storage organs, causing losses in crop production (Boyer & Westgate, 2004;Marcelis et al., 2004).
characterize the consequences of stress-induced effects, there is a highly important and often overlooked question in the case of cereal crops: whether the most easily quantified phenotypic parameters such as the above ground green biomass can predict correctly the grain yield or not.
In the present work we aimed at the characterization of drought-induced responses of two model wheat cultivars, Plainsman V and Cappelle Desprez, both of them are winter wheat varieties (http://genbank.vurv.cz/wheat/pedigree). Plainsman V, released in 1974 in Kansas, USA, produces a moderate yield of high-quality grain. Cappelle Desprez, which gives a high yield under intensive growth conditions, was bred and released in France in 1946. These varieties, are characterized as either being drought tolerant (Plainsman), or drought sensitive (Cappelle Desprez), respectively (Guóth et al., 2009;Secenji et al., 2010).
Our data obtained by measurements of PSI and PSII electron transport, thermal imag-ing of leaf temperature, as well as phenotypic characterization of biomass accumulation suggest that under drought stress biomass development is correlated with photosynthetic efficiency of secondary leaves, as well as secondary trait associated mechanisms like delayed senescence and lower transpiration rate. However, grain yield stability under drought stress is higher for the Plainsman cultivar, which has smaller biomass but larger grain production, than the Cappelle Desprez cultivar, which can accumulate larger green biomass, but has smaller grain yield. Therefore, in cases when optimization of grain yield is an important target of phenotyping the consequences of drought and other stress effects should include not only the green biomass, but also grain production.
METHODS
Plant material and growth conditions
Vernalization of one-week old seedlings was carried out for 6-week, at 4 ◦C in a cold chamber, under continuous dim light. Vernalized plantlets of the Cappelle Desprez and Plainsman V (Guóth et al., 2009) (http://genbank.vurv.cz/wheat/pedigree) winter wheat (Triticum aestivumL.) varieties were planted in a soil-sand-peat mixture (3:1:1, v/v/v). Plants were regularly irrigated and grown in controlled green-house conditions for two weeks before starting the drought stress treatment. Photosynthetically active radiation (PAR) within controlled environment was maintained with a 14 h photoperiod at a PPFD of 400–500µmol m−2s−1, 22–25 ◦C and ca. 45–55% relative humidity.
Drought stress treatment and measuring protocol
experimental trials conducted in August–September 2012, April–May and July–August 2013, respectively.
Gas exchange measurements
Gas exchange parameters: CO2uptake rate, transpiration, stomatal conductance and
intercellular CO2concentration were measured by using a Licor 6400 gas analyzer
(LI-COR Biosciences, Lincoln, NE, USA). Two to three selected pieces of attached secondary, as well as flag leafs from plant replicates treated under respective drought regimes were inserted into the gas cuvette for individual measurements. The gas cuvette conditions were set to 400 ppm CO2, ambient temperature and growth light intensity of
photosynthetically active radiation (of 400µmol m−2s−1).
Water-use efficiency (WUE) was calculated from the ratio of photosynthesis (A) and transpiration (E) (Farquhar & Richards, 1984;Lovelli et al., 2007).
OJIP chlorophyll afluorescence measurements
OJIP chlorophyllafluorescence transients were measured by a Plant Efficiency Analyzer (Pocket Pea, Hansatech, UK). The transients were induced by red light from an LED source (627 nm, up to 3,500µmol m−2s−1intensity). Prior to measurements, performed on the adaxial surface, leaves were dark adapted to for 20 min using light tight leaf-clips. The OJIP-test (Strasser, Srivastava & Tsimilli-Michael, 2000) was used to analyze the chlorophyllafluorescence transients and the following original data were acquired: O (Fo) initial fluorescence level (measured at 50µs), P (Fm) maximal fluorescence intensity,
as well as the J (at about 2 ms) and the I (at about 30 ms) intermediate fluorescence levels. From these specific fluorescence features the following parameters of photosynthetic efficiency were calculated: maximal PSII quantum yield,Fv/Fm; The ratio of variable
fluorescence to initial fluorescence,Fv/FowhereFv=Fm−Fo; Probability of electron
transport out ofQA, (1-Vj)/VjwhereVj=(F2 ms−Fo)/Fv; Total complementary area
between the fluorescence induction curve andFmof the OJIP curve, Area;QAreducing
reaction centers per PSII antenna chlorophyll, RC/ABS=(FV/FM)·(FJ−F0)/[4·
(F300µs−F0)] (Zurek et al., 2014;Campos et al., 2014;Strasser, Tsimilli-Michael &
Srivastava, 2004); Performance index (potential) for energy conservation from photons absorbed by PSII to the reduction of intersystem electron acceptors, PIAbs(Zivcak et al.,
2008;Campos et al., 2014).
PIAbs=
1−(Fo/Fm) Mo/Vj
×Fm−Fo
Fo
×1−Vj
Vj
whereMo= 4∗(F300µs−Fo)/ (FM−Fo) represents initial slope of fluorescence kinetics. For screening of drought stress tolerance a further parameter, the so-called drought factor index (DFI) was used, which is derived from PI values measured after 1 or 2 weeks of drought treatment, and reflects the ability of plants to tolerate sustained drought stress conditions (Oukarroum et al., 2007)
Simultaneous measurements of P700 redox state and chlorophyll fluorescence
Variable chlorophyll fluorescence from PSII and the amount of oxidized PSI primary Chl electron donor (P700+) was simultaneously measured using a DUAL-PAM-100 system (WALZ, Effeltrich, Germany). From the fluorescence dataFv/Fmand the effective
quantum yield of photochemical energy conversion in PS II, Y(II)= (Fm′−F)/Fm′ (Genty,
Briantais & Baker, 1989) whereFo,Fo′ are dark fluorescence yield from dark- and light-adapted leaf, respectively andFm,Fm′are maximal fluorescence yield from dark- and light-adapted leaf, respectively, were calculated. The P700+signal (P) may vary between a minimal (P700 fully reduced) and a maximal level (P700 fully oxidized). The maximum level of P700+is calledPmin analogy withFm. It was determined by application of a
saturation pulse (300 ms, 10,000µmol m−2s−1; 635 nm) after pre-illumination with far-red light.Pm′is analogous to the fluorescence parameterFm′and was determined by applying 800 ms saturating pulse of 635 nm red light. The photochemical quantum yield of PSI, Y(I) is the quantum yield of photochemical energy conversion in PSI. It is calculated as Y(I)=(Pm′−P)/Pm. Y(ND) is the quantum yield of non-photochemical energy dissipation in PSI due to donor side limitation, Y(ND)= P/Pm. Y(NA) is the
quantum yield of non-photochemical energy dissipation due to acceptor side limitation in PSI, Y(NA) = (Pm−Pm′)/Pm, and Y(I)+Y(ND)+Y(NA)=1 (Klughammer & Schreiber,
1994;Singh et al., 2014). Non-photochemical quenching NPQ (Bilger & Bjorkman, 1990), was calculated as (Fm−Fms)/Fms, whereFmrepresents the fluorescence of a dark-adapted
sample andFmsrepresents a fluorescence of the illuminated sample. Plants were
dark-adapted for∼20 min and kinetics were measured after repeated light pulses of 94 PPFD for 300 s. Leaves were subsequently relaxed in darkness for 240 s and fluorescence while continuously measuring and recording fluorescence (Szalonek et al., 2015).
The electron transport rates through PSII as well as through PSI were determined simultaneously (Miyake et al., 2005;Fan, 2007). The apparent rate of electron transport in higher plants were calculated as ETR(II)=Y(II)∗PPFD∗0.5∗0.84 and ETR(I) =Y(I)∗PPFD∗0.5∗0.84 (Genty, Briantais & Baker, 1989), where Y(II) and Y(I) are effective quantum yields of PSII and PSI respectively, PPFD is the photon flux density of incident photosynthetically active radiation and two coefficients (0.5 and 0.84 for higher plants, which imply that PSII and PSI are equally excited, and that due to leaf absorbance properties only 84% of incident irradiance will be absorbed by the photosystems,
respectively (Björkman & Demmig, 1987;Schreiber, 2004).
Thermal imaging
Table 1 Effect of drought stress on the total yield of the experiment and the thousand-kernel weight of Cappelle Desprez and Plainsman V wheat cultivars.
Treatment Total grain yield/planta(g) 1,000 kernel weighta(g)
10% W, Cappelle Desprez 0.41±0.01 (∗∗p
<0.01) 19.18±0.32 (∗∗∗p
<0.001) 60% W, Cappelle Desprez 1.57±0.12 (∗
p<0.05) 41.20±1.47 (∗∗∗
p<0.001) 10% W, Plainsman V 0.77±0.06 29.10±1.79
60% W, Plainsman V 1.01±0.07 32.14±0.91
Notes.
aData is average of three replications.
The∗signs indicate the level of significance for the difference between the two cultivars when compared under the same wa-tering conditions.
Digital imaging
Digital images of seedlings were taken by using a Nikon D80 camera equipped with an AF-S DX Zoom-NIKKOR 18–135 mm objective (f/3.5–5.6G ED-IF Lens) and close-up rings. Digital images of plant replicates under various drought stress treatments were analyzed for green biomass area using ImageJ software. We used colour thresholding to select just the plant green area and exclude the stand, pot, shadows and yellowish leaves (http://rsbweb.nih.gov/ij/).
Statistical analysis
The comparison of traits of plants of the same variety, which were grown under different watering conditions was based on the two-sample Student’st-Tests (http://www.physics. csbsju.edu/stats/t-test.html). Levels of significance (Pvalues) in differences from means of well watered and drought stressed plants are indicated in the figure legends.
RESULTS
Phenotyping for biomass accumulation and grain yield
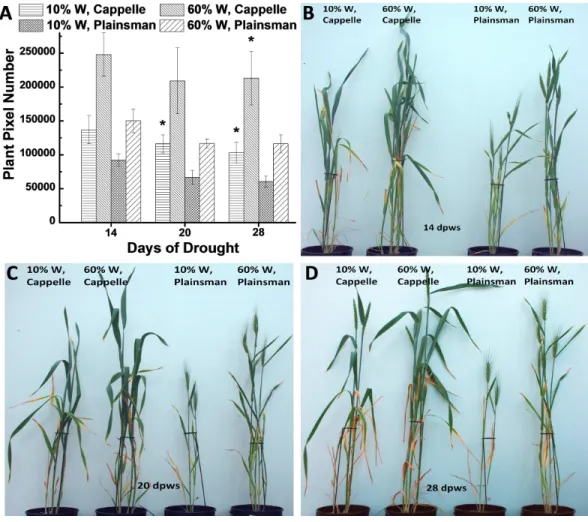
Growth of wheat plants was monitored by digital photography by recording green pixel-based shoot surface area of wheat plants, which was performed during the whole growth period once a week. According to our previous data the green pixel-based shoot surface area correlates with green biomass (Fehér-Juhász et al., 2014). Digital RGB imaging of leaf/shoot area showed that the Cappelle Desprez cv. produces larger above ground green biomass than Plainsman V not only under conditions of water availability but also under water scarcity (Fig. 1). This conclusion is supported by direct measurement of green biomass (Fig. S1).
The grain yield data showed an opposite trend compared to the biomass accumulation, i.e., although grain yield under well watered conditions was higher in the Cappelle
Desprez cv., the Plainsman V produced more grains under water limitation, and showed lower grain yield loss (24%) than the Cappelle Desprez (74%) (Table 1), see alsoFig. S2.
Carbon fixation, stomatal functions and water-use efficiency
From gas exchange measurements, we could observe that the net CO2uptake rate and
Figure 1 The effect of drought stress on the accumulation of green biomass.(A) The area of the green leaves and shoots, which is used as a proxy for the above ground green biomass, was calculated from the analysis of digital photographs for the Cappelle Desprez and the Plainsman V wheat cultivars kept either under well watered (60% field capacity) or water limited (10% field capacity) conditions. The measure-ments were performed after 14, 20 and 28 days following the start of the drought treatment, which oc-curred after two weeks of planting the vernalized seedlings into pots. The means±SE were calculated from five plants/treatment. The asterisks indicate significant differences (∗p≤0
.05) between plants of the two different varieties, which were kept at the same soil water content. (B–D) show representative pictures of Cappelle Desprez and Plainsman V wheat plants after 14, 20 and 28 days of water stress, respectively.
After the second week the net CO2uptake decreased in the secondary leaves of water
limited plants both in the case of drought sensitive Cappelle Desprez and drought tolerant Plainsman V cv. (Fig. 2A). Interestingly, in the grain filling period only Cappelle Desprez cv. responded with decreased CO2uptake to the decreased soil water content in case of
the flag leaves (Fig. 2A).
The response of stomatal conductance (Fig. 2B) and evaporation rate (Fig. 2C) shows similar pattern to that of CO2uptake. Interestingly, in case of secondary leaves both
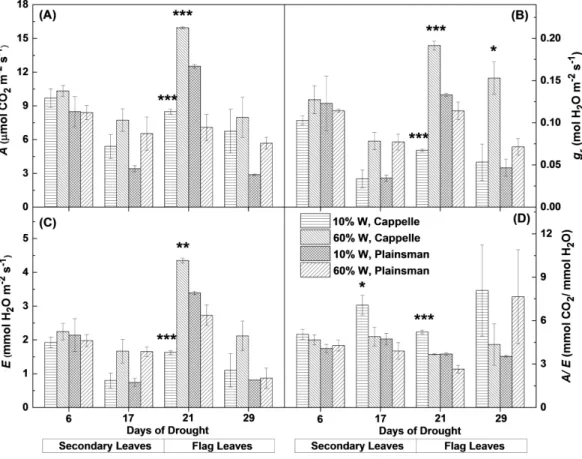
Figure 2 Gas exchange parameters of Cappelle Desprez and Plainsman V wheat plants.(A) Net rate of photosynthesis (A). (B), Stomatal conductance (gs). (C), Transpiration rate (E). (D) Water-use efficiency
(A/E). Measurements were performed in well watered (60% W) or water limited (10% W) wheat plants. Values represent means±SE of 5 plants/treatment. The asterisks indicate significant differences (∗p≤
0.05,∗∗p≤0.01,∗∗∗p≤0.001) between plants of the two different varieties, which were kept at the same
soil water content.
The Plainsman cv. did not close its stomata in the flag leaves and did not decrease its evaporation rate during early grain filling phase (21st day). However, in the later phases (29th day) of the drought stress the stomatal conductance and evaporation showed a decreasing tendency also in the Plainsman V cv. (Figs. 2Band2C).
The ability of leaves to achieve optimal photosynthesis relative to the amount of used water, i.e., to conserve water under drought conditions, is characterized by the water-use efficiency (WUE), which is given by the ratio of the rates of net photosynthesis and transpiration. In the Cappelle Desprez cv. the WUE (A/E) parameter increased both in the secondary and flag leaves, while in the Plainsman cv. WUE increased only slightly in the secondary leaves and also in the flag leaves during the grain filling phase in the drought stressed plants (Fig. 2D), which is consistent with sustained photosynthesis and flag leaf transpiration in order to maintain high grain yield.
Thermal imaging
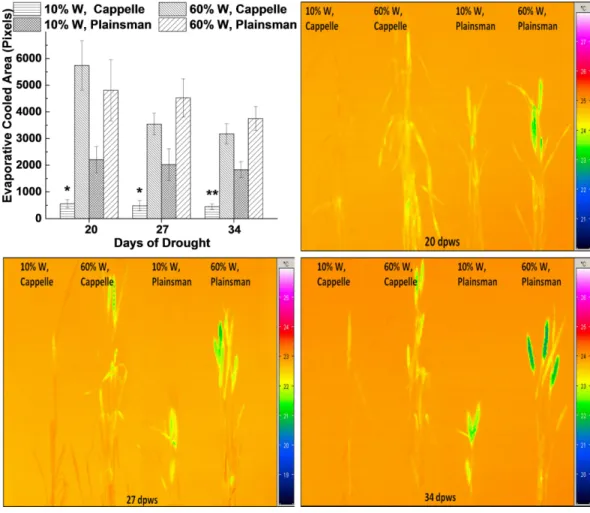
Figure 3 Thermal imaging of drought stressed Cappelle Desprez and Plainsman V wheat plants.(A) Thermal images of Cappelle Desprez and Plainsman V wheat plants were quantified by using ImageJ soft-ware by thresholding evaporative cooled area relative to the temperature of the surrounding air. The pre-sented data were obtained from the average of thermal images taken under conditions of water stress (10% W) and well watered control (60% W) on the 20th, 27th and 34th day of drought stress. The means ±SE were calculated from 5 plants/treatment. The asterisks indicate significant differences (∗
p≤0.05,
∗∗p≤0
.01) between plants of the two different varieties, which were kept at the same soil water content. (B–D) show representative thermal images of Cappelle Desprez cv. and Plainsman V cv. plants under wa-ter stress (10% W) and control (60% W) conditions taken afwa-ter 20, 27 and 34 days of drought stress, re-spectively.
status of stomata influences not only CO2uptake, but also the efficiency of evaporating
Figure 4 Fast chlorophyllafluorescence and P700 kinetics.The measurements were done in leaves of
well-watered (60% W) and drought stressed (10% W) of Cappelle Desprez and Plainsman V cv. wheat plants. Measurements were carried out in early developed secondary leaves on the 14th and 20th days of treatment, while on the 21st and 28th days of treatment in flag leaves. The saturation pulse intensity was 10,000µmol photons m−2s−1for 0.8 s. The O, J, I and P points represent the standard phases of
chloro-phyllafluorescence transients.
efficient CO2uptake and large net photosynthesis rate for a sustained period during grain
filling leading to increased grain yield.
Simultaneously recorded fast Chl fluorescence and P700 redox kinetics
& Strasser, 2005;Tsimilli-Michael & Strasser, 2008), and was correlated with a higher PSI activity due to an increased PSI/PSII ratio (Ceppi et al., 2012). In case of secondary leaves, the Cappelle Desprez cv. responded to water withdrawal with only minor changes of the OJIP fluorescence and P700 kinetic transients in the first 2 weeks of the drought treatment (Fig. 4A). After 3 weeks, however, faster rise in Chl fluorescence and P700 oxidation and re-reduction transient in normalized curve was observed in drought stressed Cappelle cv. showing reduction of ferredoxin and increased PSI content (ca. 20%,Fig. 4B) (Schansker, Tóth & Strasser, 2005;Ceppi et al., 2012). In drought stressed Plainsman V we could observe a faster rise of the J-I phase, PSI oxidation was prolonged and PSI re-reduction did not reach normal level. Faster decay of drought stressed Plainsman V shows less functional PSII activity and smaller PSI content. Well-watered controls of both cultivars showed comparable responses in Chl fluorescence and P700 redox kinetics (Fig. 4B).
During the early phase of spiking (21st and 28th day of drought), 10% W Cappelle Desprez cv. showed similar trend of higher PSI content in the flag leaves with an increase of I-P amplitude in fast chlorophyll fluorescence and of P700+/P700 ratio kinetics (Figs. 4Cand4D). In drought-stressed Plainsman V we could observe a slower rise of J-I phase and I-P amplitude with increased P700 oxidation ending in faster re-reduction decay kinetics (Figs. 4Cand4D). This indicates higher functional PSII activity for drought stressed Plainsman V in the flag leaves during grain filling period.
Chl fluorescence parameters reflect plant responses to drought stress
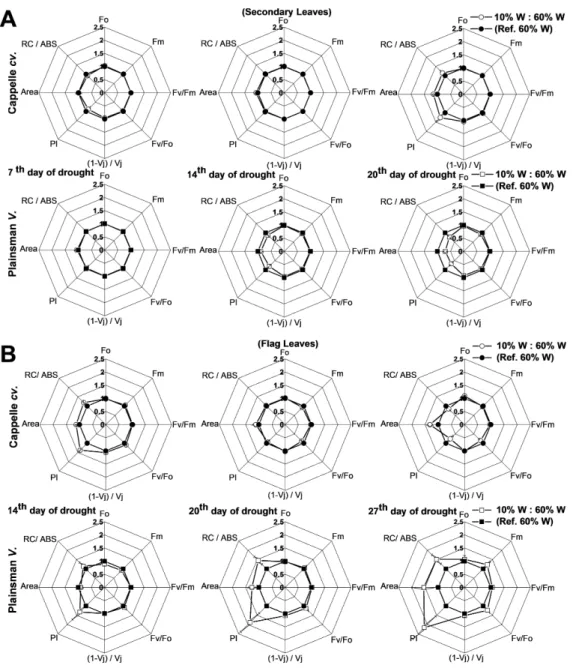
Various biophysical parameters derived from Chl a fluorescence transient measurements help to understand the energy flow through PSII and provide useful indicators of the development and severity of stress effects (Kenny et al., 2011), including drought. One of the useful calculated parameters is the so called performance index (PI), which combines the three main functional steps taking place in PSII (light energy absorption, excitation energy trapping, and conversion of excitation energy to electron transport), and was used as measure of drought stress tolerance (Strauss et al., 2006). PI, which provides useful and quantitative information about the physiological conditions and the vitality of plants, revealed differences among varieties under conditions of drought stress (Oukarroum et al., 2007). Other calculated parameters like Area and RC/ABS also responded for secondary and flag leaves under severe drought stress (Campos et al., 2014).
Figure 5 Deduced variable Chlafluorescence parameters.(A) Spider graphs of various chlorophyll
flu-orescence parameters (Fo,Fm,Fv/Fm,Fv/Fo, (1−Vj)/Vj, PI, Area, RC/Abs) are shown in the early
devel-oped secondary leaves (A) and in flag leaves (B). Values obtained for drought stressed plants are shown after normalization to their respective well watered controls. Data represent means±SE of five plants/ treatment.
RC/ABS, andFv/Fmparameters after 4 weeks of drought stress (Fig. 5B). These data
show that the photosynthetic efficiency of flag leaves of the Plainsman V cv. is affected by drought stress conditions to a smaller extent than of the Cappelle Desprez variety.
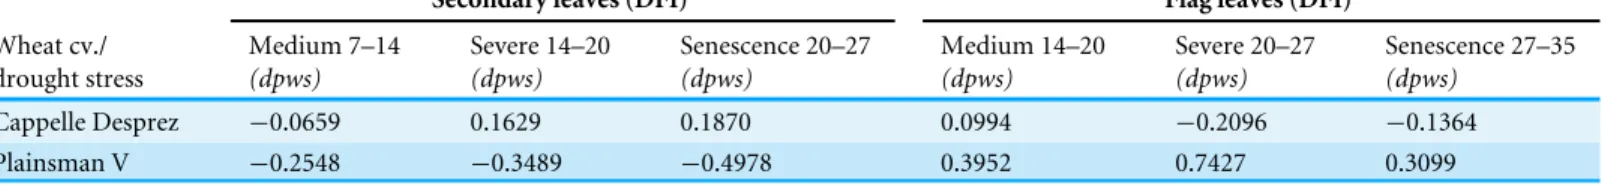
Table 2 Calculated Drought Factor Index (DFI) values of drought sensitive Cappelle Desprez cv. and drought tolerant Plainsman V under medium to severe drought.
Secondary leaves (DFI) Flag leaves (DFI)
Wheat cv./ drought stress Medium 7–14 (dpws) Severe 14–20 (dpws) Senescence 20–27 (dpws) Medium 14–20 (dpws) Severe 20–27 (dpws) Senescence 27–35 (dpws)
Cappelle Desprez −0.0659 0.1629 0.1870 0.0994 −0.2096 −0.1364 Plainsman V −0.2548 −0.3489 −0.4978 0.3952 0.7427 0.3099
Notes.
The DFI values were calculated from the variable Chl fluorescence transients as described in the Materials and methods in Cappelle Desprez and Plainsman V wheat plants, which were exposed to drought from 7 to 35 days of post water stress (dpws).
et al., 2007). A large positive value of DFI indicates drought tolerance, while a large negative value is characteristic for drought sensitivity. According toTable 2, in the periods of severe drought and senescence the secondary leaves of the Cappelle Desprez and Plainsman V cv. show positive and negative DFI, respectively, which is in agreement with the larger green leaf area and biomass of Cappelle Desprez as compared to that of Plainsman V Interestingly, the DFI values of the flag leaves show an opposite trend with positive DFI for the Plainsman and negative DFI for the Cappelle Desprez cv. Again, this behavior is consistent with the higher grain yield of Plainsman V as compared to the Cappelle Desprez cv. under drought stress.
Drought induced cyclic electron flow around PSI
A characteristic response of drought stressed wheat plants is the induction of cyclic electron flow (CEF) around Photosystem I (Johnson, 2011;Zivcak et al., 2013;Zivcak et al., 2014), which directs electrons from the acceptor side of PSI back to the PQ pool. This effect is considered as a defense mechanism against oxidative stress that develops under conditions of limited availability of CO2as final electron acceptor due to stomatal closure (Golding &
Johnson, 2003;Zulfugarov, Mishra & Lee, 2010). Evidence for cyclic flow at high light exists in all the plants to a greater or lesser extent (Kono, Noguchi & Terashima, 2014).
Figure 6 Changes in the Y(I)/Y(II) ratio.Maximal quantum yield of PSI (Y(I)) and PSII (Y(II)) were measured in leaves of well watered (60% W—filled symbols) and severe drought-stressed (10% W—open sysmbols) Cappelle Desprez (circles) and Plainsman V (squares) cv. wheat seedlings at different light in-tensities of 94, 363 and 849µmol photons m−2s−1. The values, which are shown as a function of the
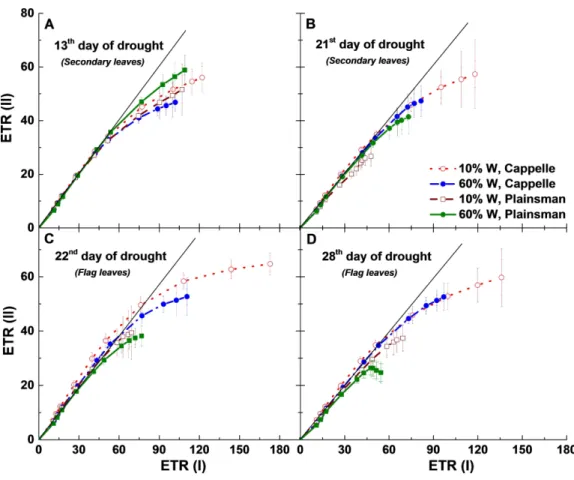
Figure 7 Relationship between PSII and PSI electron transport rates.ETR(II) and ETR(I) were measured as a function of light intensity, and the ETR(II) values were plotted as a function of the corresponding ETR(I) values. Measurements were done in leaves of well-watered (60% W—filled symbols) and drought-stressed (10% W—open symbols) Cappelle Desprez (circles) and Plainsman V (squares) cv. wheat plants, respectively. Data represent the means±SE of five plants per treatment.
Figure 8 Light response of quantum yield parameters of PSI photochemistry.P700 kinetics were recorded in Cappelle Desprez (circles) and Plainsman V (squares) cv. plants in well-watered (60% W—closed symbols) and drought-stressed (10% W—open symbols) conditions. Y(I), the effective quantum yield of PSI; Y(ND), the quantum yield of non-photochemical energy dissipation due to the donor-side limitation; Y(NA), the quantum yield of non-photochemical energy dissipation due to the acceptor-side limitation are plotted as a function of light intensity. Data represent the means±SE of five plants per treatment.
Light responses of the PSI electron transport parameters
Characterization of electron transport through Photosystem I is important for the identification of the sites where limitation of electron flow occurs under conditions of drought stress. Light responses of PSI parameters obtained from P700 signals were further analyzed (Fig. 8). The fraction of overall P700 that is kept in the oxidized state, Y(ND), was significantly increased with the increase of PPFD in secondary and flag leaves of drought stressed Plainsman V from the end of the second week of water withdrawal with respect to Cappelle cv in both 60% and 10% field capacity (Figs. 8Band8C). Higher values of Y(ND) indicates that a major fraction of overall P700 is in the oxidized state during illumination due to limitation of electron flow from PSII towards PSI under severe drought condition. Y(NA) represents the fraction of overall P700 that cannot be oxidized by a saturation pulse in a given state due to a lack of oxidized PSI acceptors (Singh et al., 2014). A substantial increase of Y(NA) was observed in the flag leaves of drought stressed Cappelle Desprez cv. (Fig. 8C), which correlates with the lower CO2 uptake rate of these leaves, that creates a
et al., 2013). Y(NA) of Cappelle Desprez cv. was greater than Y(ND) at PPFDs <250µmole photons m−2s−1, while, above this level, Y(NA) decreased and Y(ND) of drought-stressed
Plainsman V increased. Higher effective quantum yield of PSI, Y(I) was observed for drought-stressed Cappelle Desprez cv. in both biomass accumulation as well as grain filling period in comparison to plants of all other treatment conditions (Figs. 8A–8D).
DISCUSSION
In the present work we have analyzed the biomass and grain yield accumulation under conditions of drought stress in two model wheat cultivars, Cappelle Desprez and Plainsman V, which are classified in the literature as drought sensitive and tolerant varieties, respectively (Guóth et al., 2009) (http://genbank.vurv.cz/wheat/pedigree) in parallel with the photosynthetic responses of their primary (flag) and secondary leaves. The results obtained from phenotyping for biomass accumulation and grain yield appear to be surprising in the first sight since our findings represent an interesting situation in which green biomass accumulation and grain production respond differentially to water scarcity in different wheat cultivars. Although the ‘‘drought sensitive’’ Cappelle Desprez keeps higher biomass yield than the ‘‘drought tolerant’’ Plainsman V, the latter variety is able to maintain higher absolute grain yield and grain yield stability than the former one under conditions of water limitation. Therefore, one of the important messages of our work is that phenotyping based only on shoot/leaf area (green biomass) can be largely misleading for drawing predictions about grain yield potential under drought, and possibly under other stress conditions.
Similarly to biomass accumulation the water status of the plants also shows differential response to water scarcity. Although both the Cappelle Desprez and Plainsman V cultivars showed similar and rapid initial loss of water from the soil in pots and the water potential in penultimate leaves was significantly decreased in both genotypes during drought stress the extent of reduction of soil water was predominant in the drought sensitive Cappelle Desprez cv. (Guóth et al., 2009). It has also been reported that the relative water content of the flag leaves in the Cappelle Desprez cultivar was decreased significantly during drought stress while in Plainsman V it was not much affected (Fábián et al., 2011;Jäger et al., 2014).
The ultimate source of biomass accumulation is CO2 fixed by the photosynthetic
apparatus in the form of organic substances. Grain production, which is a specific form of biomass accumulation is driven mostly by the photosynthetic activity of the primary (flag) leaves in wheat plants. The higher CO2uptake rate in the flag leaves of the drought stressed
Plainsman V as compared to that of the Cappelle Desprez cv. correlates well with the higher grain yield of the Plainsman V cv. Interestingly, our data also show that the extent of drought induced decrease in CO2accumulation rate was less pronounced for the Cappelle
Desprez than for the Plainsman V in the secondary leaves (Fig. 2A), which agrees with the larger green biomass accumulation in the Cappelle Desprez variety. These data together show a differential role of the primary and secondary leaves in biomass accumulation in the form of grains and shoots/leaves, respectively.
stomatal closure through which the amount of water loss via evaporation can be decreased. On the other hand, drought induced closing of stomata limits also CO2uptake; therefore,
it decreases the efficiency of net photosynthesis. Since the extent of decreasing the transpiration rate is usually higher than the decrease of net photosynthesis the water-use efficiency (WUE) increases, and the plants conserve water and increase their chances for survival. This typical response can be observed both in the secondary and flag leaves of the Cappelle Desprez cv. (Fig. 2D). The higher WUE values of Cappelle Desprez correlate with its efficiency for delaying senescence (Erdei et al., 2005;Hafsi, Akhter & Monneveux, 2007).
As the drought progresses, the leaf temperature of Cappelle Desprez cv. becomes similar to ambient temperature reflecting stomatal closure. On the contrary, Plainsman V shows prolonged transpiration through flag leaves and spikes during severe drought, which is evident from the cooler than ambient leaf temperatures (Figs. 3Cand3D). This physiological response might be supporting drought tolerant Plainsman V. to regulate the sink region for higher grain yield stability under severe drought.
It is a highly important question: which parameters of photosynthetic electron transport could give information on the tolerance or resistance of the studied varieties to drought stress? According to our data, theFV/FM ratio did not give information about the extent
of resistance (Fig. 5) in agreement with previous literature findings (Lu & Zhang, 1999). However, we could find other deduced variable Chl fluorescence parameters, which are useful for the indication of drought tolerance. Especially the performance index (PI) (Zivcak et al., 2008), Area, RC/ABS and the drought factor index (DFI) parameters developed by Strasser and coworkers (Oukarroum et al., 2007) have proven to be useful indicators of the ability of wheat plants to tolerate the consequences of drought conditions.
The variable Chl fluorescence and P700 kinetics also give valuable information about the effect of drought stress on structural and functional changes of the photosynthetic apparatus. We could observe faster J-I rise in Chl fluorescence transients and faster P700 re-reduction kinetics, which supports the idea that the PSI content is reduced in drought stressed Plainsman V plants in agreement with previous literature data (Joliot & Joliot, 2002;Yan et al., 2013).
Kinetically, the I-P phase has been shown to correlate with PSI activity and changes in the I-P amplitude can be used as semi quantitative indicators for (relative) changes in the PSI content of the leaf (Ceppi et al., 2012). In drought-stressed Cappelle Desprez cv. we could find a consistent high I-P rise phase and low P700+accumulation from the 3rd week
of drought stress in secondary leaves to the end of 4th week in flag leaves (Figs. 4B–4D). This effect could be due to enhanced cyclic electron flow around PSI, which is an important defense mechanism against drought and other abiotic stress factors (Joliot & Joliot, 2002;
Kono, Noguchi & Terashima, 2014), as a result of a transient block of electron transfer at the electron acceptor side of PSI under a high [NADPH]/ [NADP+] ratio (Hamdani
et al., 2015).
the third week (21st–28th day of drought) enhancement of cyclic electron flow through ETR(I) in Cappelle Desprez and losing of ETR(I) in Plainsman V occurred during both biomass accumulation and grain filling period, (Figs. 7B–7D).
Concluding remarks
Non-invasive photosynthetic measurements provide highly useful tools for making reliable predictions of physiological traits of wheat and other plants. Our findings demonstrate that the agronomically highly important traits of biomass and grain yield are not necessarily correlated in wheat and possibly in other cereal crops. Therefore, phenotyping of biomass responses alone is not sufficient for predictions of grain yield changes. As a consequence, phenotyping protocols should include grain yield assessment when the aim is the optimization of grain yield and grain yield stability under stress conditions.
Our results support the importance of cyclic electron flow in drought stress tolerance. We can also conclude that changes in physiological parameters show different responses to drought stress depending on the developmental stage of leaves in the case of the studied two cultivars. Flag leaves, which serve as grain supporting leaves show similar response in their CO2 fixation, drought factor index, and electron transport parameters as the
grain yield, whereas the secondary leaves, which support overall green biomass growth show similar responses as biomass accumulation. These findings are warranted by the presented results for the Cappele Deprez and Plainsman V cultivars studied here. However, the general validity of the differential response of physiological parameters in leaves of different developmental stages has to be investigated by using several wheat cultivars in future studies.
ACKNOWLEDGEMENTS
The authors are thankful for useful discussions with Prof. Giles Johnson (University of Manchester, UK), Dr. Andrew French (University of Nottingham, UK), Dr. Gert Schansker and Dr. Kovacs Laszlo (BRC-HAS).
ADDITIONAL INFORMATION AND DECLARATIONS
Funding
This work was supported by the European Plant Phenotyping Network (EPPN grant agreement no. 284443). The funders had no role in study design, data collection and analysis, decision to publish, or preparation of the manuscript.
Grant Disclosures
The following grant information was disclosed by the authors: European Plant Phenotyping Network (EPPN): 284443.
Competing Interests
Author Contributions
• Kenny Paul performed the experiments, analyzed the data, contributed
reagents/mate-rials/analysis tools, wrote the paper, prepared figures and/or tables.
• János Pauk conceived and designed the experiments, reviewed drafts of the paper.
• Zsuzsanna Deák performed the experiments, analyzed the data, prepared figures and/or
tables.
• László Sass analyzed the data, contributed reagents/materials/analysis tools.
• Imre Vass conceived and designed the experiments, wrote the paper, reviewed drafts of the paper.
Data Availability
The following information was supplied regarding data availability: The raw data set is uploaded asData S1.
Supplemental Information
Supplemental information for this article can be found online athttp://dx.doi.org/10.7717/ peerj.1708#supplemental-information.
REFERENCES
Berger B, Parent B, Tester M. 2010.High-throughput shoot imaging to study drought responses.Journal of Experimental Botany61:3519–3528DOI 10.1093/jxb/erq201.
Bilger W, Bjorkman O. 1990.Role of the xanthophyll cycle in photoprotection elu-cidated by measurements of light-induced absorbance changes, fluorescence and photosynthesis in leaves ofHedera canariensis.Photosynthesis Research25:173–185 DOI 10.1007/BF00033159.
Björkman O, Demmig B. 1987.Photon yield of O2evolution and chlorophyll
fluo-rescence characteristics at 77 K among vascular plants of diverse origins.Planta
170:489–504DOI 10.1007/BF00402983.
Boyer JS, Westgate ME. 2004.Grain yields with limited water.Journal of Experimental Botany55:2385–2394DOI 10.1093/jxb/erh219.
Campos H, Trejo C, Peña-Valdivia CB, García-Nava R, Conde-Martínez FV, Cruz-Ortega MR. 2014.Photosynthetic acclimation to drought stress inAgave salmiana Otto ex Salm-Dyck seedlings is largely dependent on thermal dissipation and enhanced electron flux to photosystem I.Photosynthesis Research122:23–39 DOI 10.1007/s11120-014-0008-6.
Ceppi MG, Oukarroum A, Çiçek N, Strasser RJ, Schansker G. 2012.The IP am-plitude of the fluorescence rise OJIP is sensitive to changes in the photosystem I content of leaves: a study on plants exposed to magnesium and sulfate de-ficiencies, drought stress and salt stress.Physiologia Plantarum144:277–288 DOI 10.1111/j.1399-3054.2011.01549.x.
between recorded traits and allelic variants of some stress genes.Australian Journal of Crop Science7:1560–1570.
Cuellar-Ortiz SM, De La Paz Arrieta-Montiel M, Acosta-Gallegos J, Covarru-bias AA. 2008.Relationship between carbohydrate partitioning and drought resistance in common bean.Plant, Cell and Environment 31:1399–1409 DOI 10.1111/j.1365-3040.2008.01853.x.
Dhondt S, Wuyts N, Inzé D. 2013.Cell to whole-plant phenotyping: the best is yet to come.Trends in Plant Science18:428–439DOI 10.1016/j.tplants.2013.04.008.
Erdei N, Barta C, Hideg É, Böddi B. 2005.Light-induced wilting and its molecular mechanism in epicotyls of dark-germinated pea (Pisum sativumL.) seedlings.Plant and Cell Physiology 46:185–191DOI 10.1093/pcp/pci012.
Fábián A, Jäger K, Rakszegi M, Barnabás B. 2011.Embryo and endosperm development in wheat (Triticum aestivumL.) kernels subjected to drought stress.Plant Cell Reports
30:551–563DOI 10.1007/s00299-010-0966-x.
Fan D-Y. 2007.Quantification of cyclic electron flow around Photosystem I in spinach leaves during photosynthetic induction.Photosynthesis Research94:347–357 DOI 10.1007/s11120-006-9127-z.
Farquhar GD, Richards RA. 1984.Isotopic composition of plant carbon correlates with water-use efficiency of wheat genotypes.Australian Journal of Plant Physiology
11:539–552DOI 10.1071/PP9840539.
Fehér-Juhász E, Majer P, Sass L, Lantos C, Csiszár J, Turóczy Z, Mihály R, Mai A, Horváth GV, Vass I, Dudits D, Pauk J. 2014.Phenotyping shows improved physi-ological traits and seed yield of transgenic wheat plants expressing the alfalfa aldose reductase under permanent drought stress.Acta Physiologiae Plantarum36:663–673 DOI 10.1007/s11738-013-1445-0.
Genty B, Briantais J-M, Baker NR. 1989.The relationship between the quantum yield of photosynthetic electron transport and quenching of chlorophyll fluorescence. Biochimica et Biophysica Acta990:87–92DOI 10.1016/S0304-4165(89)80016-9.
Golding AJ, Johnson GN. 2003.Down-regulation of linear and activation of cyclic elec-tron transport during drought.Planta218:107–114DOI 10.1007/s00425-003-1077-5.
Golzarian MR, Frick RA, Rajendran K, Berger B, Roy S, Tester M, Lun DS. 2011.
Accurate inference of shoot biomass from high-throughput images of cereal plants. Plant Methods7:2DOI 10.1186/1746-4811-7-2.
Guóth A, Tari I, Gallé Á, Csiszár J, Pécsváradi A, Erdei L. 2009.Comparison of the drought stress responses of tolerant and sensitive wheat cultivars during grain filling: changes in flag leaf photosynthetic activity, ABA levels, and grain yield.Journal of Plant Growth Regulation28:167–176DOI 10.1007/s00344-009-9085-8.
Hafsi M, Akhter J, Monneveux J. 2007.Leaf senescence and carbon isotope discrimina-tion in durum wheat (Triticum durum Desf.) under severe drought conditions.Cereal Res. Commun.35:71–80DOI 10.1556/CRC.35.2007.1.9.
chlorophyllafluorescence induction.Journal of Plant Physiology177:128–138 DOI 10.1016/j.jplph.2014.12.019.
Harb A, Krishnan A, Ambavaram MMR, Pereira A. 2010.Molecular and physiological analysis of drought stress inArabidopsisreveals early responses leading to acclima-tion in plant growth.Plant Physiology154:1254–1271DOI 10.1104/pp.110.161752.
Ingram J, Bartels D. 1996.The molecular basis of dehydration tolerance in plants. Annual Review of Plant Physiology and Plant Molecular Biology47:377–403 DOI 10.1146/annurev.arplant.47.1.377.
Jäger K, Fábián A, Eitel G, Szabó L, Deák C, Barnabás B, Papp I. 2014.A morpho-physiological approach differentiates bread wheat cultivars of contrasting tol-erance under cyclic water stress.Journal of Plant Physiology171:1256–1266 DOI 10.1016/j.jplph.2014.04.013.
Johnson GN. 2011.Physiology of PSI cyclic electron transport in higher plants. Biochim-ica et BiophysBiochim-ica Acta1807:384–389DOI 10.1016/j.bbabio.2010.11.009.
Joliot P, Joliot A. 2002.Cyclic electron transfer in plant leaf.Proceedings of the National Academy of Sciences of the United States of America99:10209–10214 DOI 10.1073/pnas.102306999.
Kana R, Vass I. 2008.Thermoimaging as a tool for studying light-induced heating of leaves. Correlation of heat dissipation with the efficiency of photosystem II pho-tochemistry and non-photochemical quenching.Environmental and Experimental Botany64:90–96DOI 10.1016/j.envexpbot.2008.02.006.
Kenny P, Deák Z, Csõsz M, Purnhauser L, Vass I. 2011.Characterization and early detection of tan spot disease in wheatin vivochlorophyll fluorescence imaging.Acta Biologica Szegediensis55:87–90.
Klughammer C, Schreiber U. 1994.An improved method, using saturating light pulses, for the determination of photosystem I quantum yield via P700+-absorbance
changes at 830 nm.Planta192:261–268DOI 10.1007/BF01089043.
Kono M, Noguchi K, Terashima I. 2014.Roles of the cyclic electron flow around PSI (CEF-PSI) and O2-dependent alternative pathways in regulation of the
photosyn-thetic electron flow in short-term fluctuating light inArabidopsis thaliana.Plant and Cell Physiology 55:990–1004DOI 10.1093/pcp/pcu033.
Laisk A, Oja V, Eichelmann H. 2008.Alternative and cyclic electron flow: rate and role in potato leaves. In: Allen JF, Gantt JH, Golbeck JH, Osmond B, eds.Photosynthesis. Energy from the Sun: 14th international congress on photosynthesis. New York: Springer, 913–916.
Levitt J. 1980.Responses of plants to environmental stresses. Water, radiation, salt and other stresses. New York: Academic Press, 93–128.
Lovelli S, Perniola M, Ferrara A, Di Tommaso T. 2007.Yield response factor to water (Ky) and water use efficiency ofCarthamus tinctoriusL. andSolanum melongenaL. Agricultural Water Management 92:73–80DOI 10.1016/j.agwat.2007.05.005.
Marcelis LFM, Heuvelink E, Baan Hofman-Eijer LR, Den Bakker J, Xue LB. 2004.
Flower and fruit abortion in sweet pepper in relation to source and sink strength. Journal of Experimental Botany55:2261–2268DOI 10.1093/jxb/erh245.
Miyake C, Miyata M, Shinzaki Y, Tomizawa K-I. 2005.CO2response of cyclic electron
flow around PSI (CEF-PSI) in tobacco leaves-relative electron fluxes through PSI and PSII determine the magnitude of non-photochemical quenching (NPQ) of Chl fluorescence.Plant and Cell Physiology 64:629–637.
Oukarroum A, Madidi SE, Schansker G, Strasser RJ. 2007.Probing the responses of barley cultivars (Hordeum vulgareL.) by chlorophyll a fluorescence OLKJIP under drought stress and re-watering.Environmental and Experimental Botany60:438–446 DOI 10.1016/j.envexpbot.2007.01.002.
Price AH, Cairns JE, Horton P, Jones HG, Griffiths H. 2002.Linking drought-resistance mehcanisms to drought avoidance in upland rice using a QTL approach: progress and new opportunities to integrate stomatal and mesophyll responses.Journal of Experimental Botany53:989–1004DOI 10.1093/jexbot/53.371.989.
Schansker G, Tóth SZ, Strasser RJ. 2005.Methylviologen and dibromothymoquinone treatments of pea leaves reveal the role of photosystem I in the Chlafluorescence rise OJIP.Biochimica et Biophysica Acta1706:250–261DOI 10.1016/j.bbabio.2004.11.006.
Schreiber U. 2004. Pulse-Amplitude-Modulation (PAM) fluorometry and saturation pulse method: an overview. In:Chlorophyll a fluorescence, vol. 19. New York: Springer, 279–319.
Secenji M, Hideg É, Bebes A, Györgyey J. 2010.Transcriptional differences in gene families of the ascorbate–glutathione cycle in wheat during mild water deficit.Plant Cell Reports29:37–50DOI 10.1007/s00299-009-0796-x.
Singh R, Naskar J, Pathre UV, Shirke PA. 2014.Reflectance and cyclic electron flow as an indicator of drought stress in cotton (Gossypium hirsutum).Photochemistry and Photobiology90:544–551DOI 10.1111/php.12213.
Strasser RJ, Srivastava A, Tsimilli-Michael M. 2000. The fluorescence transient as a tool to characterize and screen photosynthetic samples. In: Yunus M, Pathre UV, eds. Probing photosynthesis: mechanisms regulation and adaptation. New York: Taylor & Francis, 443–480.
Strasser RJ, Tsimilli-Michael M, Srivastava A. 2004. Analysis of the chlorophylla fluorescence transient. In: Papageogriou GC, Govindjee, eds.Chlorophyll fluorescence: a signature of photosynthesis. Springer, 321–362.
Strauss AJ, Krüger GHJ, Strasser RJ, Van Herdeen PDR. 2006.Ranking of dark chilling tolerance in soybean genotypes probed by the chlorophylla fluores-cence transient O-J-I-P.Environmental and Experimental Botany56:147–157 DOI 10.1016/j.envexpbot.2005.01.011.
stress in transgenicSolanum tuberosumL. plants.PLoS ONE10:e0132683 DOI 10.1371/journal.pone.0132683.
Tsimilli-Michael M, Strasser RJ. 2008. In vivoassessment of stress impact on plant’s vitality: applications in detecting and evaluating the beneficial role of mycorrhization on host plants. Mycorrhiza. In:State of the art, genetics and molecular biology, eco-function, biotechnology, eco-physiology, structure and systematics. Berlin Heidelberg: Springer, 679–703.
Yan K, Shao H, Shao C, Zhao S, Brestic M. 2013.Dissection of photosynthetic elec-tron transport process in sweet sorghum under heat stress.PLoS ONE8:e62100 DOI 10.1371/journal.pone.0062100.
Yancey PH, Clark ME, Hand SC, Bowlus RD, Somero GN. 1982.Living with water stress: evolution of osmolyte systems.Science217:1214–1222
DOI 10.1126/science.7112124.
Zivcak M, Brestic M, Balatova Z, Drevenakova P, Olsovska K, Kalaji HM, Yang X, Allakhverdiev SI. 2013.Photosynthetic electron transport and specific photo-protective responses in wheat leaves under drought stress.Photosynthesis Research
117:529–546DOI 10.1007/s11120-013-9885-3.
Zivcak M, Brestic M, Olsovska K, Slamka P. 2008.Performance index as a sensitive indi-cator of water stress inTriticum aestivumL.Plant Soil and Environment54:133–139.
Zivcak M, Kalaji HM, Shao H-B, Olsovska K, Brestic M. 2014.Photosynthetic pro-ton and electron transport in wheat leaves under prolonged moderate drought stress.Journal of Photochemistry and Photobiology. B, Biology 137:107–115 DOI 10.1016/j.jphotobiol.2014.01.007.
Zulfugarov IS, Mishra SR, Lee C-H. 2010.Quantitative analysis of cyclic electron flow in rice plants (Oryza sativa L.) lacking PsbS protein of Photosystem II.Proceedings of ANAS (Biological Sciences)65:90–95.