45 http://biology.num.edu.mn
http://mjbs.100zero.org/ Volume 12(1-2), 2014
Mongolian Journal of Biological
Sciences
ISSN 2225-4994 (online edition)
MJBS
Original Ar• cle
http://dx.doi.org/10.22353/mjbs.2014.12.05
Evaluating the Quality of Protected Areas for Species: A
Case Study in Ikh Nart Nature Reserve, Mongolia
James D. Murdoch
1*, Hannah Davie
2, Myagmarjav Lkhagvasuren
1and Tserendorj
Munkhzul
31University of Vermont, Rubenstein School of Environment and Natural Resources, Wildlife and Fisheries
Biology Program, George D. Aiken Center, Burlington, Vermont 05405, USA, Tel: +1 (802) 656-2912, Fax: +1 (802) 656-8683
2Nottingham Trent University, School of Animal, Rural and Environmental Sciences, Brackenhurst Campus,
Southwell NG25 0QF, UK
3Mongolian Academy of Sciences, Institute of Biology, Mammalian Ecology Laboratory, Ulaanbaatar,
Mongolia
Abstract
Key words: agama, distribution, habitat quality, Ikh Nart Nature Reserve, occupancy modeling, protected area, red fox
Article information: Received 26 Aug. 2014 Accepted: 16 Mar. 2015 Published: 15 Apr. 2015
Correspondence*: [email protected]
Cite this paper as:
Species’ distributions refl ect the quality of landscape conditions, and represent an important component of protected area management. However, distributions are diffi cult to estimate, and consequently, often determined through a combination of limited fi eld data and expert opinion, which may lead to biases. We demonstrate the use of occupancy models to map distributions and estimate landscape quality. We used occupancy models for two species, the red fox and toad-headed agama, to map their distributions in Ikh Nart Nature Reserve located in southeastern Mongolia. We then used occupancy probability as a measure of quality and tested whether differences existed in quality between three areas: 1) inside the reserve, 2) inside the reserve’s core protected area, and 3) outside the reserve, using 30 sample sites in each. Occupancy probability varied from 0.084 to 0.997 for red foxes and 0.022 to 0.949 for agamas in maps. Landscape quality was highest in the core area and lowest outside the reserve for red foxes, and highest outside the reserve and lowest in the core area for agamas. Our results provide visual depictions of distributions across the Ikh Nart landscape and a means of assessing the quality of the Ikh Nart protected area that may inform management activities.
Murdoch, J. D., Davie, H., Lkhagvasuren, M. & Munkhzul, T. 2014. Evaluating the quality of protected areas for species: a case study in Ikh Nart Nature Reserve, Mongolia. Mong. J. Biol. Sci., 12(1-2): 45-51.
Introduction
Mongolia has an extensive protected area system that includes nearly 100 areas covering approximately 27 million hectares or 17% of the country, which refl ects a national commitment to conservation. Protected areas in Mongolia have several goals, one of which is to protect individual species. Some protected areas have even been created primarily for this purpose. For example, the Ikh Nart Nature Reserve in
Przewalski’s horse, Equus ferus przewalskii, and Tost Mountains Local Protected Area and snow leopard, Panthera uncia).
One of the greatest challenges to managing these species and others is the lack of scientifi c information on their distributions in protected areas and across the broader landscape (Clark
et al., 2006). Most estimates of distribution have been based on a combination of some fi eld observation data (if available) and expert opinion (Clark et al., 2006). However, science-based representations of species distributions are few, which hinder the ability of managers to precisely depict distributions within protected areas and assess the relative quality of different parts of the landscape.
Several approaches exist to model species-habitat relationships, which can be used to estimate distributions across broad areas (Boyce & McDonald, 1999; Franklin, 2009). One approach is occupancy modeling (MacKenzie et al., 2002). This approach involves using detection/non-detection data from surveys, such as point counts for birds or camera traps for carnivores, to develop a model that describes occupancy probability at any given site in a landscape. The approach estimates occupancy probability using the multinomial maximum likelihood function and offers several useful advantages to wildlife managers. First, it relies on survey data that generally requires little advanced training to collect. Second, it accounts for detection probability when estimating occupancy probability, which is especially important given that non-detected species may actually be present at a site. Lastly, it allows for managers to build and compare models (using model selection techniques) that include the effects of covariates on occupancy such as habitat types or other landscape characteristics.
Occupancy models can be applied at a landscape scale to map distribution, which provide visual tools that can aid in decision-making about species. However, occupancy models have been relatively underused in mapping distributions and evaluating species in Mongolia despite their advantages.
In this paper, we demonstrate the utility of occupancy models by using them to map distribution. We then propose an approach for assessing the quality of protected areas for particular species using an occupancy map. The approach involves sampling occupancy as a
measure of quality inside and outside of protected areas. We present a case study that focuses on the red fox (Vulpes vulpes) and toad-headed agama (Phrynocephalus versicolor) – two species for which occupancy models exist, in Ikh Nart Nature Reserve. Our objectives were to map the distributions of these two species and test for differences in quality between three areas: 1) inside the reserve, 2) inside the reserve’s core protected area, and 3) outside the reserve in the surrounding landscape.
Materials and Methods
Study area
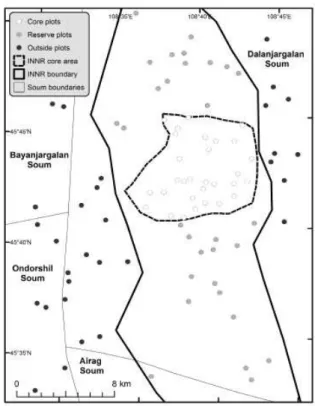
Ikh Nart Nature Reserve occurs in Dornogobi
aimag and overlaps parts of two soums
(districts), Dalanjargalan and Airag (Fig. 1; 45043´N–108039´E) (Reading et al., 2011). The
reserve covers 666 km2 and was established in
1996 to protect a population of argali sheep and the unique landscape of the region. The reserve
is situated at the confl uence of steppe and semi-desert ecozones (Murzaev, 1948), and includes gently rolling plains and rugged rocky areas separated by narrow valleys. Among the main habitat types include grasslands (dominated by needlegrass, Achnatherum splendens), shrublands (dominated by peashrub, Caragana pygmaea, and wild apricot, Amygdalus penduculata), open plains (dominated by various forbs and semi-shrubs), and sparsely vegetated rocky outcrops (Jackson et al., 2006). Trees such as Siberian elm (Ulmus pumila) and willow (Salix leucurus) occur in some drainages, but represent a rare cover type. The area surrounding the reserve includes a similar mix of habitats, with the exception of rocky outcrops, which are confi ned mostly to the reserve. The region is arid, typically receiving <200 mm of precipitation per year, and temperatures are highly variable, often ranging from -400 C in winter to
+400 C in summer (Jackson et al., 2006). Wildlife
in the region includes at least 33 mammal, 125 bird, and 6 reptile species (Murdoch et al., 2006; Reading et al., 2011).
Ikh Nart is designated as a ‘nature reserve’ and is managed primarily by the local soum governments with some oversight by the aimag. Management activities focus mainly on protecting argali sheep. Long-term monitoring of the argali population led to the development of a ‘core protected area’ that covers 71 km2 within the Ikh
Nart boundary (Fig. 1). This core area is thought to be important for the argali population and a center of biodiversity. It receives a higher level of protection from the reserve’s ranger corp relative to other parts of the reserve.
Occupancy models
We demonstrate the utility of occupancy models using two species, the red fox and toad-headed agama. These two species occur widely throughout the Ikh Nart region and much of Mongolia and exhibit very different life history patterns (Heptner & Naumov, 1998; Clark et al., 2006; Terbish et al., 2006). Red foxes have been described to occur in all major ecozones in Mongolia (Mallon, 1985; Clark et al., 2006). However, radio-telemetry and observation data suggest that red foxes select some habitats more frequently than expected suggesting that the species is not uniformally distributed across the country (Murdoch, 2009; Munkhzul et al., 2012). In Ikh Nart, red foxes seem to favor more rugged,
rocky terrain and the species is hunted intensively during the winter months (Murdoch et al., 2007; Murdoch et al., 2010a). Toad-headed agamas represent perhaps the most widely distributed reptile in Mongolia and can reach densities that exceed 100 individuals/ha (Rogovin et al., 2001; Murdoch et al., 2010b). Agamas tend to occur in more open, steppe terrain, and are a commonly encountered species in Ikh Nart.
Occupancy models have been developed for both species (see: Murdoch et al., 2013; Murdoch et al., 2014). Each model estimates Ψ or occupancy probability as a function of covariates. Below are the models:
Red fox Ψ = βint + βrocky (% rocky outcrop in 250 m) + βshrub (% shrubland in 250 m)
where, βint = -2.392 βrocky = 0.093 βshrub = 0.034
Toad-headed agama Ψ = βint + βrocky (proportion rocky outcrop in 250 m)
where, βint = 2.927 βrocky = -7.679
The red fox model indicates that occupancy probability is a function of the percent of rocky outcrop and shrubland within 250 m of a given site in the landscape. If these two variables are estimated, then occupancy can be calculated. For example, if a site is surrounded by 20% rocky outcrop and 15% shrubland, then these two values would be multiplied by their respective coeffi cients or betas (βrocky = 0.093 and βshrub = 0.034) and added to the intercept value (βint = -2.932). The logit link function can then be used to estimate a probability from the model:
Logit link = exp(model)/(1+exp(model))
Red fox Ψ = exp(-2.392+0.093*20+0.034*15)/ (1+exp(-2.392+0.093*20+0.034*15))
Red fox Ψ = 0.49, indicating that there is a 49% chance of red fox occurring at that given location in the landscape.
habitat within 250 m of a given site. Similarly, if the proportion of rocky outcrop at a site can be estimated, then this value would be entered into the occupancy model and the logit link function used to calculate occupancy probability.
Occupancy mapping
We used each model to develop an occupancy probability map for each species across the northern part of Ikh Nart Nature Reserve and surrounding area (Fig. 1). For each species, we applied the model to each pixel (30 m x 30 m) in a habitat map of the region (total map area = 702 km2 enclosed by N45.838943°- N45.545245°;
E108.489732°- E108.731806°). This habitat map was built from a supervised classifi cation of a Landsat 7ETM+ satellite image (for classifi cation details, see: Jackson et al., 2006; habitat maps are available from the authors). We used GIS software (ArcGIS, ESRI, Redlands, California, USA) to estimate the amount of each covariate (rocky and shrubland) with a 250 m buffer around each pixel, then entered each value into the occupancy model equation and calculated occupancy probability using the logit function for each pixel. We did this for each species, then color ramped the maps to visually depict occupancy across the landscape.
Evaluating quality
We evaluated the quality of the landscape for each species in three areas: 1) inside the reserve, 2) inside the reserve’s core protected area, and 3) nearby areas outside of Ikh Nart reserve. We reasoned that occupancy would be a function of quality and thus used it as a measure of quality. We selected 30 random 250 m radius plots in each area type (N = 90 total plots). For each plot, we then summed the occupancy values of all pixels beneath that plot. To test for statistical differences between area types, we used a Kruskal-Wallis (non-parametric) Analysis of Variance on plot data. We evaluated the data for normality and considered tests signifi cant when P < 0.05.
Results
We developed an occupancy probability map for each species (Fig. 2). Occupancy probability varied from 0.084 to 0.997 in the red fox map and 0.022 to 0.949 in the agama map (Fig. 2). Survey plot values in the red fox map varied from 0.19 to 0.89 in the reserve (mean = 0.47 ± 0.05 SE),
0.18 to 0.94 in the core area (mean = 0.61 ± 0.04 SE), and 0.11 to 0.98 in areas outside the reserve (mean = 0.45 ± 0.03 SE). Plot values differed signifi cantly between area types, with occupancy highest in the core area and lowest outside the reserve (Kruskal-Wallis: H = 4.52, DF = 2, P = 0.014). Plot values in the agama map varied from 0.31 to 0.95 in the reserve (mean = 0.85 ± 0.04 SE), 0.31 to 0.95 in the core area (mean = 0.73 ± 0.04 SE), and 0.19 to 0.95 in areas outside the reserve (mean = 0.90 ± 0.02 SE). Plot values differed signifi cantly between area types, with occupancy highest outside the reserve and lowest inside the core area (Kruskal-Wallis: H = 25.33,
DF = 2, P < 0.001).
Discussion
Species management often relies on information about distribution patterns. However, distributions can be diffi cult to precisely defi ne, especially across a large landscape, and are often estimated from a combination of fi eld observations and expert opinion (Clark et al., 2006; Terbish et al., 2006). These two sources of information may induce a substantial amount of bias. For example, fi eld observations are often not collected systematically and may exclude areas where a species occurs (Anderson, 2001). Observations also tend to represent ‘presence-only’ data and do not account for variation in detection probability in a landscape (MacKenzie
et al., 2002). Similarly, expert opinion is a function of the experience of ‘experts’ and their ability to reliably depict distribution, which may be affected by a range of subjective and psychological biases (Martin et al., 2012). These biases and others can be overcome by developing a model that relates a species to the conditions of the landscape. Several modeling approaches exist, including occupancy modeling, which uses the multinomial maximum likelihood function to estimate the probability of a species occurring at a given site in the landscape (MacKenzie et al., 2002).
based on basic data collected from surveys and assessing the quality of different parts of the landscape.
We used two pre-existing occupancy models and applied them on a pixel by pixel basis to a landcover map using GIS (Murdoch et al., 2013; Murdoch et al., 2014). The results revealed very different patterns of distribution between the two focal species, which refl ect the components (or β coeffi cients and covariates) of each model. Agamas occur widely throughout the region with the exception of rocky areas, which negatively
infl uence occupancy (Murdoch et al., 2013). Red foxes also range widely across the region and occupancy is positively infl uenced by the amount of habitats that provide cover including rocky areas and shrublands (Murdoch et al., 2014).
We assumed that occupancy probability is related to habitat quality in the landscape. In other words, the higher the probability of occurrence for a species, the higher the quality of
landscape conditions, and conversely, the lower the probability of occurrence for a species, the lower the quality of the landscape conditions. Assuming a functional relationship exists between occupancy and quality, our analysis indicated that Ikh Nart Nature Reserve provides higher quality conditions for red foxes than the surrounding areas outside of the reserve. Similarly, the core protected area in the reserve had higher quality than the marginal areas of reserve. This probably refl ects the relatively high amount of rocky landcover in the reserve and particularly within the core area. For agamas, we found a different pattern. Areas outside of Ikh Nart had higher quality than areas within the reserve or core protected area due to the lower amount of rocky landcover.
Our results provide tools and information that may be helpful to wildlife managers in Ikh Nart. First, our maps provide visual depictions of distribution over a large landscape. These depictions are easy to interpret and may inform Figure 2. Map of (A) red fox (Vulpes vulpes) and (B) toad-headed agama (Phrynocephalus versicolor) probability of occurrence in Ikh Nart Nature Reserve (INNR), Mongolia and the surrounding area. We developed
each map by applying an occupancy model for each species to each pixel (30 m x 30 m) of a habitat map. Probability values calculated using the logit link function and occupancy models are from Murdoch et al. (2013,
management activities. For example, red foxes are intensively hunted (illegally) in the reserve during the winter (Murdoch et al., 2010a), and the distribution map shows areas where foxes are most likely to be found. Managers may then choose to focus their patrols on these areas during the hunting season. Second, they also provide a science-based measure of the quality of the protected area for each species, which may inform how habitats are managed. For example, red fox occupancy is partly a function of the amount of shrubland at a site. Managers could thus simulate changes in the amount of shrubland in the base map (perhaps through different regimes of grazing management), then assess how distribution changes in response. This may be particularly important as the species is thought to be declining in Mongolia and listed as an IUCN Near Threatened species at a country-level (Clark et al., 2006). Similarly, other landscape changes such as those that may result from climate change could also be simulated to assess species’ responses.
Few occupancy models have been developed for species in Mongolia, but we suggest that they are important tools for managing species and we recommend their development. Occupancy models generally rely on detection/non-detection data from multiple surveys of sites in a landscape (MacKenzie & Royle, 2005). Although survey data are often collected by monitoring projects, one challenge to developing occupancy models is that they often require a fairly large amount of survey sites and detections, which is not realistic for some species (e.g., those that are
rare or diffi cult to reliably detect or that range over very large areas). However, occupancy models can be developed from ‘presence-only’ data. MaxLike is an R-package that will do just that given a set of presence data (like observations) and a base habitat map (Royle
et al., 2012). Occupancy models may also be extended to incorporate expert opinion (Low Choy et al., 2009; Murray et al., 2009). In this approach, opinion about the distribution of a species would be considered prior knowledge that would be used to update the probability values generated by a model using a Bayesian framework. In Ikh Nart, expert opinion could be solicited from managers, researchers, and herders, and potentially strengthen depictions of species distributions and inferences about landscape quality.
Acknowledgements
We thank the University of Vermont, Denver Zoo – Mongolia Program, and Mongolian Academy of Sciences for supporting the project. We also thank G. Wingard, T. Selenge, C. McCulloch, G. Munkhchuluun, S. Batdorj, R. Reading, and G. Otgonbayar for their help with fi eldwork and data collection, and I. Barcelo and anonymous reviewers for their comments on the manuscript. M. Lkhagvasuren was supported by a Fulbright Scholarship during this project.
References
Anderson, D. R. 2001. The need to get the basics right in wildlife fi eld studies. Wildlife Society Bulletin, 29: 1294-1297.
Boyce, M. S. & McDonald, L. L. 1999. Relating populations to habitats using resource selection functions. Trends in Ecology and Evolution, 14: 268-272.
Clark, E. L., Munkhbat, J., Dulamtseren, S., Baillie, J. E. M., Batsaikhan, N., Samiya, R. & Stubbe, M. 2006. Mongolian Red List of Mammals. Regional Red List Series, Zoological Society of London, London, United Kingdom.
Franklin, J. 2009. Mapping species distributions spatial inference and prediction. Cambridge University Press, New York, USA.
Heptner, V. G. & Naumov, N. P. 1998. Mammals of the Soviet Union, vol. 2 part 1A. E.J. Brill, New York, USA.
Jackson, D., Murdoch, J. D. & Mandakh, B. 2006. Habitat classifi cation using Landsat 7ETM+ imagery of the Ikh Nart Nature Reserve and surrounding areas in Dornogobi and Dundgobi Aimags, Mongolia. Mongolian Journal of Biological Sciences, 4: 33-40.
Low Choy, S., O’Leary, R. & Mengersen, K. 2009. Elicitation by design in ecology: using expert opinion to inform priors for Bayesian statistical models. Ecology, 90: 265-277. MacKenzie, D. I., Nichols, J. D., Lachman, G.
B., Droege, S., Royle, J. A. & Langtimm, C. A. 2002. Estimating site occupancy rates when detection probabilities are less than one.
Ecology, 83: 2248-2255.
Mallon, D. P. 1985. The mammals of the Mongolian People’s Republic. Mammal Review, 15: 71-102.
Martin, T. G., Burgman, M. A., Fidler, F., Kuhnert, P. M., Low Choy, S., McBride, M. & Mengersen, K. 2012. Eliciting expert knowledge in conservation science. Conservation Biology, 26: 29-38.
Munkhzul, T., Buuveibaatar, B., Murdoch, J. D., Reading, R. P. & Samiya, R. 2012. Factors affecting home ranges of red foxes in Ikh Nart Nature Reserve, Mongolia. Mongolian Journal of Biological Sciences, 10: 51-58.
Murdoch, J. D. 2009. Competition and niche separation between corsac and red foxes in Mongolia. DPhil. dissertation, University of Oxford, Oxford, United Kingdom.
Murdoch, J. D., Davie, H., Galbadrah, M. & Reading, R. P. 2014. Factors infl uencing red fox occupancy in central Mongolia. Mamma-lian Biology, http://dx.doi.org/10.1016/j.mam-bio.2014.12.001.
Murdoch, J. D., Davie, H., Munkhchuluun, G., Donovan, T. & Reading, R. P. 2013. Do Siberian marmots infl uence toad-headed agama occupancy? Examining the infl uence of marmot colonies and three steppe habitats in Mongolia. Journal of Arid Environments, 92: 76-80.
Murdoch, J. D., Munkhzul, T., Amgalanbaatar, S. & Reading, R. P. 2006. Checklist of mammals in Ikh Nart Nature Reserve. Mongolian Journal of Biological Sciences, 4: 69-74.
Murdoch, J. D., Munkhzul, T., Buyandelger, S. & Reading, R. P. 2007. Biotope of corsac fox and red fox in Ikh Nart Nature Reserve. Mongolian Journal of Biological Sciences, 5: 7-12. Murdoch, J. D., Munkhzul, T., Buyandelger, S. &
Sillero-Zubiri, C. 2010a. Survival and cause-specifi c mortality of corsac and red foxes in Mongolia. Journal of Wildlife Management, 74: 59-64.
Murdoch, J. D., Suuri, B. & Reading, R. P. 2010b. Estimates of toad headed agama density in three steppe habitats of Mongolia. Erforschung Biologischer Ressourcen der Mongolei, 11: 383-389.
Murray, J. V., Goldizen, A. W., O’Leary, R. A., McAlpine, C. A., Possingham, H. P. & Choy, S. L. 2009. How useful is expert opinion for predicting the distribution of a species within and beyond the region of expertise? A case study using brush-tailed rock-wallabies Petrogale penicillata. Journal of Applied Ecology, 46: 842-851.
Murzaev, E. M. 1948. The MPR: A Physio-Geographical Description. Academy of Sciences USSR, Moscow, Russia.
Myagmarsuren, D. 2000. Special Protected Areas of Mongolia. Mongolian Environmental Protection Agency and GTZ (German Technical Advisory Agency), Ulaanbaatar, Mongolia.
Reading, R. P., Kenny, D. & Steinhauer-Burkart, B. 2011. Ikh Nart Nature Reserve, 2nd edition. ECO Nature Edition Steinhauer-Burkart OHG, Oberaula, Germany.
Rogovin, K. A., Semenov, D. V. & Shenbrot, G. I. 2001. Lizards of the northern Mongolian deserts: densities and community structure. Asiatic Herpetological Research, 9: 1-9. Royle, J. A., Chandler, R. B., Yackulic, C. &
Nichols, J. D. 2012. Likelihood analysis of species occurrence probability from presence-only data for modelling species distributions. Methods in Ecology and Evolution, 3: 545-554.
Terbish, K., Munkhbayar, K., Clark, E. L., Munkhbat, J., Monks, E. M., Munkhbaatar, M., Baillie, J. E. M., Borking, L., Batsaikhan, N., Samiya, R. & Semenov, D. V. 2006. Mongolian Red List of Reptiles and Amphibians. Zoological Society of London, London, United Kingdom.