ACPD
9, 4971–5008, 2009UV single-scattering albedos during
MILAGRO
C. A. Corr et al.
Title Page
Abstract Introduction
Conclusions References
Tables Figures
◭ ◮
◭ ◮
Back Close
Full Screen / Esc
Printer-friendly Version
Interactive Discussion
Atmos. Chem. Phys. Discuss., 9, 4971–5008, 2009 www.atmos-chem-phys-discuss.net/9/4971/2009/ © Author(s) 2009. This work is distributed under the Creative Commons Attribution 3.0 License.
Atmospheric Chemistry and Physics Discussions
This discussion paper is/has been under review for the journalAtmospheric Chemistry and Physics (ACP). Please refer to the corresponding final paper inACPif available.
Retrieval of aerosol single scattering
albedo at ultraviolet wavelengths at the T1
site during MILAGRO
C. A. Corr1,*, N. Krotkov2, S. Madronich3, J. R. Slusser4, B. Holben5, W. Gao4, J. Flynn6, B. Lefer5, and S. M. Kreidenweis1
1
Dept. of Atmospheric Sciences, Colorado State Univ., Fort Collins, CO, USA
2
Goddard Earth Sciences and Technology Center, Univ. of Maryland Baltimore County, MD, USA
3
Atmospheric Chemistry Division, National Center for Atmospheric Research, Boulder, CO, USA
4
The USDA UV-B Monitoring and Research Program, Natural Resource Ecology Lab., Colorado State Univ., Fort Collins, CO, USA
5
Biospheric Sciences Branch, NASA’s Goddard Space Flight Center, Greenbelt, MD, USA
6
Dept. of Earth and Atmospheric Sciences, Univ. of Houston, Houston, TX, USA
*
now at: Climate Change Research Center, Inst. for the Study of Earth, Oceans, and Space, Univ. of New Hampshire, Durham, NH, USA
Received: 8 January 2009 – Accepted: 8 January 2009 – Published: 25 February 2009
Correspondence to: C. A. Corr (ccorr@cisunix.unh.edu)
ACPD
9, 4971–5008, 2009UV single-scattering albedos during
MILAGRO
C. A. Corr et al.
Title Page
Abstract Introduction
Conclusions References
Tables Figures
◭ ◮
◭ ◮
Back Close
Full Screen / Esc
Printer-friendly Version
Interactive Discussion
Abstract
Surface measurements of direct and diffuse voltages at UV wavelengths were made at the T1 site during the MILAGRO (Megacity Initiative: Local and Global Research Observations) field campaign in March 2006, using a multifilter rotating shadowband radiometer (UV-MFRSR). We used the MFRSR data, together with measurements from
5
a co-located CIMEL Sun photometer at the site operating as part of the AERONET network, to deduce aerosol single scattering albedo (ω) at 368 and 332 nm for four cloud-free days during the study. Our retrievals suggest that T1 aerosols with aerosol extinction optical depthτ368>0.1 that are influenced by Mexico City emissions, blowing
dust, and biomass burning, are characterized by lowω368=0.73–0.85 andω332=0.70–
10
0.86, with small or no spectral variation of ωbetween 368 and 332 nm. Our findings are consistent with other published estimates ofωfor Mexico City aerosols, including those that suggest that the absorption attributable to these aerosols is enhanced at UV wavelengths relative to visible wavelengths. We also demonstrate, via sensitivity tests, the importance of accurateτand surface albedo measurements inωretrievals at UV
15
wavelengths.
1 Introduction
Although ultraviolet (UV) radiation only comprises a small fraction (<10%) of the total radiation reaching Earth’s surface, and is therefore frequently ignored in climate mod-eling, it has profound impacts on human and ecosystem health. Prolonged exposure to
20
UV-A (315 nm<λ<400 nm) and UV-B (280 nm<λ<315 nm) radiation has been shown to result in negative health effects such as sun burn (erythema), DNA damage, cataracts, and suppression of the immune systems in humans, and has been linked epidemio-logically to skin cancer incidence (Diffey, 1991; Longstreth et al., 1998). Similarly, DNA damage in terrestrial plants has been found with exposure to UV radiation, ultimately
25
ACPD
9, 4971–5008, 2009UV single-scattering albedos during
MILAGRO
C. A. Corr et al.
Title Page
Abstract Introduction
Conclusions References
Tables Figures
◭ ◮
◭ ◮
Back Close
Full Screen / Esc
Printer-friendly Version
Interactive Discussion
1993). UV radiation is also the primary driver of photochemical processes in the tropo-sphere. Atmospheric oxidant species (e.g., the hydroxyl radical (OH), peroxy radicals (H2O2, RO2) and chlorine radicals) are formed when precursor species undergo
pho-tolysis reactions, primarily in the UV range reaching the surface (300 nm<λ<400 nm). For example, nitrogen dioxide (NO2) is efficiently photolyzed by UV-A radiation to form
5
ground-state oxygen (O(3P)) which in the atmosphere rapidly reacts with O2 to form
O3. Other molecules whose UV photolysis is important in the troposphere include O3,
hydrogen peroxide (H2O2), nitrous acid (HONO), formaldehyde (CH2O), and various other oxygenated organic compounds.
Modeling studies have suggested that scattering and absorption by aerosols can
10
cause changes to the surface UV radiation field on the order of those caused by the thinning stratospheric ozone layer, but opposite in sign (Liu et al., 1991; Elminir, 2007; Reuder and Schwander, 1999; Krotkov et al., 1998). These aerosol perturbations to the UV radiation field can lead to substantial changes in tropospheric photolysis reac-tions and ozone photochemistry. These changes are complex and depend on altitude,
15
chemical regime, and the relative extent of aerosol scattering or absorption. Highly ab-sorbing aerosols tend to reduce photolytic radiation, particularly near the surface, while scattering aerosols can increase the radiation throughout the boundary layer and at higher altitudes above the bulk of the aerosol. The photochemical production of ozone depends on the square root of photolysis rates at low NOx and linearly at high NOx
20
(e.g. Kleinman, 2005), so that the aerosol-induced UV perturbations have important implications for the production of urban and regional oxidants. Dickerson et al. (1997) showed that non-absorbing sulfate aerosols cause an increase in regional O3 in the
Eastern US, by as much as 10–20 ppb, simply because they increase the UV radiation field. He and Carmichael (1999) also indicated that a moderate loading of scattering
25
ACPD
9, 4971–5008, 2009UV single-scattering albedos during
MILAGRO
C. A. Corr et al.
Title Page
Abstract Introduction
Conclusions References
Tables Figures
◭ ◮
◭ ◮
Back Close
Full Screen / Esc
Printer-friendly Version
Interactive Discussion
a reduction of O3formation by about 50 ppb.
Several parameters that describe the interaction between radiation and aerosols of particular interest to this work are single scattering albedo, aerosol optical depth, and asymmetry parameter. The single scattering albedo at a wavelengthλ,ωλ, describes the contribution of particle scattering relative to total extinction by particles (absorption
5
plus scattering):
ωλ = bsca,pλ
bext,pλ
(1)
wherebsca,p is the aerosol scattering coefficient andbext,p is the sum of the aerosol
scattering and absorption (babs,p) coefficients:
bext,p =bsca,p+babs,p. (2)
10
Aerosol optical depth (τλ) is the height-integrated extinction coefficient as computed
from
τλ =
Zz2
z1
bext,pλd z (3)
wherez1andz2represent the vertical bounds of an atmospheric layer. The total optical depth,τT OT,λ, includes contributions to extinction from gases as well as from particles.
15
The asymmetry parameter,g, is the phase function-weighted average of the cosine of the scattering angle over all directions. Assuming azimuthal symmetry, the scattering angle integration extends from−πto+π:
g= 1
2
Zπ
−π
cosθP(θ) sinθ d θ (4)
whereθis the scattering angle andP(θ) is the phase function. Values forgrange from
20
ACPD
9, 4971–5008, 2009UV single-scattering albedos during
MILAGRO
C. A. Corr et al.
Title Page
Abstract Introduction
Conclusions References
Tables Figures
◭ ◮
◭ ◮
Back Close
Full Screen / Esc
Printer-friendly Version
Interactive Discussion
Several methods for the determination of aerosol optical properties in the visible spectral range using measurements of sun and sky radiances by Sun photometers and radiometers have been implemented. For example, Dubovik et al. (2002) demonstrated the retrieval of aerosol optical and microphysical properties using inversion techniques applied to observations ofτand the angular distribution of sky radiances at visible and
5
near-infrared wavelengths, and Kassianov et al. (2005) proposed a method for retrieval of aerosol optical properties at visible wavelengths using measured direct and diffuse irradiances. Compared to the visible range, however, use of such methods for the de-termination of aerosol optical properties in the UV are more difficult, due to enhanced molecular (Rayleigh) scattering and interference from gaseous absorption (NO2, O3,
10
SO2) (Krotkov et al., 2005c). Additional challenges to the retrieval ofω at UV wave-lengths include poorly-characterized surface albedos, which affect the sky radiances and irradiances, and stricter instrumental requirements, including small signal to noise ratio of measurements, stray light effects, filter stability, and wavelength calibration.
Despite these difficulties, several estimates of aerosol ω at UV wavelengths have
15
been reported, as shown in Table 1. The retrievals are based on fitting measured di-rect and diffuse irradiances and their ratios (DDR) using a radiative transfer (RT) mod-els with different a priori assumptions as indicated in Table 1. Assuming that aerosol optical depth, τ, and the asymmetry factor, g, are known from co-located measure-ments, the direct ω retrieval is possible using single wavelength measurements as
20
outlined in detail by Wenny et al. (1998) and Petters et al. (2003). Additional required RT model input parameters are ozone column, Rayleigh optical depth, and optical depth of absorbing gases including NO2, the ground albedo at the wavelength of in-terestaλ, and solar zenith angle (SZA). Petters et al. (2003) assumed fixed values for
all of these parameters exceptω, and iteratively determined the best-fitωby varying
25
ACPD
9, 4971–5008, 2009UV single-scattering albedos during
MILAGRO
C. A. Corr et al.
Title Page
Abstract Introduction
Conclusions References
Tables Figures
◭ ◮
◭ ◮
Back Close
Full Screen / Esc
Printer-friendly Version
Interactive Discussion
the Mie extinction calculation until values ofg andωwere obtained that yielded mod-eled DDR in agreement with measurements. Krotkov et al. (2005a, b) applied the same methodology as in Wenny et al. (1998), except they added a recalibration of theτand DDR measurements using separate, co-located AERONET Sun photometer measure-ments, as described below, and inputs of size distributions and real refractive indices
5
retrieved from AERONET inversions of Sun-sky almucantar measurements at visible wavelengths. We note that more recently, Goering et al. (2005), Taylor et al. (2008) and Kudo et al. (2008) have proposed optimal estimation techniques for the simultaneous retrieval of spectral aerosol optical properties by combining measurements at several wavelengths; although a priori constraints are also needed in those schemes, they are
10
applied differently than in the single wavelength methods focused on here.
In this work, we present estimates of aerosol single-scattering albedoωat two inde-pendently retrieved UV wavelengths, 332 and 368 nm, for a site just north of the Mexico City basin. Our estimates use measurements of DDR at UV wavelengths made at the T1 site as part of the Megacity Initiative: Local and Global Research Objectives
(MI-15
LAGRO) field campaign conducted in and around Mexico City, Mexico in March 2006. The MILAGRO campaign included a suite of gas-phase and aerosol-phase measure-ments on a number of measurement platforms including ground-based and aircraft. Instruments were located at three main ground-based sites, with the T1 site chosen to be representative of regions influenced by a mixture of fresh and aged pollutants
20
exiting the greater Mexico City metropolitan area (Fast et al., 2007). Although the selection of the month of March for the MILAGRO study was based in part on the expectation of relatively low fire activity, as compared with later in the spring, observa-tions showed significant fire activity and analyses suggested that the MILAGRO sites were impacted by biomass burning emissions (e.g., Moffet et al., 2008; Yokelson et al.,
25
ACPD
9, 4971–5008, 2009UV single-scattering albedos during
MILAGRO
C. A. Corr et al.
Title Page
Abstract Introduction
Conclusions References
Tables Figures
◭ ◮
◭ ◮
Back Close
Full Screen / Esc
Printer-friendly Version
Interactive Discussion
the entire field campaign. The data were measured every 20 s and are archived at http://uvb.nrel.colostate.edu/. A CIMEL Sun photometer also collected τ and aerosol inversion data at T1 as part of the AERONET network. Raw τ data are available at approximately 15 min resolution at http://aeronet.gsfc.nasa.gov.
2 Retrieval techniques
5
As done in the prior studies summarized in Table 1, the retrieval of aerosol optical prop-erties is accomplished by fitting modeled DDR to the observations. The Tropospheric Ultraviolet model (TUV) version 4.4 was used for all radiative transfer calculations (Madronich and Flocke, 1999; http://cprm.acd.ucar.edu/Models/TUV/). As explained by Petters et al. (2003), the TUV4.4 output of direct horizontal irradiance normalized to
10
extraterrestrial solar irradiance was divided by the cosine of SZA, to match the output of the UV-MFRSR, which archives the direct normal voltage. The DDR is then com-puted from the measurements as the ratio of the direct normal voltage to the diffuse horizontal voltage and compared to the ratio of the similar solar normalized irradiances from the model. Values of DDR were calculated using the 4-stream discrete ordinate
15
solver, using over 80 equally-spaced vertical layers, for the two longest UV-MFRSR spectral channels centered at 368 nm and 332 nm. The default vertical aerosol profile in TUV4.4 used to scale the inputτ is the continental aerosol profile reported by Elter-man et al. (1969) with a scale (e-folding) height of about 4 km. TUV inputs of latitude and longitude, SZA, climatological column NO2, and surface pressure for the T1 site
20
were obtained from the AERONET database (http://aeronet.gsfc.nasa.gov). Ozone column data were obtained from the Ozone Monitoring Instrument (OMI) on board the NASA Aura satellite.
The remaining required TUV inputs for each wavelength are τ, g, ω, and surface albedo. The measurements, used to determine bothτand DDR, were obtained using
25
ACPD
9, 4971–5008, 2009UV single-scattering albedos during
MILAGRO
C. A. Corr et al.
Title Page
Abstract Introduction
Conclusions References
Tables Figures
◭ ◮
◭ ◮
Back Close
Full Screen / Esc
Printer-friendly Version
Interactive Discussion
305, 311, 317, 325, 332, and 368 nm with nominal 2 nm resolution (full width at half maximum, FWHM). Total horizontal voltages are measured when the shadowband is at rest to the side of the diffuser and diffuse horizontal voltages are measured with the shadowband completely shadowing the diffuser. Diffuse horizontal voltages are corrected for excess sky blocking internally using additional blocking measurements
5
at 9◦ off to each side of the direct-sun shadowband position (Harrison et al., 1994). The subtraction of the corrected diffuse horizontal voltages from the total horizontal voltages yields direct horizontal voltages that are converted to direct normal voltages using laboratory measured angular response functions.
The raw voltage signals (mV) measured by UV-MFRSR are first corrected for
non-10
cosine angular response and dark current and then converted to dimensionless trans-mittance values using channel-specific calibration coefficients, V0,λ (mV). V0,λ values
are determined using either an on-site Langley regression method (Harrison and Michalsky, 1994; Slusser et al., 2000) or using calibration transfer from a co-located AERONET Sun photometer (Krotkov et al., 2005a), and the equation:
15
lnVλ=lnVo,λ−mτT OT (5)
whereVλ is the measured direct normal voltage and mis the air mass factor (secant of the solar zenith angle, SZA). The on-site Langley method assumes constant total optical depth τT OT, and extrapolates via a linear regression between m and lnVλ to
zero airmass (m=0) to estimateV0,λ as the intercept value (Bigelow et al., 1998). The
20
same calibration constant can be used for both the diffuse and direct measurements. The main difficulty of the local Langley calibration method is that at most sites, τT OT
does not remain constant during the calibration period (typically a few morning hours), which results in significant errors in the estimatedV0,λ. To smooth out these errors, a statistical regression is fit to the dailyV0,λvalues to determine smoothed<V0,λ>values,
25
representative of degradation of the throughput of the instrument, that are later used to solve Eq. (5) forτT OT for each individual UV-MFRSR measurement:
τT OT =
1
ACPD
9, 4971–5008, 2009UV single-scattering albedos during
MILAGRO
C. A. Corr et al.
Title Page
Abstract Introduction
Conclusions References
Tables Figures
◭ ◮
◭ ◮
Back Close
Full Screen / Esc
Printer-friendly Version
Interactive Discussion
Subtracting Rayleigh and gaseous optical thicknesses fromτT OT yields aerosol optical depth,τ.
The statistical method (Eq. 6) works best for relatively cloud free and pollution free locations, where atmospheric stability requirements are frequently met. However, in polluted locations, the data available to estimate<V0,λ>may be sparse because of few
5
clear-sky measurements. Further, it has been shown that the UV-MFRSR instrument can experience rapid and non-monotonic throughput changes due to diffuser soiling and self-cleaning (after rain events) (Krotkov et al., 2005a), so that the accuracy of the on-site statistical Langley technique is not always sufficient for aerosol retrieval appli-cations (Michalsky et al., 2001). An independent check on the validity of the derived
10
V0,λ can be made using co-located, well-calibrated AERONET data, as explained in
detail below. AERONET sites are equipped with the CIMEL Electronique 318A, an automatic sun-tracking and sky scanning filter radiometer, and undergo standardized calibration procedures (Holben et al., 1998). The instrument has two detectors for the measurement of Sun/aureole and sky radiances. Eight ion-assisted deposition
inter-15
ference filters yield direct-Sun radiance measurements at 340 nm, 380 nm, 440 nm, 500 nm, 670 nm, 870 nm, 940 nm, and 1020 nm with band passes (FWHM) of 2 nm for the 340 nm channel, 4 nm for the 380 nm channel, and 10 nm for all visible wavelength channels (Holben et al., 2001). The CIMEL makes additional almucantar sky radiance measurements at 440 nm, 670 nm, 870 nm, and 1020 nm during each measurement
20
sequence that are inverted together with direct sun data to estimate particle size dis-tributions and refractive indices (real and imaginary parts) in the visible wavelengths (Dubovik and King, 2000; Dubovik et al., 2000).
In our study values of V0,λ at 332 and 368 nm were obtained by combining
UV-MFRSR direct voltages with AERONET τ values, satellite ozone values and
clima-25
ACPD
9, 4971–5008, 2009UV single-scattering albedos during
MILAGRO
C. A. Corr et al.
Title Page
Abstract Introduction
Conclusions References
Tables Figures
◭ ◮
◭ ◮
Back Close
Full Screen / Esc
Printer-friendly Version
Interactive Discussion
andτ332, along with appropriate values of Rayleigh, NO2 and O3 optical thicknesses calculated from the AERONET surface pressure and gaseous column concentration data, were used in Eq. (5) to determineV0,λfor each individual (20 s) UV-MFRSR
mea-surement. If all measurements are consistent,V0,λshould remain constant during the day regardless of any changes in atmospheric transmittance and/or solar elevation and
5
azimuth. Therefore, examining diurnal trends in raw UVMRPV0,λdata provides insight
into possible systematic calibration errors and yields a tool for screening non-consistent and/or outlier measurements in an iterative procedure.
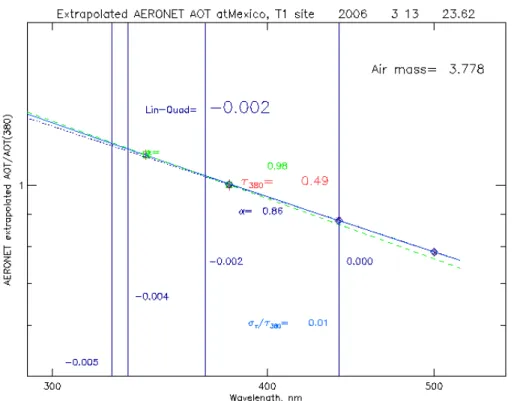
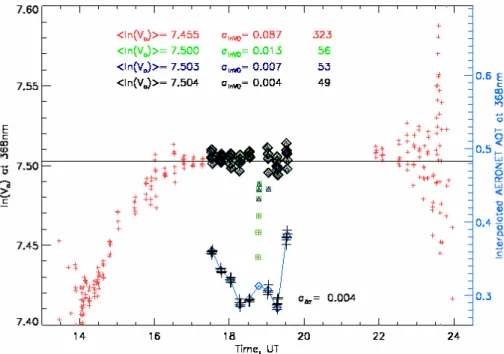
Figure 2 demonstrates the iterative screening process used to find suitable time pe-riods and corresponding mean daily<V0,λ>, as applied to the determination of V0,368
10
on 12 March. We initially screened the UV-MFRSR data to select only points within 1 min of AERONETτretrievals, resulting in an initial set of 323 UV-MFRSR measure-ments for this day. Measuremeasure-ments in early morning (before 14:00 UT, where local time
=UT−6) and evening (after 22:00 UT) were rejected because of increased noise due to low signal level. Late morningV0,368 data (14:00 UT–16:00 UT), although less noisy,
15
exhibited a systematic increase with SZA and were rejected for that reason. During the noon period (17:00 UT–20:00 UT),V0,368remained reasonably constant (standard deviation ∼1%) and these data were used for calculating mean daily <V0,368> to
re-duce random noise in individual measurements. The noise was further rere-duced (by a factor of 3) by removing outlier measurements (those with ln(V0,368) outside of±2σ of
20
the ln<V0,368>) and iteratively re-calculating <V0,368>. The final ln<V0,368>was used
in Eq. (6) to calculate UV-MFRSR τ368 that agree with AERONET-interpolated τ368
within an rms difference of ∼0.004 for the selected time interval (i.e., between 17:00 and 20:00 UT). The<V0,368>was also used to normalize diffuse and total UV-MFRSR
cosine corrected voltages to obtain corresponding dimensionless transmittances. The
25
ACPD
9, 4971–5008, 2009UV single-scattering albedos during
MILAGRO
C. A. Corr et al.
Title Page
Abstract Introduction
Conclusions References
Tables Figures
◭ ◮
◭ ◮
Back Close
Full Screen / Esc
Printer-friendly Version
Interactive Discussion
We obtained estimates of ω368 and ω332 using two approaches: the Krotkov et
al. (2005a, b) methodology (hereafter called theKrotkov method), and a modified ver-sion of the Petters et al. (2003) technique (hereafter referred to as this work). The two approaches differ in the assumptions used to determine a key input for TUV4.4, the asymmetry parameter,g. Inthis work, rather than assuming a fixed climatological
5
or measured value forg, we ran multiple simulations for a range of g values applica-ble to the expected aerosol types. To determine an appropriate range in g, we used data from an AERONET site that has been located in Mexico City (19.33◦N, 99.18◦W, 2268 m) since March 1999. We downloaded all valid Version 2 retrievals for March dates in all available years (1999–2008) and computed a median g440 of 0.68; 96%
10
of the values were between 0.6 and 0.75. These historical data agreed well with the Level 1.5, Version 2 AERONET almucantar retrievals reported for the T1 site for March 2006: median g440, 0.68; min, 0.63; max, 0.74. We note that for small particles, g
is expected to increase at UV wavelengths. Accordingly, Barnard et al. (2008) esti-matedg300=0.76–0.77 andg500=0.70–0.72 for Mexico City aerosol for five days in the
15
MCMA-2003 field campaign. We thus chose 0.6≤g≤0.75 as the input range of g332
andg368, and computed all pairs of gandωthat yielded modeled DDR in agreement with (within 1% relative error) the measurements. In theKrotkov method, the values of g and ωare determined from a separate Mie calculation. The method requires suc-cessful AERONET almucantar retrievals near the time periods of interest in order to
20
initialize the size distribution and real refractive index,n, in the Mie code. The shortest wavelength at whichnis retrieved is 440 nm, and this value was assumed to apply also at 368 and 332 nm. The imaginary part of the refractive index at each wavelength was then varied iteratively, until thegandωcomputed from the Mie code yielded a modeled DDR in agreement with the UV-MFRSR observations.
25
dif-ACPD
9, 4971–5008, 2009UV single-scattering albedos during
MILAGRO
C. A. Corr et al.
Title Page
Abstract Introduction
Conclusions References
Tables Figures
◭ ◮
◭ ◮
Back Close
Full Screen / Esc
Printer-friendly Version
Interactive Discussion
fuse radiation to aerosols, leading to an overestimation ofωif the aerosol optical depth is specified independently (e.g., from direct sun AERONET data, as done here). We show retrievals for two assumptions: a spectrally flat surface albedo of 0.06 consistent with the surface albedo of urban surfaces (Castro et al., 2000), and a spectrally-varying surface albedo, estimated from measurements during MILAGRO from aircraft-based
5
radiometers. Surface albedo measurements by Coddington et al. (2008) from the J-31 aircraft spanned the wavelength range 350–2000 nm; although reported measure-ments in the UV range are sparse, they show values of 0.07–0.08 at 385 nm with a systematic decrease towards lower wavelengths. Madronich et al. (2007) compared spectral actinic fluxes measured at the T1 surface site with upwelling spectral actinic
10
fluxes measured from T1 overpasses by the C-130 aircraft, and found that a spectrally dependent surface albedo was required over the wavelength range 300–420 nm, to explain the wavelength variation of the actinic flux under both clean and polluted con-ditions. This wavelength-dependent surface albedo was approximated by Madronich et al. (2007) with a linear interpolation between a value of 0.02 at 320 nm and 0.10 at
15
400 nm. We slightly revised this estimate here to a linear variation between 0.015 at 320 nm and 0.085 at 400 nm, based on the lower values for 385 nm reported by Cod-dington et al. (2008). Interpolation then yields surface albedos of 0.025 at 332 nm and 0.057 at 368 nm. While this difference of 0.032 albedo units may seem small, it will be shown below that it has a significant influence on the spectral dependence of retrieved
20
ω.
3 Results and discussion
Although AERONET and UVMRP data are available for most of the days in March 2006, our screening procedures have limited retrievals to days with valid cloud-screened AERONET almucantar (Version 2) retrievals, needed to initialize the size distributions in
25
ACPD
9, 4971–5008, 2009UV single-scattering albedos during
MILAGRO
C. A. Corr et al.
Title Page
Abstract Introduction
Conclusions References
Tables Figures
◭ ◮
◭ ◮
Back Close
Full Screen / Esc
Printer-friendly Version
Interactive Discussion
aerosol optical depths are most accurate at SZA smaller than 70◦, due to increases in angular response errors at larger SZA (Krotkov et al., 2005a). This limitation is more severe at the surface elevation of Mexico City than at sea level, because of the relatively larger importance of the direct solar beam.
The cloud-free periods that we chose corresponded to 19◦<SZA<53◦, and thus the
5
retrieved size distributions and real refractive indices used to initialize the Krotkov method were mostly determined for times before or after ourωretrieval periods. The relationship betweenτ,ω, and DDR is shown in Fig. 3. As τ decreases, particularly forτ<0.2, DDR becomes increasingly less sensitive to values ofωand the best-fitωis not sufficiently constrained. Thus, we limited retrievals to periods withτ368>0.1,
recog-10
nizing that large uncertainties may be associated for cases whenτ368<0.2. Applying
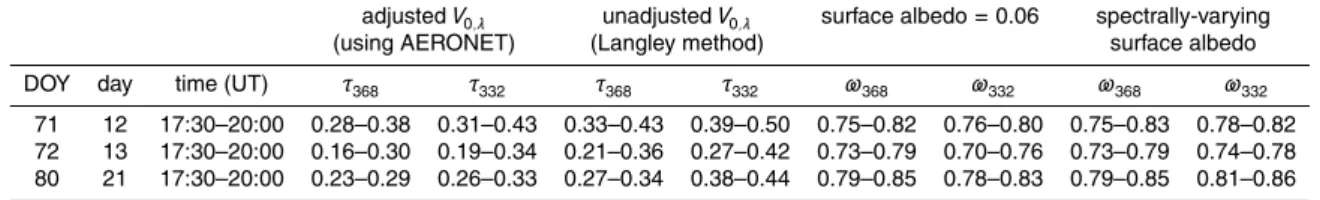
all of these screening criteria, the final dataset for which we will report ω retrievals was limited to relatively short near-noon periods on 12, 13, and 21 March 2006, as summarized in Table 2. An additional retrieval was performed for 19 March 2006 us-ingτ368 and τ332 determined using AERONET non-cloud screened Level 1.0 τ data.
15
As discussed further below, we determined that the AERONET cloud-screening algo-rithm used to create Level 1.5 and Level 2.0 datasets also removed cloud-free periods heavily influenced by dust.
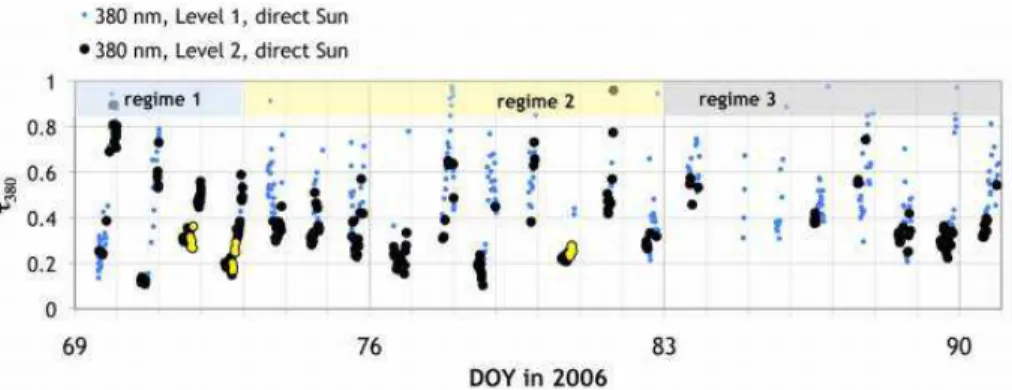
Timelines for 10 March (DOY 69) through 31 March (DOY 90) ofτ380 obtained at T1 from AERONET Version 2 direct Sun inversions, Levels 1.0 and 2.0 quality screened,
20
are shown in Fig. 4, with the periods for whichωretrievals were conducted highlighted. The time periods of the three meteorological regimes defined for the MILAGRO study by Fast et al. (2007) are also indicated. During regime 1, early in the month, mostly sunny and dry conditions prevailed, leading to elevated dust concentrations in addition to smoke aerosols from numerous fires. The passage of a cold surge on 14 March
25
ACPD
9, 4971–5008, 2009UV single-scattering albedos during
MILAGRO
C. A. Corr et al.
Title Page
Abstract Introduction
Conclusions References
Tables Figures
◭ ◮
◭ ◮
Back Close
Full Screen / Esc
Printer-friendly Version
Interactive Discussion
measured at T1 and confirms that our four selected days had low overall fractional cloudiness and extended periods of cloud-free conditions, as required for our retrieval methods. Fast et al. (2007) estimate that transport from Mexico City to the T1 site was likely on three of the days we selected for analysis, 12, 19 and 21 March. The relatively low optical depths in the morning on 19 March (Fig. 7) are consistent with
5
the detailed meteorological analyses of deFoy et al. (2008), who noted that persistent southerly winds aloft contributed to very clean air on this day. The timeline of daily afternoon CO concentrations simulated for the T1 site that is presented in Fig. 19 of Fast et al. (2007), when compared with Fig. 4, demonstrates a general correspondence between elevated (CO) and elevatedτ368.
10
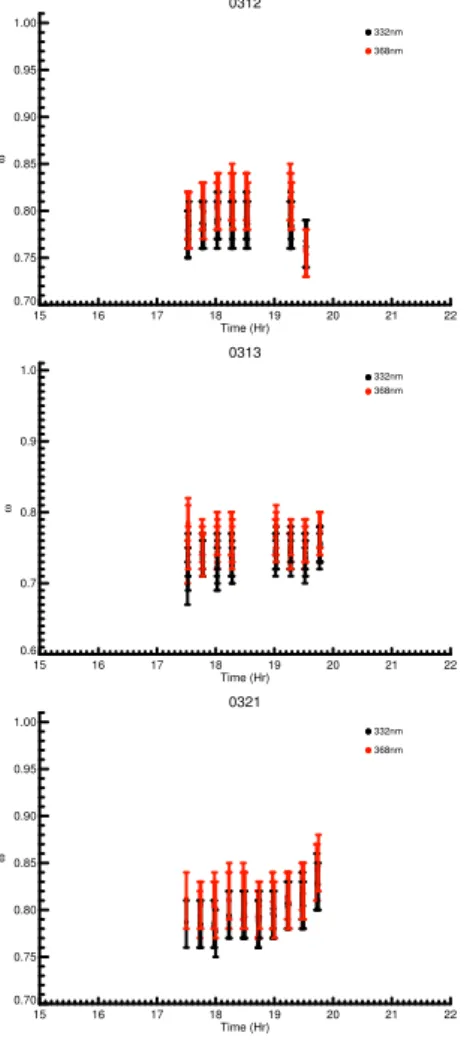
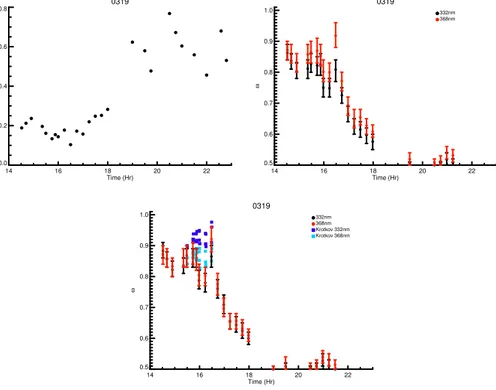
Figure 5 presents the retrieved ranges of ω368 and ω332 obtained in this work for 12, 13, and 21 March, assuming a spectrally flat surface albedo of 0.06. The points represent the average of all possibleω368 and ω332 values for g ranging from 0.6 to
0.75, which we refer to as the range-averaged ωvalues. Estimated range-averaged ω368 andω332were lowest on 13 March, a day that was estimated to be least directly
15
influenced by transport from Mexico City, with values remaining below 0.80 for the retrieval period. Range-averagedω368andω332were highest on 21 March, with values ranging from 0.79 to 0.85 forω368and from 0.78 to 0.83 forω332.
Retrieval results for 19 March for this work are shown in Fig. 6, with retrievals us-ing theKrotkov method overplotted. The latter method has fewer valid points because
20
a stable <V0>could be obtained for only a short morning time period. Most striking
is the substantial decreases in bothω368 and ω332 between approximately 15:30 and
21:00 UT, corresponding to increases in τ (Fig. 6). Examination of ancillary data, in-cluding images from the Aqua and Terra satellite (250 m resolution) and images from an upward-pointing all-sky camera, showed cloud-free skies. However, airborne dust
25
was clearly visible in the all-sky images and in photographs of the surrounding area. Higher wind speeds were observed (5–10 m s−1, compared to 1–5 m s−1 on 12, 13, and 21 March), and filter samples from T1 had elevated concentrations of PM2.5 Ca
2+
ACPD
9, 4971–5008, 2009UV single-scattering albedos during
MILAGRO
C. A. Corr et al.
Title Page
Abstract Introduction
Conclusions References
Tables Figures
◭ ◮
◭ ◮
Back Close
Full Screen / Esc
Printer-friendly Version
Interactive Discussion
are consistent with those of Querol et al. (2008) who reported large campaign mean concentrations of coarse mode material (PM10) at the T1 suggesting elevated
concen-trations of dust at the measurement site compared to surrounding areas. Increases in dust concentrations were attributed to dust resuspension events during times of mod-erate to high wind speeds at the measurement site due to the T1 site’s proximity to a
5
cement plant and limestone quarry (Querol et al., 2008).
Several studies have observed stronger absorption of UV radiation than visible radi-ation by mineral dust (Bergstrom et al., 2004; Sokolik and Toon, 1999; Weaver et al., 2002; Wetzel et al., 2003). Thus, the decreases inω368 andω332 over this 7-hour
pe-riod on 19 March may be representative of enhanced UV absorption by dust particles
10
passing over the site. However, errors in UV-MFRSR measurements are enhanced un-der high optical depth, dusty conditions. The empirical diffuse aureole correction uses sky brightness at 9◦ from the Sun as a proxy for the aureole (Harrison at al., 1994). This proxy is an underestimation in general, but more so for dusty conditions, because larger particles, such as dust, preferentially forward scatter (larger g). The MFRSR
15
diffuse voltage underestimation results in an overestimation of the MFRSR direct volt-age, and thus an overestimation of the DDR. In our retrieval method, the overestimated DDR leads directly to underestimatedω. Further, the values ofgassumed for our re-trievals may be too low for the dusty conditions. Finally, we had difficulty obtaining stableV0,λduring most of this day, another indication that the standard MFRSR voltage
20
corrections are not adequate. We conclude that evidence points to a change to a dust-dominated aerosol type during 19 March, with the late morning and afternoon aerosol having a lower ω than the aerosol observed on the other days, but the appropriate values ofω368andω332 cannot be established with confidence.
A few estimates of ω for Mexico City aerosols have been published to which our
25
ACPD
9, 4971–5008, 2009UV single-scattering albedos during
MILAGRO
C. A. Corr et al.
Title Page
Abstract Introduction
Conclusions References
Tables Figures
◭ ◮
◭ ◮
Back Close
Full Screen / Esc
Printer-friendly Version
Interactive Discussion
al. (2005) to estimateω500at the T1 site during morning hours on DOY 71, 78 and 86, as 0.84, 0.85, and 0.89. AERONET retrievals ofω441at similar times on the respective
days averaged 0.89, 0.90, and 0.92, withω674 averaging 0.88, 0.89, and 0.90.
Mar-ley et al.’s (2009) averages on these days were 0.76, 0.79, and 0.75; they attributed the discrepancies to the difference between their surface measurements that included
5
fine particles only, and the column measurements that included all particles, as well as differences in the measurement wavelengths. The values obtained in this work for ω368 and ω332 on DOY 71 and 78 are in line with these other estimates, and indicate
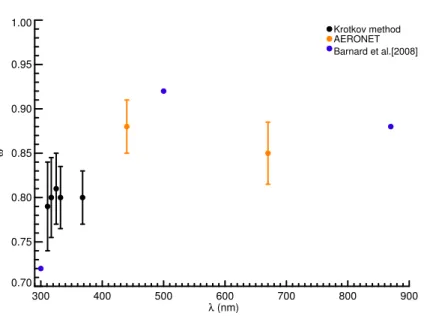
a generally decreasing ω with wavelengths shorter than 500 nm, as also suggested by Barnard et al. (2008), who attributed the enhanced absorption in the near-UV to
10
aerosol organic carbon. Figure 7 shows that the average ω368 and ω332 values
re-trieved for 12, 13 and 21 March using theKrotkov method are substantially lower than AERONETω441 and ω670 averaged over those same days. These findings are
con-sistent with those reported by Barnard et al. (2008), who obtained ω500=0.88–0.95
(average of 0.92) andω300=0.67–0.78 (average of 0.72) using MFRSR and actinic flux
15
spectroradiometer data from the MCMA-2003 field campaign in Mexico City (Fig. 7). As summarized in Table 2, our MILAGRO estimates ofω368=0.73–0.85 and ω332=0.70– 0.83 are well aligned with their estimates at longer and shorter wavelengths, as is the AERONETω441=0.83–0.92 at T1 for the same three days in 2006.
The spectroradiometer-derivedωλ shown in Fig. 1 of Barnard et al. (2008) suggest
20
no significant spectral dependence for 300 nm<λ<400 nm. Our retrievals in Fig. 5 sug-gest only a small difference betweenω368 andω332, although a Student’s t-test found
that ω368>ω332 at the 95% confidence level for most of the retrievals on all retrieval days. In Fig. 8, we show retrieved ωassuming a spectrally-varying surface albedo, which resulted in higher range-averagedω332 values. The revised retrievals for DOY
25
71 and 72 show almost no spectral dependence, and for DOY 80, the slight spectral variation has changed sign.
Figure 9 compares the range-averagedω368 andω332 obtained inthis work for the
ACPD
9, 4971–5008, 2009UV single-scattering albedos during
MILAGRO
C. A. Corr et al.
Title Page
Abstract Introduction
Conclusions References
Tables Figures
◭ ◮
◭ ◮
Back Close
Full Screen / Esc
Printer-friendly Version
Interactive Discussion
the same time periods. The excellent agreement suggests that our choice of range for g was appropriate for this application, and that using the uncorrected DDR (i.e., the V0,λ error cancellation for both diffuse and direct components) is adequate, as long as
a correctedτ is input to the retrieval. Based on our calculations, the assumed range ingleads to a range inωof approximately 0.05, within the±0.025 cited by Barnard et
5
al. (2008) although additional uncertainties must be added to our reported ranges. One advantage of the method proposed in this work is that it does not require an-cillary measurements of the aerosol size distribution, as do theKrotkov method and other approaches listed in Table 1. However, our results do demonstrate that accurate measurements of τ are the most critical for ω retrievals. In Fig. 9, the open
sym-10
bols show the range-averagedω368 andω332 obtained using the uncorrected, on-site Langley-calibrated τ from the UVMRP website. As shown in Table 2, these uncor-rected optical depths are significantly larger than those used inthis work, by at least 0.04 and by as much as 0.1. As can be seen from Fig. 3, an increase inτat constant DDR implies a decrease inω. Therefore,ω368andω332are underestimated when the
15
Langley-calibrated optical depths are used in the retrieval. Fortunately, the DDR itself is not affected by a poorV0,λ calibration. This means that a simple approach than ap-plied here can be used to deriveωfrom data from UV-MFRSR instruments co-located with an AERONET instrument. The accurate direct-sun AERONET optical depths can simply be interpolated to 368 and 332 nm, and uncorrected DDR data can be used
20
together with an appropriate range ofgto estimate ω, similar to the method of Eck et al. (1998) and as in the 19 March retrieval. One advantage of this simplified approach is that it would enable estimates ofωfor more time periods, as generally many more direct Sunτmeasurements are available from the AERONET database than are almu-cantar inversions, needed for the estimates of size distribution and refractive index in
25
ACPD
9, 4971–5008, 2009UV single-scattering albedos during
MILAGRO
C. A. Corr et al.
Title Page
Abstract Introduction
Conclusions References
Tables Figures
◭ ◮
◭ ◮
Back Close
Full Screen / Esc
Printer-friendly Version
Interactive Discussion
4 Conclusions
We have applied the methodology of Petters et al. (2003) to the retrieval of column average aerosol single scattering albedos, ω, from measured direct and diffuse volt-ages in the UV spectral region for three days of measurements at the T1 site in Mexico during the MILAGRO field campaign in March 2006. The method is cross-checked
5
against the more complex methodology proposed by Krotkov et al. (2005a, b), and is shown to yield consistent estimates ofω368 and ω322 if well-calibrated AERONET
aerosol optical depths are used in the retrieval. We find thatω368 generally ranged
from 0.73–0.85, andω332from 0.70–0.86, depending on the day and on the assump-tions used in the retrievals. Our values align well with other estimates ofωat UV and
10
visible wavelengths published for Mexico City and for the MILAGRO campaign. Our selected dates were all within the MILAGRO time period most heavily influenced by fire emissions, and our findings are also consistent with an aerosol composition that had significant contributions from dust or organic carbon species with enhanced absorption at UV wavelengths.
15
Uncertainties that affect our results, particularly the degree of wavelength depen-dence inω, are the value and spectral dependency of surface albedo. When surface albedo was set to a fixed value, a small spectral dependence in ω, with ω368>ω332,
was suggested by the data for all three retrieval days. However, when a wavelength-dependent surface albedo based on MILAGRO measurements was used in the
re-20
trievals, the spectral relationship between theωvalues was eliminated in most cases. Our findings are in general agreement with those of Barnard et al. (2008), who sug-gested a large decrease inωfrom the visible to the near-UV, but weak spectral depen-dence below 400 nm.
As discussed by Barnard et al. (2008), the enhancement in absorption at UV
wave-25
ACPD
9, 4971–5008, 2009UV single-scattering albedos during
MILAGRO
C. A. Corr et al.
Title Page
Abstract Introduction
Conclusions References
Tables Figures
◭ ◮
◭ ◮
Back Close
Full Screen / Esc
Printer-friendly Version
Interactive Discussion
and may also increase local atmospheric heating rates, thereby influencing stability and convection. Marley et al. (2009) showed that measured broadband UV-B irradiances at the T1 site were lower than those modeled for clear sky conditions, confirming that the presence of absorbing gases and aerosols at the T1 site reduced UV-B radiation.
The variations in aerosol loading andωthat we have estimated from the MILAGRO
5
data are large enough to have measurable impacts on photolysis rates. In Fig. 10 we show the results of TUV simulations of the downwelling photolysis rates of NO2,jNO2,
for 13 March for various assumed values ofτ332 and ω, and compare them to direct downwelling measurements from the scanning actinic flux spectroradiometer (SAFS; Lefer et al., 2001). In these simulations we have kept assumed properties constant
10
throughout the day in order to isolate the effects of varying assumptions on the com-puted photolysis rates, and have chosen the ranges in each parameter to span those typical of the 3 retrieval days discussed in this paper. Figure 10 demonstrates that in general, the simulations are able to reproduce the measurements with good accu-racy, a finding that also holds on the other two retrieval days. The green lines
rep-15
resent choices of τ332 and ω closest to our midpoint values for 13 March (Table 2),
and demonstrate that the choice of surface albedo (0.025 vs. 0.06) imposes only about a 1% change in jNO2. In contrast, varying ω from 0.72 to 0.84 (a 17% increase) at
constantτ332, in contrast (solid green and solid pink lines), leads to a∼3.5% increase
injNO
2, similar to the∼4.5% increase injNO2 that arises from a relatively large decrease
20
inτ332from 0.43 to 0.19 at constantω(gold and blue lines). The calculations
demon-strate that jNO2 is atleast sensitive to ω as it is to τ. The effects of the changes in
thejNO
2 values on O3 production were examined using a simple photochemical box model (Lefer et al., 2003). It was found that the % changes in the instantaneous net O3 production rates varied ∼1:1 with changes in jNO2, emphasizing the need for the
25
ACPD
9, 4971–5008, 2009UV single-scattering albedos during
MILAGRO
C. A. Corr et al.
Title Page
Abstract Introduction
Conclusions References
Tables Figures
◭ ◮
◭ ◮
Back Close
Full Screen / Esc
Printer-friendly Version
Interactive Discussion Acknowledgements. This work was conducted through the USDA UV-B Monitoring and
Re-search Program and supported by NSF under grant number ATM-0511911. The USDA UV-B Monitoring and Research Program is supported through the USDA CSREES grant 2006-34263-16926 “Global Change/Ultraviolet Radiation”. Nickolay Krotkov acknowledges NASA support through grant NNX08AQ05G “Spectral absorption properties of aerosols in UV wavelengths”.
5
Sasha Madronich acknowledges support from The National Center for Atmospheric Research which is supported by the NSF. We thank Amando Leyva Contreras, Hector Est ´evez P ´erez, and Wayne W. Newcomb for their efforts in establishing and maintaining the Mexico City AERONET site, and for the use of those data in this work.
References
10
Bais, A. F., Kazantzidis, A., Kazadzis, S., Balis, D. S., Zerefos, C. S., and Meleti, C.: deriving an effective aerosol single scattering albedo from spectral surface UV voltage measurements, Atmos. Environ., 39, 1093–1102, 2005.
Barnard, J. C., Volkamer, R., and Kassianov, E. I.: Estimation of the mass absorption cross section of the organic carbon component of aerosols in the Mexico City Metropolitan Area,
15
Atmos. Chem. Phys., 8, 6665–6679, 2008, http://www.atmos-chem-phys.net/8/6665/2008/.
Bergstrom, R. W., Pilewskie, P., Pommier, J., Rabbette, M., Russell, P. B, Schmid, B., Rede-mann, J., Higurashi, A., Nakajima, T., and Quinn, P. K.: Spectral absorption of solar radiation by aerosols during ACE-Asia, J. Geophys. Res., 109, D19S15, doi:10.1029/2003JD004467,
20
2004.
Bigelow, D. S., Slusser, J. R., Beaubien, A. F., and Gibson, J. H.: The USDA ultraviolet radiation monitoring program, B. Am. Meteorol. Soc., 79, 601–615, 1998.
Bornman, J. F. and Teramura, A. H.: Environmental UV Photobiology, Plenum Press, New York, 1993.
25
Castro, T., Mar, B., Longoria, R., Ruiz-Suarez, L. G., and Morales, L.: Surface albedo mea-surements in Mexico City metropolitan area, Atmosfera, 14, 69–74, 2000.
Castro, T., Madronich, S., Rivale, S., Muhlia, A., and Mar, B.: The influence of aerosols on photochemical smog in Mexico City, Atmos. Environ., 35, 1765–1772, 2001.
Coddington, O., Schmidt, K. S., Pilewskie, P., Gore, W. J., Bergstrom, R. W., Roman, M.,
ACPD
9, 4971–5008, 2009UV single-scattering albedos during
MILAGRO
C. A. Corr et al.
Title Page
Abstract Introduction
Conclusions References
Tables Figures
◭ ◮
◭ ◮
Back Close
Full Screen / Esc
Printer-friendly Version
Interactive Discussion
Redemann, J., Russell, P. B., Liu, J., and Schaaf , C. C.: Aircraft measurements of spectral surface albedo and its consistency with ground-based and space-borne observations, J. Geophys. Res., 113, D17209, doi:10.1029/2008JD010089, 2008.
de Foy, B., Fast, J. D., Paech, S. J., Phillips, D., Walters, J. T., Coulter, R. L., Martin, T. J., Pekour, M. S., Shaw, W. J., Kastendeuch, P. P., Marley, N. A., Retama, A., and Molina,
5
L. T.: Basin-scale wind transport during the MILAGRO field campaign and comparison to climatology using cluster analysis, Atmos. Chem. Phys., 8, 1209–1224, 2008,
http://www.atmos-chem-phys.net/8/1209/2008/.
Dickerson, R., Kondragunta, S., Stenchikov, G., Civerolo, K., Doddridge, B., and Holben, B.: The impact of aerosol on solar UV radiation and photochemical smog, Science, 278, 827–
10
830, 1997.
Diffey, B. L.: Solar ultraviolet-radiation effects on biological-systems, Phys. Med. Biol., 36, 299– 328, 1991.
Doran, J. C., Barnard, J. C., Arnott, W. P., Cary, R., Coulter, R., Fast, J. D., Kassianov, E. I., Kleinman, L., Laulainen, N. S., Martin, T., Paredes-Miranda, G., Pekour, M. S., Shaw, W.
15
J., Smith, D. F., Springston, S. R., and Yu, X.-Y.: The T1-T2 study: evolution of aerosol properties downwind of Mexico City, Atmos. Chem. Phys., 7, 1585–1598, 2007,
http://www.atmos-chem-phys.net/7/1585/2007/.
Dubovik, O. and King, M. D.: A flexible inversion algorithm for retrieval of aerosol optical prop-erties from Sun and sky radiance measurements, J. Geophys. Res., 105, 20673–20696,
20
2000.
Dubovik, O., Smirnov, A., Holben, B. N., King, M. D., Kaufman, Y. J., Eck,, T. F., and Slutsker, I.: Accuracy assessments of aerosol optical properties retrieved from Aerosol Robotic Net-work (AERONET) Sun and sky radiance measurements, J. Geophys. Res., 105, 9791–9806, 2000.
25
Dubovik, O., Holben, B., Eck, T. F., Smirnov, A., Kaufman, Y. J., King, M. D., Tanre, D., and Slutsker, I.: Variability of absorption and optical properties of key aerosol types observed in worldwide locations, J. Atmos. Sci., 59, 590–608, 2002.
Eck, T. F, Holben, B. N., Slutsker, I., and Setzer, A.: Measurements of irradiance attenuation and estimation of aerosol single scattering albedo for biomass burning aerosols in Amazonia,
30
J. Geophys. Res., 103, 31865–31878, 1998.
ACPD
9, 4971–5008, 2009UV single-scattering albedos during
MILAGRO
C. A. Corr et al.
Title Page
Abstract Introduction
Conclusions References
Tables Figures
◭ ◮
◭ ◮
Back Close
Full Screen / Esc
Printer-friendly Version
Interactive Discussion
Elterman, L., Wexler, R., and Chang, D. T.: Features of tropospheric and stratospheric dust, Appl. Opt., 8, 893–903, 1969.
Fast, J. D., de Foy, B., Acevedo Rosas, F., Caetano, E., Carmichael, G., Emmons, L., McKenna, D., Mena, M., Skamarock, W., Tie, X., Coulter, R. L., Barnard, J. C., Wiedinmyer, C., and Madronich, S.: A meteorological overview of the MILAGRO field campaigns, Atmos. Chem.
5
Phys., 7, 2233–2257, 2007,
http://www.atmos-chem-phys.net/7/2233/2007/.
Goering, C. D., L’Ecuyer, T. S., Stephens, G. L., Slusser, J. R., Scott, G., Davis, J., Barnard, J. C., and Madronich, S.: Simultaneous retrievals of column ozone and aerosol optical prop-erties from direct and diffuse solar voltage measurements, J. Geophys. Res., 110, D05204,
10
doi:10.1029/2004JD005330, 2005.
Harrison, L., Michalsky, J., and Berndt, J.: Automated multifilter rotating shadow-band radiome-ter – an instrument for optical depth and radiation measurements, Appl. Opt., 33, 5118–5125, 1994.
Harrison, L. and Michalsky, J.: Objective algorithms for the retrieval of optical depths from
15
ground-based measurements, Appl. Opt., 33, 5126–5132, 1994.
He, S. and Carmichael, G. R.: Sensitivity of photolysis rates and ozone production in the troposphere to aerosol properties, J. Geophys. Res., 104, 26307–26324, 1999.
Hofzumahaus, A., Kraus, A., Kylling, A., and Zerefos, C. S.: Solar actinic radiation (280– 420 nm) in the cloud-free troposphere between ground and 12 km altitude: Measurements
20
and model results, J. Geophys. Res., 107, 8139, doi:10.1029/2001JD900142, 2002.
Holben, B. N., Eck, T. F., Slutsker, I., Tanre, D., Buis, J. P., Setzer, A., Vermote, E., Reagan, J. A., Kaufman, Y. J., Nakajima, T., Lavenu, F., Jankowiak, I., and Smirnov, A.: AERONET – A federated instrument network and data archive for aerosol characterization, Remote Sens. Environ., 66, 1–16, 1998.
25
Holben, B. N., Tanre, D., Smirnov, A., Eck, T. F., Slutsker, I., Abuhassan, N., Newcomb, W. W., Schafer, J. S., Chatenet, B., Lavenu, F., Kaufman, Y. J., Castle, J. V., Setzer, A., Markham, B., Clark, D., Frouin, R., Halthore, R., Karneli, A., O’Neill, N. T., Pietras, C., Pinker, R. T., Voss, K., and Zibordi, G.: An emerging ground-based aerosol climatology: Aerosol optical depth from AERONET, J. Geophys. Res., 106, 12067–12097, 2001.
30
ACPD
9, 4971–5008, 2009UV single-scattering albedos during
MILAGRO
C. A. Corr et al.
Title Page
Abstract Introduction
Conclusions References
Tables Figures
◭ ◮
◭ ◮
Back Close
Full Screen / Esc
Printer-friendly Version
Interactive Discussion
Kleinman, L. I.: The dependence of tropospheric ozone production rate on ozone precursors, Atmos. Environ., 39, 575–586, 2005.
Krotkov, N. A., Bhartia, P. K., Herman, J. R., Fioletov, V., and Kerr, J.: Satellite estimation of spectral surface UV voltage in the presence of tropospheric aerosols 1. Cloud-free case, J. Geophys. Res., 103, 8779–8794, doi:10.1029/98JD00233, 1998.
5
Krotkov, N., Bhartia, P. K., Herman, J., Slusser, J., Labow, G., Scott, G., Janson, G., Eck, T. F., and Holben, B.: Aerosol ultraviolet absorption experiment (2002 to 2004), part 1: ultravi-olet multifilter rotating shadowband radiometer calibration and intercomparison with CIMEL sunphotometers, Opt. Eng., 44, doi:10.1117/1.1886818, 2005a.
Krotkov, N., Bhartia, P. K., Herman, J., Slusser, J., Scott, G., Labow, G., Vasilkov, A. P., Eck, T.
10
F., Dubovik, O., and Holben, B. N.: Aerosol ultraviolet absorption experiment (2002 to 2004), part 2: absorption optical thickness, refractive index, and single scattering albedo, Opt. Eng., 44, doi:10.1117/1.1886819, 2005b.
Krotkov, N., Herman, J., Cede, A., and Labow, G.: Partitioning between aerosol and NO2 absorption in the UVA, in: Ultraviolet Ground- and Space-based Measurements, Models, and
15
Effects V, edited by: Bernhard, G., Slusser, J. R., Herman, J. R., and Gao, W., Proceedings of SPIE, 5886, Bellingham, WA, 588601, 2005c.
Kudo, R., Uchiyama, A., Yamazaki, A., Kobayashi, E., and Nishizawa, T.: retrieval of aerosol single-scattering properties from diffuse and direct irradiacnce: Numerical studies, J. Geo-phys. Res., 113, D09204, doi:10.1029/2007JD009239, 2008.
20
Lefer, B. L., Hall, S. R., Cinquini, L., Shelter, R. E., Barrick, J. D., and Crawford, J. H.: Compari-son of airborne NOi photolysis frequency measurements during PEM Tropics B, J. Geophys. Res., 106, 32645–32656, 2001.
Lefer, B. L., Shetter, R. E., Hall, S. R., Crawford, J. H., and Olson, J. R.: Impact of clouds and aerosols on photolysis frequencies and photochemistry during TRACE-P: 1.
Analy-25
sis using radiative transfer and photochemical box models, J. Geophys. Res., 108, 8821, doi:10.1029/2002JD003171, 2003.
Liu, S. C., McKeen, S. A., and Madronich, S.: Effect of anthropogenic aerosols on biologically active ultraviolet radiation, Geophys. Res. Lett., 18, 2265–2268, 1991.
Longstreth, J., de Gruijl, F. R., Kripke, M. L., Abseck, S., Arnold, F., Slaper, H. I., Velders, G.,
30
Takizawa, Y., and van der Leun, J. C.: Health risks, J. Photoch Photobio-B, 46, 20–39, 1998. Madronich, S. and Flocke, S.: The role of solar radiation in atmospheric chemistry, in:
ACPD
9, 4971–5008, 2009UV single-scattering albedos during
MILAGRO
C. A. Corr et al.
Title Page
Abstract Introduction
Conclusions References
Tables Figures
◭ ◮
◭ ◮
Back Close
Full Screen / Esc
Printer-friendly Version
Interactive Discussion
1998.
Madronich, S., Shetter, R., Hall, S., Lefer, B., and Slusser, J.: Ultraviolet characteristics of PBL aerosol in Mexico City, Eos Trans. AGU, 88(52), Fall Meet. Suppl., Abstract A32A-06, 2007. Marley, N. A., Gaffney, J. S., Castro, T., Salcido, A., and Frederick, J.: Measurements of aerosol
absorption and scattering in the Mexico City Metropolitan Area during the MILAGRO field
5
campaign: a comparison of results from the T0 and T1 sites, Atmos. Chem. Phys., 9, 189– 206, 2009,
http://www.atmos-chem-phys.net/9/189/2009/.
Michalsky, J. J., Schlemmer, F. A., Berkheiser, W. E., Berndt, J. L., Harrison, L. C., Laulainen, N. S., Larson, N. R., and Barnard, J. C.: Multiyear measurements of aerosol optical depth
10
in the Atmospheric Radiation Measurement and Quantitative Links programs, J. Geophys. Res., 106, 12099–12107, 2001.
Moffet, R. C., de Foy, B., Molina, L. T., Molina, M. J., and Prather, K. A.: Measurement of am-bient aerosols in northern Mexico City by single particle mass spectrometry, Atmos. Chem. Phys., 8, 4499–4516, 2008,
15
http://www.atmos-chem-phys.net/8/4499/2008/.
Petters, J. L., Saxena, V. K., Slusser, J. R., Wenny, B. N., and Madronich, S.: Aerosol single scattering albedo retrieved from measurements of surface UV voltage and a radiative transfer model, J. Geophys. Res., 108, 4288, doi:10.1029/2002JD002360, 2003.
Querol, X., Pey, J., Minguill ´on, M. C., P ´erez, N., Alastuey, A., Viana, M., Moreno, T., Bernab ´e,
20
R. M., Blanco, S., C ´ardenas, B., Vega, E., Sosa, G., Escalona, S., Ruiz, H., and Art´ı˜nano, B.: PM speciation and sources in Mexico during the MILAGRO-2006 Campaign, Atmos. Chem. Phys., 8, 111–128, 2008,
http://www.atmos-chem-phys.net/8/111/2008/.
Reuder, J. and Schwander, H.: Aerosol effects on UV radiation in nonurban regions, J.
Geo-25
phys. Res., 104, 4065–4077, 1999.
Slusser, J., Gibson, J., Bigelow, D., Kolinski, D., Disterhoft, P., Lantz, K., and Beaubien, A.: Langley method of calibrating UV filter radiometers, J. Geophys. Res., 105, 4841–4849, 2000.
Sokolik, I. N. and Toon, O. B.: Incorporation of mineralogical composition into models of the
30
radiative properties of mineral aerosol from UV to IR wavelengths, J. Geophys. Res., 104, 9423–9444, 1999.
ACPD
9, 4971–5008, 2009UV single-scattering albedos during
MILAGRO
C. A. Corr et al.
Title Page
Abstract Introduction
Conclusions References
Tables Figures
◭ ◮
◭ ◮
Back Close
Full Screen / Esc
Printer-friendly Version
Interactive Discussion
Source apportionment of fine organic aerosol in Mexico City during the MILAGRO experi-ment 2006, Atmos. Chem. Phys., 8, 1249–1259, 2008,
http://www.atmos-chem-phys.net/8/1249/2008/.
Taylor, T. E., L’Ecuyer, T. S., Slusser, J. R., Stephens, G. L., and Goering, C. D.: An operational retrieval algorithm for determining aerosol optical properties in the ultraviolet, J. Geophys.
5
Res., 113, D03201, doi:10.1029/2007JD008661, 2008.
Weaver, C. J., Ginoux, P., Hsu, N. C., Chou, M. D., and Joiner, J.: Radiative forcing of Saharan dust: GOCART model simulations compared with ERBE data, J. Atmos. Sci., 59, 736–747, 2002.
Wenny, B. N., Schafer, J. S., DeLuisi, J. J., Saxena, V. K., Barnard, W. F., Petropavlovskikh,
10
I. V., and Vergamini, A. J.: A study of regional aerosol radiative properties and effects on ultraviolet-B radiation, J. Geophys. Res., 103, 17083–17097, 1998.
Wetzel, M. A., Shaw, G. E., Slusser, J. R., Borys, R. D., and Cahill, C. F.: Physical, chemical, and ultraviolet radiative characteristics of aerosol in central Alaska, J. Geophys. Res., 108, 4418, doi:10.1029/2002JD003208, 2003.
15
Yokelson, R. J., Urbanski, S. P., Atlas, E. L., Toohey, D. W., Alvarado, E. C., Crounse, J. D., Wennberg, P. O., Fisher, M. E., Wold, C. E., Campos, T. L., Adachi, K., Buseck, P. R., and Hao, W. M.: Emissions from forest fires near Mexico City, Atmos. Chem. Phys., 7, 5569– 5584, 2007,
http://www.atmos-chem-phys.net/7/5569/2007/.
ACPD
9, 4971–5008, 2009UV single-scattering albedos during
MILAGRO
C. A. Corr et al.
Title Page Abstract Introduction Conclusions References Tables Figures ◭ ◮ ◭ ◮ Back Close
Full Screen / Esc
Printer-friendly Version
Interactive Discussion
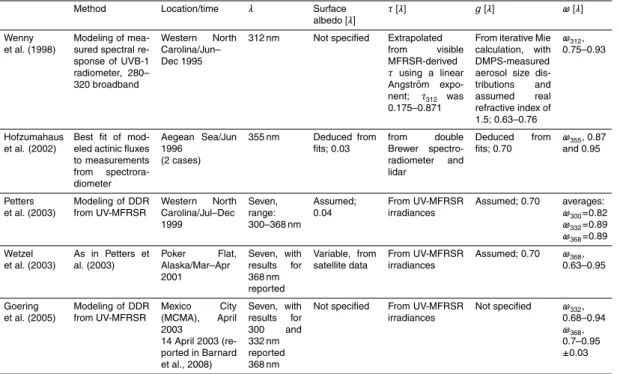
Table 1. Published studies estimatingωat UV wavelengths, not including studies using in situ point measurements.
Method Location/time λ Surface
albedo [λ]
τ[λ] g[λ] ω[λ]
Wenny et al. (1998)
Modeling of mea-sured spectral re-sponse of UVB-1 radiometer, 280– 320 broadband
Western North Carolina/Jun– Dec 1995
312 nm Not specified Extrapolated
from visible
MFRSR-derived
τ using a linear Angstr ¨om expo-nent; τ312 was
0.175–0.871
From iterative Mie calculation, with DMPS-measured aerosol size dis-tributions and
assumed real
refractive index of 1.5; 0.63–0.76
ω312, 0.75–0.93
Hofzumahaus et al. (2002)
Best fit of mod-eled actinic fluxes to measurements from spectrora-diometer Aegean Sea/Jun 1996 (2 cases)
355 nm Deduced from
fits; 0.03 from double Brewer spectro-radiometer and lidar Deduced from fits; 0.70
ω355, 0.87
and 0.95
Petters et al. (2003)
Modeling of DDR from UV-MFRSR Western North Carolina/Jul–Dec 1999 Seven, range: 300–368 nm Assumed; 0.04 From UV-MFRSR irradiances
Assumed; 0.70 averages:
ω300=0.82 ω332=0.89
ω368=0.89
Wetzel et al. (2003)
As in Petters et al. (2003) Poker Flat, Alaska/Mar–Apr 2001 Seven, with results for 368 nm reported Variable, from satellite data From UV-MFRSR irradiances
Assumed; 0.70 ω368, 0.63–0.95
Goering et al. (2005)
Modeling of DDR from UV-MFRSR
Mexico City
(MCMA), April 2003
14 April 2003 (re-ported in Barnard et al., 2008)
Seven, with results for 300 and 332 nm reported 368 nm
Not specified From UV-MFRSR irradiances
Not specified ω332,
0.68–0.94
ω368, 0.7–0.95
ACPD
9, 4971–5008, 2009UV single-scattering albedos during
MILAGRO
C. A. Corr et al.
Title Page Abstract Introduction Conclusions References Tables Figures ◭ ◮ ◭ ◮ Back Close
Full Screen / Esc
Printer-friendly Version
Interactive Discussion
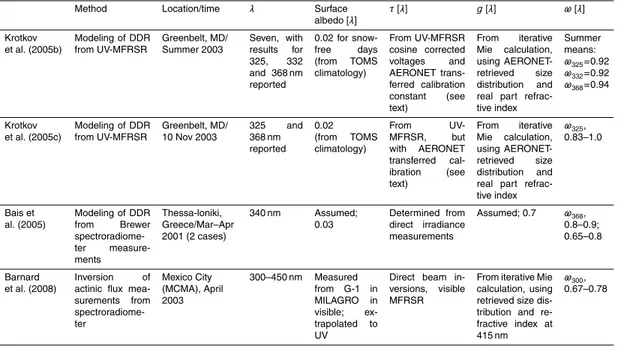
Table 1.Continued.
Method Location/time λ Surface
albedo [λ]
τ[λ] g[λ] ω[λ]
Krotkov et al. (2005b)
Modeling of DDR from UV-MFRSR Greenbelt, MD/ Summer 2003 Seven, with results for 325, 332
and 368 nm reported
0.02 for
snow-free days (from TOMS climatology) From UV-MFRSR cosine corrected voltages and AERONET trans-ferred calibration constant (see text) From iterative Mie calculation, using AERONET-retrieved size distribution and real part refrac-tive index
Summer means:
ω325=0.92
ω332=0.92 ω368=0.94
Krotkov et al. (2005c)
Modeling of DDR from UV-MFRSR
Greenbelt, MD/ 10 Nov 2003
325 and 368 nm reported 0.02 (from TOMS climatology) From UV-MFRSR, but with AERONET transferred cal-ibration (see text) From iterative Mie calculation, using AERONET-retrieved size distribution and real part refrac-tive index
ω325, 0.83–1.0
Bais et al. (2005)
Modeling of DDR
from Brewer spectroradiome-ter measure-ments Thessa-loniki, Greece/Mar–Apr 2001 (2 cases)
340 nm Assumed;
0.03
Determined from direct irradiance measurements
Assumed; 0.7 ω368,
0.8–0.9; 0.65–0.8
Barnard et al. (2008)
Inversion of
actinic flux mea-surements from spectroradiome-ter Mexico City (MCMA), April 2003
300–450 nm Measured
from G-1 in
MILAGRO in
visible; ex-trapolated to UV
Direct beam in-versions, visible MFRSR
From iterative Mie calculation, using retrieved size dis-tribution and re-fractive index at 415 nm
ACPD
9, 4971–5008, 2009UV single-scattering albedos during
MILAGRO
C. A. Corr et al.
Title Page
Abstract Introduction
Conclusions References
Tables Figures
◭ ◮
◭ ◮
Back Close
Full Screen / Esc
Printer-friendly Version
Interactive Discussion
Table 2. Days during March 2006 for which retrievals were conducted for data from the T1 site, together with values for some of the required TUV4.4 input parameters. The final four columns show the retrieved ranges ofω368andω332for the indicated assumed values of surface albedos, using the aerosol optical depths obtained from the adjustedV0,λ(columns 4 and 5).
adjustedV0,λ unadjustedV0,λ surface albedo=0.06 spectrally-varying
(using AERONET) (Langley method) surface albedo
DOY day time (UT) τ368 τ332 τ368 τ332 ω368 ω332 ω368 ω332
ACPD
9, 4971–5008, 2009UV single-scattering albedos during
MILAGRO
C. A. Corr et al.
Title Page
Abstract Introduction
Conclusions References
Tables Figures
◭ ◮
◭ ◮
Back Close
Full Screen / Esc
Printer-friendly Version
Interactive Discussion
ACPD
9, 4971–5008, 2009UV single-scattering albedos during
MILAGRO
C. A. Corr et al.
Title Page
Abstract Introduction
Conclusions References
Tables Figures
◭ ◮
◭ ◮
Back Close
Full Screen / Esc
Printer-friendly Version
Interactive Discussion
ACPD
9, 4971–5008, 2009UV single-scattering albedos during
MILAGRO
C. A. Corr et al.
Title Page
Abstract Introduction
Conclusions References
Tables Figures
◭ ◮
◭ ◮
Back Close
Full Screen / Esc
Printer-friendly Version
Interactive Discussion
0.5 0.6 0.7 0.8 0.9
g 0.5
0.6 0.7 0.8 0.9 1.0
ω
368nm
0.9
0.9 1.0
1.0 1.1
1.1 1.2
1.2 1.3
1.3 1.4
1.4 1.5
1.5 1.6
1.6
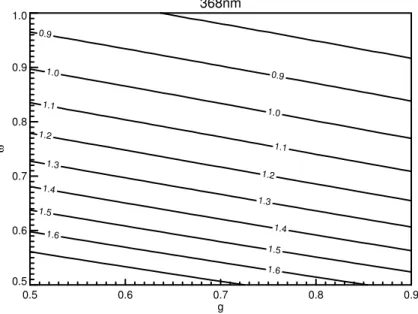
Fig. 3.Contours of DDR (direct-to-diffuse ratio) computed at 368 nm, as a function ofτ368and
ω368for fixed value ofg368(0.70), SZA (40◦
ACPD
9, 4971–5008, 2009UV single-scattering albedos during
MILAGRO
C. A. Corr et al.
Title Page
Abstract Introduction
Conclusions References
Tables Figures
◭ ◮
◭ ◮
Back Close
Full Screen / Esc
Printer-friendly Version
Interactive Discussion
Fig. 4. Timeline of τ386 determined from AERONET direct-Sun inversions at the T1 site, for 10 March (DOY 69) through 31 March (DOY 90). Data are Level 2 (black) cloud-screened and Level 1 unprocessed (blue). The yellow-highlighted points show the periods for which