A report by the Open Society Foundations
Pedro Mizukami
Jhessica Reia
Attribution — Non Commercial — No Derivs 3.0
Printed in Brazil
This fi rst edition was completed in August 2014
This book is in the Legal Deposit Division of the Brazilian National Library.
Authors are responsible for all concepts and information presented in this book.
Coordination: Sacha Mofreita Leite, Thaís Teixeira Mesquita e Rodrigo Vianna Cover: FGV’s Rio de Janeiro Law School
Diagramation: Leandro Collares — Selênia Serviços
Catalographic card prepared by Mario Henrique Simonsen Library / FGV Mizukami, Pedro Nicoletti
Mapping digital media Brazil: a report by the Open So-cieties Foundations / written by Pedro Mizukami, Jhessica Reia and Joana Varon; edited by Marius Dragomir, Mark Thompson, Fernando Bermejo. — Rio de Janeiro: Escola de Direito do Rio de Janeiro da Fundação Getulio Vargas, Cen-tro de Tecnologia e Sociedade, 2014.
340 p. : il.
ISBN: 978-85-63265-33-3
1. Mídia digital — Brasil. 2. Comunicação de massa — Brasil. I. Reia, Jhessica. II. Ferraz, Joana Varon. III. Dragomir, Marius. IV. Thompson, Mark. V. Bermejo, Fernando. VI. Es-cola de Direito do Rio de Janeiro da Fundação Getulio Var-gas. Centro de Tecnologia e Sociedade. VII. Título.
CDD – 302.231
This book was produced by FGV’s Rio de Janeiro Law School, composed with the Gotham typeface
EDITED BY
Marius Dragomir and Mark Thompson (Open Society Media Program editors) Fernando Bermejo (regional editor)
EDITORIAL COMMISSION
Yuen-Ying Chan, Christian S. Nissen, Dušan Reljic’, Russell Southwood, Damian Tambini
The Editorial Commission is an advisory body. Its members are not responsible for the information or assessments contained in the Mapping Digital Media texts.
OPEN SOCIETY MEDIA PROGRAM TEAM
Meijinder Kaur, program assistant; Gordana Jankovic, director
OPEN SOCIETY INFORMATION PROGRAM TEAM
Introduction 9
Executive Summary 11
Context 17
Social Indicators 19
Economic Indicators 21
1. Media Consumption: The Digital Factor 23
1.1 Digital Take-up 23
1.2 Media Preferences 29
1.3 News Providers 34
1.4 Assessments 45
2. Digital Media and Public or State-administered Broadcasters 47
2.1 Public Service and State Institutions 47
2.2 Public Service Provision 53
2.3 Assessments 56
3. Digital Media and Society 57
3.1 User-Generated Content (UGC) 57
3.2 Digital Activism 62
4.2 Investigative Journalism 75
4.3 Social and Cultural Diversity 81
4.4 Political Diversity 84
4.5 Assessments 88
5. Digital Media and Technology 89
5.1 Broadcasting Spectrum 89
5.2 Digital Gatekeeping 95
5.3 Telecommunications 98
5.4 Assessments 101
6. Digital Business 103
6.1 Ownership 103
6.2 Media Funding 114
6.3 Media Business Models 122
6.4 Assessments 124
7. Policies, Laws, and Regulators 127
7.1 Policies and Laws 127
7.2 Regulators 141
7.3 Government Interference 148
7.4 Assessments 151
8. Conclusions 155
8.1 Media Today 155
8.2 Media Tomorrow 158
The information we consume shapes the way we see the world. As such, the development of the democratic societies throughout the 20th century has
wit-nessed the evolution of standards and regulations which seek to secure free-dom in media, diversity of content and opinions, and freefree-doms of expression and press.
The task of guaranteeing a healthy and free communication environment, however, is as complex as it is essential. After all, it is a topic riddled with im-portant technical specifi cities, in an environment in which various technologies are in constant and accelerated development.
With digitization, the challenges have become even greater, as a result of the so-called digital convergence, companies that operated in different mar-kets began to dispute the same clients and offer the same services. Since the 1990s, the line that separated telecom companies from Internet companies has been almost completely erased, at least to consumer eyes, who receive all these services combined in combos or packages.
With the development of digital technologies, it makes less and less sense to discuss telecommunications and broadcasting services separately. Never-theless, each of these sets of services has its own specifi c technical character-istics, legislative history and, therefore, differences which are relevant for the exercise of regulatory activity.
In this context, even for those who follow media policy closely, it becomes diffi cult to have a suffi ciently wide view of the fi eld. In the absence of such an account, understanding and formulating public policy may be diffi cult.
Mapping Digital Media: Brazil is an attempt to tackle some of these issues. The present report is part of a series of studies on the impact of digitization in journalism and media edited by the Open Society Foundations1. The following
pages contain the results of a broad study on Brazilian media policy, from me-dia consumption to the effects of digitization on newsrooms,
tion and broadcasting services. Divided in eight chapters, the report offers an overview of the Brazilian media landscape and its regulation between 2010 and 2013, representing an outline of markets in a permanent state of change.
Between the conclusion of the study and its publication in Portuguese, the main change in the legislative fi eld was the approval of the draft of the Civil Rights Framework for the Internet, the so-called Marco Civil (Bill 2.126/11), sanctioned by President Dilma Rousseff on the 23rd of April 2014 during the NETmundial, an important international event held in São Paulo to discuss the future of Internet governance.
Published as Law 12.965/14, the Marco Civil brought about important changes for the future of communications in Brazil, establishing rules and prin-ciples to secure freedom of expression and other user rights. The main provi-sions relate to users’ privacy and personal data protection, guidelines for gov-ernment actions and intermediary liability.
Additionally, Article 9 of the Marco Civil imposes net neutrality obliga-tions on telecom companies, requiring the isonomic treatment of data pack-ages. However, it still depends on regulation by Federal Decree, which must be edited following advice by the Brazilian Internet Steering Committee (CGI.br) and the National Telecommunications Agency (Anatel). The regulation and the interpretation of these rules will likely be subject of important disputes, which will defi ne their reach in the long term.
Diversity of opinions and content on the Internet has undeniably increased. But the development of digital technology demonstrates that the Internet is not immune to economic concentration and practices that may reduce such pluralism, shaping policymaking in the media landscape.
In June 2013, scores of cities across Brazil witnessed a series of protests, ini-tiating a wave of public demonstrations that hit headlines around the world. Information overload — visual and textual — through social media, competing narratives about the meaning of the demonstrations, long-standing political demands, police brutality, and the evident perplexity of politicians and citizens trying to make sense of events: these all paint an intriguing backdrop to the debates surrounding media policy in Brazil. Two months later, while this report was being completed, the protests were still going strong, even if on a smaller scale.
Highly heterogeneous in nature, the protests involved a range of demands and constituencies, making it diffi cult to extract a coherent narrative out of what has so far been a very disorienting and extremely diversifi ed phenom-enon. Problems relating to public transport — the focus of the initial protests — compete for space and attention in the streets with issues such as Brazil’s role as a host country for sporting mega-events (the Confederations Cup in 2013, the World Cup in 2014, and the Olympic Games in 2016), corruption in politics, health and education, the desirability of specifi c bills, and the rights of minori-ties, among other topics. Left-leaning causes mingle with right-wing sentiment; demonstrations against government at all levels of the federation have also been common, along with challenges to the very concepts of a political party and representative democracy.
the 1964 military coup — an act that was described by one commentator as an attempt at rebranding.2
At the same time, Brazilians witnessed the emergence of organized, on-the-spot, independent coverage of the protests, which were broadcast live from smartphone cameras over the internet, or recorded and then uploaded by individuals or alternative media collectives, edited and unedited. The internet and social media played an essential role in the organization of the protests, and also provided the means to disseminate live information of what was hap-pening in the streets. Coverage by traditional outlets was comparatively lack-ing, both in substance and in speed of delivery.
These developments eloquently illustrate the shifts brought about by digi-tization, in which incumbents still hold a considerable market and mind share, but are consistently challenged by changes in media consumption habits, and aggressive competition from foreign telecommunications conglomerates and internet companies. This report describes a period of continuing transition, from an era characterized by the dominance of a relatively stable oligopolistic media system, to an era of change propelled by digital convergence.
In the short term, the most radical transformations will be hard to spot, since traditional media have built considerable online presences. Business mod-els, nonetheless, will have to be redesigned. Over the medium to long term, the scenario points towards a drastic reconfi guration of the media landscape, which some players will endure with more resilience than others, and important regulatory decisions will have to be made.
Brazil’s media landscape has been characterized historically by oligopo-listic control, made viable by fl aws in the broadcast licensing system, with li-censes used as political currency, regulatory voids, lax enforcement of existing rules, and an absence of adequate checks on cross-media ownership, which all ultimately impact on the diversity of news sources.
The traditional media tend to frame all debate on the matter with strong claims that positive reform would be an authoritarian attempt to curb free-dom of expression. The federal government has also avoided the topic along with its clear political implications, despite convening a National
Communi-cations Conference (Conferência Nacional de Comunicação, Confecom) in
2009, which produced a number of recommendations for reform. President Dilma Rousseff and her Minister of Communications, Paulo Bernardo, have repeated that they would not discuss the subject, at least until after the 2014 elections. Meanwhile, civil society organizations are attempting to gather
natures for a citizens’ initiative bill on media reform. If they succeed, this bill will be submitted to a National Congress that is far from impartial on the sub-ject, as many deputies and senators directly or indirectly own broadcasting companies.
Since the 1960s, free-to-air television has been the predominant source of news, entertainment, and culture for Brazil’s sizable population, and it contin-ues to be the main source of information for most citizens. It is available in 98.3 percent of households, with Globo holding the highest audience ratings every year. Subscriptions for paid television are on the rise, growing constantly from 1998 to 2005, and substantially since 2005. Even so, by June 2012 there were only 14.5 million subscriptions to paid television services, in a country which had 190.7 million inhabitants in 2010.
Digital terrestrial television covered 508 municipalities in May 2012, reach-ing almost 46.8 percent of the entire population. Nevertheless, the digital switch-over, scheduled for completion in 2018, has so far been an exercise in maintaining the status quo. No new entrants in the free-to-air television market have emerged during the ongoing transition to digital television, and the digital dividend will be auctioned to telcos for 4G services.
The standard chosen for the Brazilian System of Digital Television (
Siste-ma Brasileiro de Televisão Digital, SBTVD) is ISDB-Tb, a modifi ed version of
the Japanese ISDB-T. The most important addition to the standard is Ginga middleware, which would allow for greater interactivity in digital broadcasts. But Ginga is hampered by serious implementation problems, and it is hard to be optimistic about its wide adoption and use. Standards for digital radio have not yet been defi ned.
Public service broadcasting has never really taken off in Brazil, which has privileged commercial broadcasting from the early years of regulation. Public service channels such as TV Cultura and TVE (now TV Brasil) have become rel-atively popular, but were never as successful as their commercial counterparts. The creation in 2007 of a federal broadcaster, the Brazil Communication
Com-pany (Empresa Brasil de Comunicação, EBC), has helped to rekindle debates
on Article 223 of the Constitution, which establishes that social communication is composed of three complementary systems: public, state, and private. EBC’s model, nonetheless, depends entirely on federal government funds, and has
fl aws that need to be addressed if EBC is to fulfi ll its original mission.
— mainly to the detriment of the lowest income classes, since only 7 percent of households with less than one minimum wage per month have internet access — but it is certainly narrower now than a few years ago. Internet access is also geographically uneven; while 44 percent of households in urban areas have ac-cess, only 10 percent of households in rural regions are connected. The federal
government is implementing a National Broadband Plan (Plano Nacional de
Banda Larga, PNBL), but its results so far are hardly encouraging.
Access to mobile telecommunications is widespread, and there are more SIM cards circulating in Brazil than there are Brazilians (261 million SIM cards over 190 million inhabitants), most of them prepaid (80.5 percent). This is mostly due to high interconnection costs between carriers, which provide no-toriously low quality services. Mobile broadband access has increased from 1.7 percent of active SIM cards in 2008 to 52.5 percent in 2012. During 2013, Brazil started to implement 4G networks (occupying the 2.500 MHz frequency of the spectrum), in order to meet demands for the FIFA World Cup in cities hosting the matches in 2014. The government intends to implement the technology in these cities by December 2013, but 4G services are still in their infancy.
Digitization has had profound effects on journalism. Information fl ows faster than ever, and from a greater number of sources; journalists have to adapt to an environment that demands immediate coverage of events, some-times privileging speed over content. Traditional news outlets have diversifi ed the ways they make their content available, and new skills are now required of journalists. At the same time, working conditions for journalists have been negatively impacted over the last decade, since they are required to work more and assume new roles to accommodate demands that derive from digital news delivery.
While television news ratings are in decline, the internet has become the second main source of news, and the number of people reading newspapers online has nearly tripled over four years. Print media, nonetheless, are in a crisis, with mass layoffs in recent months as newspapers struggle to fi nd viable busi-ness models. Investigative journalism is particularly affected, despite a small but encouraging number of recent examples provided by crowd-funded inde-pendent journalism.
Brazilians are heavy users of social media and user-generated content platforms, with Facebook and YouTube being the second and fourth most ac-cessed URLs in September 2013, according to Alexa. In December 2012, Brazil-ians averaged 579 minutes a week on social networks, considerably above the global average of 383.3 minutes, according to comScore data.
groups are also among the highest ranking websites in Brazil, and much of the content that is eventually replicated in social media originates from these sourc-es. Nonetheless, it is undeniable that connected Brazilians are potentially more exposed to alternative points-of-view, and the popularity of an initiative such as Mídia NINJA in the June protests indicated the direction of possible shifts.
At the legislative level, two important developments can be pointed out. The Information Access Law (Law 12527/11) fi lls a long-standing gap in legis-lation by providing citizens with the means to make information requests to government at all levels of the federation. The Conditional Access Service Law (Law 12485/11) established unifi ed treatment of pay-TV, which was previously regulated according to the technology used (different rules for cable, DTH, and MMDS), leading to contradictory regimes for services that were essentially the same. Law 12485/11 also establishes cross-ownership limits between certain telecommunications and broadcasting companies, which are open to criticism in terms of criteria, implementation, and enforcement, but do set a precedent for further debate on the subject.
Serious gaps in internet regulation topics such as net neutrality, ISP liabil-ity, privacy, and user rights still have not been addressed by legislation. In an at-tempt to fi ll these gaps, the Civil Rights Framework for the Internet (Marco Civil
da Internet), a draft bill produced through a process of public online debate
carried out by the Ministry of Justice, was sent to the National Congress in 2011. The text faced strong opposition from some quarters, and telecommunications companies were particularly aggressive in attacking the bill’s net neutrality pro-visions. The ISP liability provisions were also controversial, and pressure from broadcasters and copyright owners was successful in removing copyright in-fringement cases from the Marco Civil system, which only considers ISPs liable for third-party content if the ISP refuses to obey a judicial order demanding that content is removed. Marco Civil also contains general privacy provisions, but the main proposal on the subject is a bill for personal data protection, which was also submitted to a public online consultation by the Ministry of Justice.
After the NSA leaks by Edward Snowden in summer 2013, surveillance of Brazilian citizens and companies by the United States has become a major con-cern for the government of Brazil, as illustrated by President Dilma’s remarks at
the 68th Session of the United Nations General Assembly, on 24 September.3
These leaks motivated the government to speed up the voting of Marco Civil. Controversial proposals in response to U.S. espionage — including the obliga-tory storage of data relating to Brazilian nationals by online services in data centers located within Brazil were broadly debated.
When this report was released, in November 2013, the Marco Civil was about to be voted by the Chamber of Deputies, having been under a “constitu-tional urgency”4regime since September of the same year. Despite the urgency
regime, voting was delayed 20 times, after which the Chamber’s agenda was forcefully halted. Finally, on the 25th of March 2014 the project was approved by the Chamber and submitted to the Senate, where it was analyzed by three committees simultaneously. After little more than a month, the Senate ap-proved the project, which was sanctioned by President Dilma Rousseff on the 23rd of April 2014, during the opening of the NETmundial summit which was held in Sao Paulo. Two months later, the Marco Civil came into effect (as Law nº 12.965/14). Nonetheless, issues, such as net neutrality and data retention, have yet to be specifi cally regulated.
With a population of 190,755,7995 inhabitants and an area of 8,514,877 km ,
Brazil is the largest country in Latin America and the fi fth largest country in the world, both in population and geographical area.6
Despite its large dimensions and its ethnic diversity, Portuguese is the country’s only offi cial language, and is spoken by almost the entire popula-tion. A few indigenous languages are spoken, mostly in the Amazon region and other remote areas, as well as a small number of dialects spoken by immigrants in the South. Roman Catholicism is the most widespread religion, professed by 64.6 percent of the population, but in decline over the last decade.
The population is unevenly distributed throughout the territory, and is heavily concentrated (42.1 percent) in the Southeast, the country’s richest re-gion and the location of Brazil’s most populated city, São Paulo. The Northeast region has the second highest population, with 27.8 percent of all inhabitants, while 14.4 percent reside in the South, 8.3 percent in the North, and 7.4 percent in the Center-West.7
Dilma Rousseff, of the Workers’ Party (Partido dos Trabalhadores, PT), was elected in 2010 and is the fi rst woman president of the Federative Republic of Brazil, which is composed of 26 states, over 5,500 municipalities and the Fed-eral District, where the capital, Brasilia, is located.
The “B” in the BRIC nations (Brazil, Russia, India, China), Brazil is the world’s seventh largest economy, and it experienced a GDP growth of 7.5 percent in 2010. Development was modest in 2011 (2.7 percent), and experienced a sharp decline in 2012 (0.9 percent).
Brazil’s notoriously uneven distribution of wealth was somewhat levelled out during the recent period of economic growth, mostly as a consequence of social programs initiated during the Luis Inácio Lula da Silva administration.
5 Brazilian Institute of Geography and Statistics (Instituto Brasileiro de Geografi a e Estatísti-ca, IBGE), Demographic Census, 2010 (hereafter, IBGE, Demographic Census, 2010). 6 United Nations Statistics Division, Demographic Yearbook, 2008.
Between 2001 and 2009, the per capita income of the richest 10 percent of the population rose by 1.5 percent annually, while the income of the poorest grew at a rate of 6.8 percent.8 The municipal human development index (MHDI) has
improved at a rate of 47.5 percent over the previous 20 years.
According to the National Household Sample Survey (Pesquisa Nacional
por Amostra de Domicílios, PNAD), this growth in income, as well as
improve-ments in living conditions and the reduction in unemployment rates, has led to a 45 percent reduction in poverty.9 This scenario had a visible impact on
the consumption of productive assets, such as IT goods, and education, which rose even during the global economic crisis. Nonetheless, a signifi cant number of Brazilians (around 15 percent) are still living below the poverty line, income distribution continues to be a major problem, and, according to the aforemen-tioned survey,7.9 percent of the population was wholly illiterate in 2011.
8 M.C. Neri, Good news for the poor. The Brazilian Economy, vol. 2, n. 10, October 2010, at http://cps.fgv.br/sites/cps.fgv.br/fi les/artigo/The_Brazilian_Economy_October_2010_ MC.pdf (accessed 20 August 2011).
Population (number of inhabitants): 190.7 million10
Number of households: 67.4 million11
Figure 1.
Rural-urban breakdown (% of total population), 2010
Urban: 84.3% Rural: 15.7%
Source: IBGE, Demographic Census, 2010.
Figure 2.
Ethnic composition (% of total population), 2010
White: 47.7% Pardo (multiracial): 43.1%
Afro-Brazilian: 7.6%
Asian: 1.1% Indigenous: 0.4%
No declaration: 0.1%
Source: IBGE, Demographic Census, 2010.
Figure 3.
Religious composition (% of total population), 2010
Roman Catholic: 64.6% Protestantism: 22.2%
No religion: 8.0%
Espiritism: 2.0% Other religions: 2.7%
Umbanda
and Candomblé: 0.3%
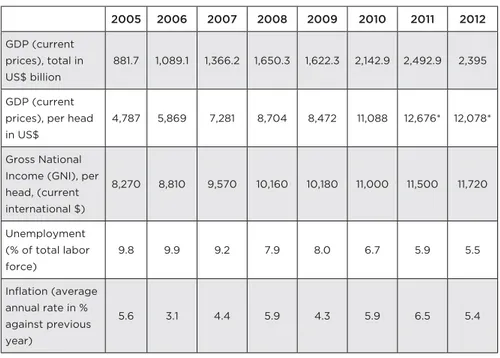
Table 1.
Economic indicators, 2005—2012
2005 2006 2007 2008 2009 2010 2011 2012
GDP (current prices), total in US$ billion
881.7 1,089.1 1,366.2 1,650.3 1,622.3 2,142.9 2,492.9 2,395
GDP (current prices), per head in US$
4,787 5,869 7,281 8,704 8,472 11,088 12,676* 12,078*
Gross National Income (GNI), per head, (current international $)
8,270 8,810 9,570 10,160 10,180 11,000 11,500 11,720
Unemployment (% of total labor force)
9.8 9.9 9.2 7.9 8.0 6.7 5.9 5.5
Infl ation (average annual rate in % against previous year)
5.6 3.1 4.4 5.9 4.3 5.9 6.5 5.4
Note: * Estimated fi gures.
1.1 Digital Take-up
1.1.1 Digital Equipment
Economic growth and the reduction in economic inequality have led to an in-crease in purchasing power for the average Brazilian, enabling a higher con-sumption of durable goods, including higher technology equipment (television sets, mobile phones, and PCs).
Television sets were the most widespread media content devices in Brazil in 2011, and were found in 98.3 percent of households. Radio sets were also widely present, especially if we consider that the number of radio sets per household does not account for the reception of radio broadcasts in cars, and via mobile phones and PCs. While the proportion of radio and television sets has remained almost the same over recent years, the number of PCs has grown substantially; even so, they were still the least widespread of these devices, and were found in only 45 percent of households in 2010.
1.1.2 Platforms
While terrestrial radio and television are still the main media platforms in Brazil, there have been changes in audience distribution due to growth in access to pay-TV, the internet, and — much less substantially — digital television.
Subscriptions to pay-TV, via cable or satellite, have been growing sub-stantially over the past year (see section 5). In November 2011, direct-to-home (DTH) satellite reception was responsible for 55 percent of subscriptions, Multi-point Multichannel Distribution System (MMDS) for 2 percent, and cable recep-tion for 43 percent.12 The pay-TV market is heavily concentrated, and is
domi-nated by two companies: NET Brasil and SKY. Other players — such as Oi, GVT, and Telefónica — have entered the market offering triple play packages (televi-sion, internet, and telephone), but this has not affected market concentration.
MAPPING
DIGITAL
MEDIA
: BRAZIL
Table 2.
Households owning equipment, 2005—2011
2005 2006 2007 2008 2009 2010 2011
No. of HH (’000)
% of HH No. of HH (’000)
% of HH No. of HH (’000)
% of HH No. of HH (’000)
% of HH No. of HH (’000)
% of HH No. of HH (’000)
% of HH No. of HH (’000)
% of HH
TV sets 49,393 91.3 51,554 92.8 53,137 94.2 55,412 97.0 56,381 97.8 57,048 98.1 57,665 98.3
Radio
sets 47,553 87.9 48,720 87.7 49,527 87.8 50,670 88.7 49,290 85.5 49,778 85.6 n/a n/a
PCs 10,008 18.5 12,277 22.1 14,948 26.5 17,823 31.2 18,620 32.3 20,295 34.9 26,398 45.0
Note: HH: households; n/a: not available.
Concerning the transition to digital television, the Brazilian System of Ter-restrial Digital TV (SBTVD-T) was established by Decree 4901/06,13 and its
gen-eral guidelines can be found in Decree 5820/06,14 which has adopted the
Japa-nese Integrated Services Digital Broadcasting — Terrestrial (ISDB-T) standard. Digital television transmissions started on 2 December 2007, exclusively in the city of São Paulo, and the latest data on the coverage of digital television were
released in May 2012 by the National Telecommunications Agency (Agência
Na-cional de Telecomunicações, Anatel). According to this source, digital television
covers 508 municipalities (of which 52 have digital television services in opera-tion, which reach the remaining areas), accounting for 89.2 million people (46.8 percent of the population) and 31.3 million households (46.4 percent).15 The
tran-sition perio d from analog to digital is expected to end between 2015 and 2018. Some problematic issues have emerged in the context of the transition from analog to digital, such as pricing and content diversity. Even though there has been a decrease in the price of set-top boxes (STBs), from US$ 300 to US$ 100—150, this is still a very high price for a country like Brazil, in which — recent improvements in social welfare notwithstanding — inequality of income distri-bution still remains a problem. Digital broadcasting, furthermore, requires tele-vision sets that only a small percentage of the population can afford. Moreover, digital broadcasting has not increased diversity in free-to-air (FTA) television; content production remains at the same level as in the analog era, and interac-tivity remains a promise (see section 1.2.2) (Table 3).
Even though they were present in only 45 percent of households in 2011, PCs represent the main access point to the internet, according to the Brazilian Internet Steering Committee (Comitê Gestor da Internet no Brasil, CGI),16 and
the number of households with internet access grew from 13 percent of the population in 2005 to 40 percent in 2012. The number of handsets, however, has been growing consistently. According to Anatel, the total number of mobile phones in Brazil reached 262.3 million in January 2013, 80.4 percent of which were on prepaid plans; only 51.5 million (less than 20 percent) had data plans.17
The high percentage of mobile phone subscriptions, exceeding the total Brazil-ian population in 2013, is due to the fact that interconnection costs are very ex-pensive, and companies tend to offer much cheaper rates for calls made within
13 See http://www.planalto.gov.br/ccivil_03/decreto/2003/D4901.htm (accessed 26 Sep-tember 2013).
14 See http://www.planalto.gov.br/ccivil_03/_Ato2004-2006/2006/Decreto/D5820.htm (accessed 26 September 2013).
15 Anatel, 2012.
16 Brazilian Internet Steering Committee (Comitê Gestor da Internet, CGI), “Research about information and communication technologies in Brazil”, 2005—2010 (hereafter, CGI, “Re-search about ICT in Brazil”).
MAPPING
DIGITAL
MEDIA
: BRAZIL
Table 3.
Platforms for the main TV reception and digital take-up, 2005—2010
2005 2006 2007 2008 2009 2010
No. of HH (’000)
% of TV HH
No. of HH (’000)
% of TV HH
No. of HH (’000)
% of TV HH
No. of HH (’000)
% of TV HH
No. of HH (’000)
% of TV HH
No. of HH (’000)
% of TV HH
Terrestrial reception* 49,393 91.3 51,554 92.8 53,137 94.2 55,412 97.0 56,381 97.8 56,989 98.0
— of which digital 0 0 0 0 n/a
Cable reception** 2,511 5.0 2,842 5.5 3,228 6.0 3,811 6.8 4,314 7.6 4,980 8.7
— of which digital n/a
Satellite reception* 1,437 2.9 1,479 2.9 1,762 3.3 2,091 3.8 2,779 4.9 n/a n/a
— of which digital n/a
IPTV*** 0 0 0 0 0 0 0 0 0 0 0 0
Total**** 53,341 107.0 55,875 108.0 58,127 109.0 61,314 110.0 63,474 112.0 n/a n/a
— of which digital n/a
Note: HH: households; TV HH: TV households; n/a: not available.
their own networks. This provides an incentive for consumers to subscribe to more than one carrier simultaneously.
Within this context, “LAN houses” have emerged as an alternative for the lower-income members of the population to have access to information, knowl-edge, and culture, and act as a major driving force for bridging the digital di-vide.18 According to the CGI,19 in the past few years LAN houses were the main
point of internet access for Brazilian users, but in 2012 they occupied the fi fth place, accounting for 19 percent of access and mostly concentrated within low income groups: 40 percent of the population earning less than the minimum wage access the internet through these venues.
It is important to stress, however, that even though internet penetration in Brazil is relatively low, due to its sizable population Brazil represents the eighth largest internet audience in the world, and the largest internet population in Latin America. Recent data from Ibope/NetRatings reveal that Brazil had 79.9 million internet users by the end of 2011, a growth of 8 percent from the previ-ous year. 20 The growth of internet access in households during 2011 was about
18 percent.
According to a Huawei study on broadband internet access in Brazil, a growth in mobile connectivity was the driver for the increase in the number of broadband connections in 2012, mainly through smartphones (89.6 percent) and the 3G network.21 In 2012, almost 53 percent of all cell phones in Brazil had
mobile 3G internet connection, an increase of 58 percent in comparison with 2011. In the same period, all the municipalities in Brazil had coverage for cell phone networks, according to Telebrasil, with 40.7 percent of them covered by at least four companies. Nonetheless, access to fi xed broadband is still an issue, and even its defi nition in the National Broadband Plan (see section 7) has been controversial in a country where broadband access is a luxury that many can-not afford. In April 2013, Brazil started to implement the 4G network for mobile cellphones (working on the 2.500 MHz frequency), in order to meet the de-mands of the FIFA Confederations Cup. The government intends to implement the technology in the cities that will host the 2014 World Cup by December 2013. Anatel has even created a webpage with regulatory orientations for the
18 LAN stands for “local area network”. LAN houses are commercial providers of online con-nectivity operating somewhat like cybercafés — except without serving coffee.
19 CGI, “Research about ICT in Brazil”, 2011.
20 V. Aguiari, “PNBL e 3G fazem número de brasileiros online chegar a 79,9 milhões” (PNBL and 3G make number of online Brazilians reach 79,9 million). Info, 10 April 2012, at http://info.abril.com.br/noticias/internet/brasil-fecha-2011-com-79-9-mi-de-internau-tas-10042012-29.shl (accessed 26 September 2013).
mega events, providing relevant information about dates and processes over
the coming months related to broadcasting and telecommunication.22
Table 4.
Internet subscriptions and mobile telephony, 2005—2012
2005 2006 2007 2008 2009 2010 2011 2012
Internet (% of households) 13.0 14.0 17.0 20.0 27.0 31.0 38.0 40.0
— of which broadband (% of households with internet subscriptions)
— 40 50 58 66 68 68 67
Mobile telephony (density) 46.8 53.6 64.2 79.2 90.5 104.7 123.9 132,7
— with internet access
(3G), in millions 0 0 0 1.7 4.1 14.6 33.2 52.5
Sources: CGI, “Research about ICT in Brazil”, 2005—2012; Telebrasil (Brazilian Telecom-munications Association), 2013.
Figure 4.
Households with internet access, urban areas and in total (%), 2005—2012
13 14 17
20
27
31
43 44
18
24 27
38 40
0 5 10 15 20 25 30 35 40 45 50
2005 2006 2007 2008 2009 2010 2011 2012
Urban area Total
Source: CGI, “Research about ICT in Brazil”, 2005—2012.
The Brazilian government intends to switch off the analog television ser-vices of at least 1,600 municipalities between 2015 and 2018, changing the
vious decision to switch off in 2016. According to the Communications Minister, Paulo Bernardo, the process should start with the largest cities and metropoli-tan areas.23
1.2 Media Preferences
1.2.1 Main Shifts in News Consumption
While digital take-up has changed news consumption habits to some degree — particularly for those with access to broadband internet — traditional platforms such as terrestrial television and radio are still the main source of news for Brazil’s population. According to a national survey by the Brazilian Secretariat of Social Communication (Secretaria de Comunicação Social da Presidência da
República, Secom), 96.6 percent of Brazilians frequently watched television in
2010, and 80.3 percent listened to the radio.24 Of those who watched television,
83.5 percent only watched FTA television, a result that refl ects the low level of penetration of pay-TV.
Figure 5.
Preferences for FTA and pay-TV (% of total viewers), 2010
2.7 3.4
10.4
83.5
Only pay-TV Does not watch TV FTA TV and pay-TV Only FTA TV
Source: Secom, Relatório de Pesquisa Quantitativa, March 2010.
23 E. Rodrigues, “Sinal analógico será desligado a partir de 2015” (Analog service will be switched off in 2015). O Estado de São Paulo, 31 July 2013, at http://www.estadao.com.br/ noticias/impresso,sinal-analogico-sera--desligado-a-partir-de-2015--,1059065,0.htm (ac-cessed 31 July 2013).
The FTA television audience, however, is in decline, as viewers migrate to other platforms and media outlets. According to Ibope, between 2000 and 2009 the average percentage of television sets turned on during primetime fell from 66 percent to 59 percent, and the fi ve biggest broadcasters of the country lost, as a group, 4.3 percentage points in the ratings. The deployment of digital television has not changed the content offer from the perspective of audiences. Although the technical quality has improved, broadcasters have so far failed to take advantage of the possibilities represented by digitization, and no investment has been made to increase the number of free channels, or to diversify content in any way.25
Figure 6.
Audience evolution of pay-TV (ratings), 2005—2010
2.5
2.8 2.7 2.8
3.8
4.5
0 0.5 1 1.5 2 2.5 3 3.5 4 4.5 5
2005 2006 2007 2008 2009 2010
Source: Ibope, average data from 2010.26
According to Ibope ratings, television sets are being used for functions other than watching FTA television, and this would explain, at least partially, the decline in its viewership. The number of television sets used for watching cable television, playing videogames, DVDs etc. had a growth rate of 91 percent compared with 2000. According to the National Telecommunications Agency
25 Interview with João Brant, executive coordinator on the board of Intervozes, São Paulo, 4 August 2011.
(Anatel), the total number of pay-TV viewers rose from 200,000 in 2000 to 3.4 million in 2010. Ibope audience data are consistent with this increase.
Most importantly, the growth of the internet appears to be a pivotal cause of the decline in FTA television. According to research carried out by F/Nazca,27
a signifi cant proportion of Brazilian internet users say they have abandoned some forms of traditional media for the internet.
Furthermore, the internet ranks as the second preferred source for news consumption among Brazil’s online population.
Figure 7.
Preferred news consumption platforms (% of online population), 2011 and 2012
65
19
7
5
1 62
20
8
6
2 0
10 20 30 40 50 60 70
TV Internet Radio Newspapers Magazines
2011 2012
Source: F/Nazca, “F/Radar”, 11th edition, 2012.
Television is still the preferred news consumption platform for most of the population, but when we analyze this consumption by age, the internet is the preferred platform among Brazilians aged 12—15 and/or people with a college degree. Figure 8 shows consumer preferences in relation to traditional media among users of mobile internet devices, and it is interesting to note that more than half of tablet users prefer to read newspapers and magazines online.
Figure 8.
Preferred traditional (offl ine) media among mobile internet users (%), 2012
20
14
9 8
7 55
25 25 27
0 10 20 30 40 50 60
Prefers to read newspapers and magazines online
instead of paper edition
Prefers to listen to the radio online
instead of regular radio
Prefers to watch news, films, soap operas etc. online
instead of watching on TV
Prefers to see a movie online over going to the cinema
or buying it
Prefers to read a book online instead
of paper edition 21
Mobile Tablet
Source: F/Nazca, “F/Radar”, 11th edition, 2012.
1.2.2 Availability of a Diverse Range of News Sources
Brazil has four major television broadcasters, which have traditionally been owned by the same organizations throughout the years, and which are respon-sible for the top news programs: Organizações Globo, owned by the Marinho family; Sistema Brasileiro de Televisão (SBT), owned by Silvio Santos; Record, owned by Bishop Edir Macedo, founder of Igreja Universal do Reino de Deus (Universal Church of the Kingdom of God); and Rede Bandeirantes, owned by the Saad family. All of them also host content on multiple media platforms, be-sides television, including radio, newspapers, magazines, and websites.
Organizações Globo is the largest media conglomerate of Latin America, controlling (directly or through local owned affi liates and regional networks)
340 media outlets, more than SBT and Rede Record put together.28 This
con-glomerate is the owner of Rede Globo, which in 2012 was the second largest
commercial television network in the world — by commercial income29 — and
the leader in the national television ratings, due mostly to its internationally famous soap operas, but also for its news and sports programming. In 2010, Globo commanded almost 70 percent of the viewership in Brazil, dwarfi ng its nearest competitor, Record, which captured just 13 percent.30
Organizações Globo is also the most important player in the pay-TV fi eld. It owns Globosat, the largest provider of pay-TV channels in Latin America, which has joint ventures with Twentieth Century Fox, Universal Studios, Metro-Goldwyn-Mayer, Paramount Pictures, and NBC Universal. Globo News, the fi rst 24-hour news channel on Brazilian television, is a Globosat channel. Organiza-ções Globo also owns many other media enterprises, such as radio stations, newspapers, magazines, book publishers, music labels, and movie production companies. Among these, one of the most relevant is CBN (Central Brasileira
de Notícias), the country’s biggest radio network, with affi liates around the
country.
Over 64 percent of the respondents in a 2010 survey of television viewers
— an overwhelming majority — watched news programs as their fi rst
prefer-ence. The second most popular genre were soap operas, at around 16 percent, followed by sports, fi lms, talkshows, and children’s television.31
Among internet users, search engines are mentioned as the main source for news, with social networks coming a close second. However, social network usage varies depending on age (see section 3).
Regardless of redirection through social networks, the number of unique visitors to the websites of traditional newspapers has been on the rise since 2005. The total combined number of unique visitors to Brazilian newspaper websites rose from 4.2 million in January 2005 to over 18.4 million in the same month in 2011.32 In parallel, the number of newspaper subscriptions for mobile
phones increased by more than 100 percent between 2005 and 2010, from 86,210 to 202,900.33
29 H. Tolipan, “Globo sobe em ranking e torna-se segunda maior emissora do mundo!” (Globo rises in ranking and becomes second largest broadcaster in the world!). Jornal do Brasil, 9 May 2012, at http://www.jb.com.br/heloisa-tolipan/noticias/2012/05/09/globo-sobe-em-ranking-e-torna-se-segunda-maior-emissora-do-mundo (accessed 2 October 2013). 30 Secom, Relatório de Pesquisa Quantitativa, March 2010.
31 Secom, Relatório de Pesquisa Quantitativa, March 2010.
32 Newspapers National Association via Ibope Nielsen Online, at http://www.anj.org.br/a-industria-jornalistica/jornais-no-brasil (accessed 15 June 2011).
Figure 9.
Main online news source among internet users (% of internet users), 2010
55
51
37
33
25
20
7
0 10 20 30 40 50 60
Search
engines networksSocial Web portals websitesNews Websites ofprint publications
Broadcast station websites
Blogs
Note: Users aged 12 or older.
Source: F/Nazca, “F/Radar”, 7th edition, April 2010.
1.3 News Providers
1.3.1 Leading Sources of News
1.3.1.1 Television
The infl uence and popularity of Rede Globo is undeniable, even though it has
been consistently losing audiences over the past fi ve years. Rede Record,
Table 5.
Annual average TV audience by broadcaster, primetime (% of total households), 2005—2010
Television station 2005 2006 2007 2008 2009 2010
Globo 35.5 35.5 31.1 29.2 29.6 27.6
Record 5.9 7.3 8.8 10.4 9.5 9.5
SBT 10.1 7.8 6.8 7.3 6.2 5.9
Bandeirantes 2.8 3.0 3.0 3.0 3.3 3.1
Rede TV! 1.7 1.5 1.6 1.8 2.1 1.9
Pública 0.6 0.6 0.7 0.6 0.5 0.5
MTV 0.3 0.2 0.2 0.2 0.1 0.2
Source: Ibope, 2011.
Audiences for cable television reveal a strong presence for sports and sports news channels, with Globosat’s SporTV remaining constantly at the top of the audience rankings over the past fi ve years. SporTV, ESPN Brasil, and ESPN also rank high. Globosat’s news channel Globo News is the only general
news channel among the top fi ve, although its audience has been declining
steadily since 2005. Globosat’s educational channel Futura and Bandeirantes’s Band News are closely followed by two public television channels, TV Câmara and TV Senado, which provide coverage of legislative news and broadcast leg-islative sessions of the two houses of Brazil’s National Congress.
Table 6.
Annual average TV audiences using pay-TV channels during primetime (% of households with cable TV), 2005—2010
Television station 2005 2006 2007 2008 2009 2010
SporTV 0.70 0.71 0.54 0.59 0.67 0.66
Globo News 0.68 0.54 0.42 0.33 0.39 0.37
SporTV 2 0.22 0.25 0.18 0.17 0.19 0.22
ESPN Brasil 0.24 0.24 0.19 0.18 0.18 0.15
ESPN 0.18 0.17 0.11 0.12 0.11 0.11
Futura 0.08 0.07 0.07 0.08 0.10 0.08
Television station 2005 2006 2007 2008 2009 2010
TV Câmara 0 0 0 0.01 0.04 0.05
TV Senado 0.07 0.07 0.06 0.04 0.04 0.03
BandSports 0.02 0.04 0.02 0.02 0.02 0.03
TV Justiça 0 0 0 0 0.01 0.03
Canal Rural 0.03 0.02 0.02 0.02 0.01 0.01
CNN 0.03 0.02 0.01 0.01 0.01 0.01
Source: Ibope, 2011.
1.3.1.2 Radio
Radio is an important source of news consumption, being present in 79 percent of households in 2012, according to the CGI. Among upper income groups, the penetration is larger (94 percent), decreasing in lower income groups (64 per-cent). According to Anatel, in 2011 Brazil had a total of 4,018 radio broadcast-ers, distributed regionally: 301 in the North, 950 in the Northeast, 1,409 in the Southeast, 943 in the South, and 415 in the mid-West. Radio still holds a promi-nent position as a news source, but its use has decreased in recent years. It is important to highlight that some research only takes account of the equipment owned by households, ignoring the fact that some of the population listens to the radio in cars or on mobile devices.
Figure 10.
Households with radio equipment (%), 2008—2012
87
86 86
80
79
74 76 78 80 82 84 86 88
2008 2009 2010 2011 2012
Figure 11.
Evolution of radio penetration, percentage of population over 10 years old, 2000—2010
88 87 89 90 90 89 87 86
82 80
78
57 55 60 60 60 59 55
52
46 43 43
0 10 20 30 40 50 60 70 80 90 100
2000 2001 2002 2003 2004 2005 2006 2007 2008 2009 2010
Listened to the radio once a week Listened to the radio yesterday
Source: Mídia Dados, 2011.
Regarding the modulation frequencies, Brazil still uses amplitude modula-tion (AM) broadcasting, initiated in 1923 by Roquette Pinto. AM radio is known for its low transmission quality and susceptibility to interference. The govern-ment therefore intends to migrate all the AM signals to the part of the spec-trum already used by frequency modulation (FM) broadcasting, in response to a demand from the Brazilian Association of Radio and Television Broadcasters
(Associação Brasileira de Emissoras de Rádio e Televisão, Abert) and the states
associations of broadcasting. This process is set to begin with the smallest mu-nicipalities, migrating the AM broadcasters to the range between 76 and 88 MHz, right next to the FM range (88—108 MHz), but this depends on the imple-mentation of digital television.34
While digital television is slowly increasing its take-up, digital radio is far from becoming a reality in Brazil; for years, the country has been trying to decide which standard it is going to choose for digital radio. For now, two standards are under discussion: IBOC (In-Band On-Channel), a proprietary pattern that per-mits the transmission of analog and digital radio signals simultaneously on the same frequency; and DRM (Digital Radio Mondiale), an open standardized digital
broadcasting system intended for the bandwidth currently used for AM broad-casting in particular. Only in 2012 did the Ministry of Communications (Ministério
das Comunicações, MiniCom) create a Consultant Council to discuss this
ques-tion. As well as being delayed, the policy debate is unbalanced, privileging com-mercial interests and weakening efforts toward a more democratic and popular digital radio platform. Tests using these two standards have been performed by the Ministry of Communications in certain municipalities to evaluate their per-formance under different conditions of both propagation and occupation of the available spectrum. The most recent test was carried out in São Paulo in June and July 2012.
Today, however, a wide variety of stations have recently become acces-sible through digital platforms, either through computers or mobile phones. This mode of access to radio is quite signifi cant in the 16—24 age group, but also high among Brazilians aged 25—49.
Figure 12.
Penetration of AM and FM broadcasting (%), by age group, 2010
10 to 14 15 to 19 20 to 29 30 to 39 40 to 49 50 to 64 more than 65
AM FM AM or FM
7 9
12
17
26
36
44 74
80 80
76
72
59
36 75
81 82
79 79
74
64
0 10 20 30 40 50 60 70 80 90
Table 7.
Platforms for listening to the radio, by age group, 2010
Usually listen to:
Age (%)
Total 16-24 25-39 40-49 Over 50
FM radio 82.3 76.6 71.3 60.8 73.5
AM radio 20.4 27.1 34.7 44.1 30.7
— by internet 19.0 9.5 5.0 2.9 9.6
— by mobile 33.7 18.8 8.6 4.6 17.6
Source: Abert, “Radiodifusão — Uma abordagem numérica 2010”.
1.3.1.3 Print Media
Even with some oscillations in the consumption of print newspapers over the last fi ve years, the ranking of Brazil’s biggest newspapers shows the same me-dia outlets competing for the top positions, with not much variance.
Table 8.
Brazil’s biggest newspapers by paid circulation (copies per day), 2008—2012
Title Publisher 2008 2009 2010 2011 2012
Super Notícias Sempre Editora S/A 303,087 289,436 295,701 293,572 296,799
Folha de S. Paulo Empresa Folha
da Manhã 311,287 295,558 294,498 286,398 297,650
Extra Infoglobo 287,382 248,119 238,236 265,018 209,556
O Estado de São Paulo
O Estado de São
Paulo S/A 245,966 212,844 236,369 263,046 235,217
O Globo Infoglobo 281,407 257,262 262,435 256,259 277,876
Zero Hora Zero Hora Editora
Jornalística S/A 179,934 183,521 184,663 188,561 184,674
Daqui Organização Jaime
Câmara n/a n/a 90,342 163,568 159,022
Diário Gaúcho Zero Hora Editora
Jornalística S/A 166,886 146,885 150,744 155,853 166,221
Correio do Povo Empresa Jornalística
Caldas Júnior 155,569 155,131 157,409 149,260 149,562
Title Publisher 2008 2009 2010 2011 2012
Aqui Diários Associados n/a n/a 125,676 120,757 39,074
Expresso
da Informação Infoglobo n/a n/a 84,285 93,269 67,181
Agora São Paulo Empresa Folha da
Manhã n/a n/a 92,863 91,828 92,046
Dez Minutos Editora Ana Cássia
Ltda. n/a n/a 83,210 89,741 91,498
Lance! Arete Editorial S/A 113,715 125,050 94,683 84,983 80,238
Note: n/a: not available.
Source: Instituto Verifi cador de Circulação (IVC), Newspapers National Association.35
The average daily circulation for 2012, as shown in Table 8, is more than 8 million. Certainly, this is a small number if we compare it with the total popula-tion in Brazil. Newspaper subscrippopula-tions are not cheap compared with the level of the minimum wage, for example, and because some parts of the population prefer other platforms such as television and internet to read news in real time and also have some interaction (you can comment on news or share news with your social networks). Newspapers are preferred by older people and by those who can afford this practice.
The above ranking includes both tabloids and broadsheet newspapers. The main quality newspapers in the country are Folha de S. Paulo, O Globo, O Estado
de São Paulo, and Zero Hora. In 2010, Folha de S. Paulo, the top ranking
news-paper since 1986, ceded fi rst place to a popular newspaper, Super Notícias, from the State of Minas Gerais, but recovered it in 2012, with a growth of 4 percent. Other popular newspapers also appear in the ranking: like Meia Hora, edited by publishers owned by Empresa Jornalística Econômico S.A. (Ejesa). Extra is a low budget, popular newspaper from Infoglobo (publisher of O Globo). The tabloids
Correio do Povo and Diário Gaucho have signifi cant circulations, but are mostly
focused on local news from the State of Rio Grande do Sul. The soccer
newspa-per Lance! is the only topic-specifi c media outlet appearing among the top 15.
Editora Abril has fi ve magazines among the most read weeklies in Brazil:
Veja and Veja São Paulo, Ana Maria, Viva Mais, and Contigo. The weekly news
magazine Época is owned by Organizações Globo, while IstoÉ is published by Editora Três, and is partially owned (30 percent) by the Terra Network, the big-gest online media enterprise in Latin America and part of the Telefónica Group.
Figure 14 illustrates the dominance of Veja over the other magazines, with more than twice the average circulation of the second most read magazine.
Figure 13.
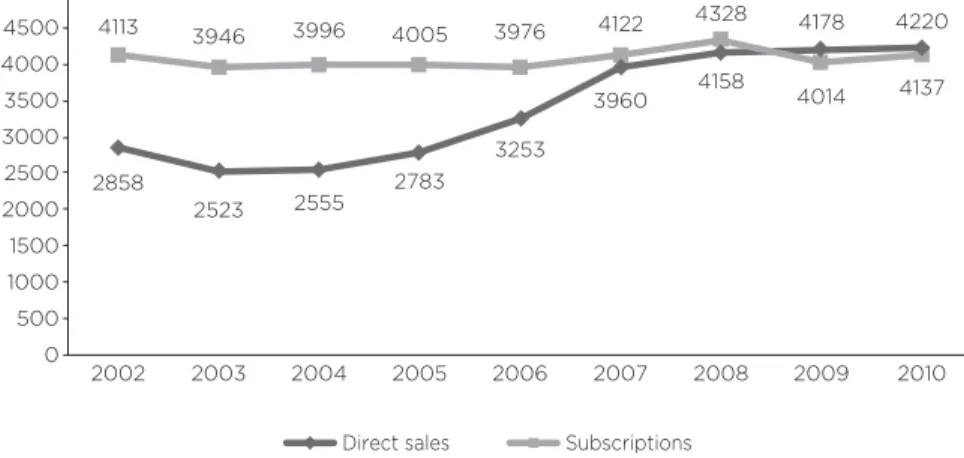
Average daily paid circulation of major newspapers (in ’000 copies), 2002—2010
Direct sales Subscriptions 2858
2523 2555
2783 3253
3960 4158
4178 4220
4113 3946 3996 4005 3976 4122 4328
4014 4137
0 500 1000 1500 2000 2500 3000 3500 4000 4500 5000
2002 2003 2004 2005 2006 2007 2008 2009 2010
Source: Instituto Verifi cador de Circulação (IVC), in “Panorama da comunicação e das telecomincações no Brasil” (Panorama of Communications and Telecommunications in Brazil), 2011—2012, Institute of Applied Economic Research (Instituto de Pesquisa Econômica Aplicada, Ipea).
Figure 14.
Most read weekly magazines (in ’000 copies), 2009—2011
Veja Época IstoÉ Veja São Paulo
Caras Ana Maria Viva Mais Contigo
2009 2010 2011
1097.5
413.3
344.0 307.3
293.4
227.5 231.1
147.4
1086.2
408.1
338.9 313.7 335.2
229.3 235.1
160.4
1076.0
399.5
330.8 316.1 357.6
226.9 213.5
173.6
Figure 15.
Average circulation of magazines, per year (in ’000 copies), 2000-2009
277 287
267
244 236 223 239 229 242 249
170 167 168 164 163 164 161 161 168 173
0 50 100 150 200 250 300 350
2000 2001 2002 2003 2004 2005 2006 2007 2008 2009
Direct sales Subscriptions
Source: Instituto Verifi cador de Circulação (IVC), in Ipea, “Panorama da comunicação e das telecomincações no Brasil”, 2011—2012.
Recently, the country has faced what has been called a crisis in print me-dia, mainly because of the discontinuation of many printed magazines from Editora Abril (such as Playboy, Contigo, Alfa, Bravo!, Gloss, and Lola) and the
dismissal of more than 150 employees in August 2013; even Veja, the
maga-zine with the highest circulation in Brazil, suffered cuts. Previously, in March 2013, Caros Amigos magazine, well known for its leftist approach, fi red an en-tire team of journalists who were striking for better conditions, and who were also protesting against the decision to make budgetary cuts throughout the organization.36 These cases reignited the debate about the precarious working
conditions for journalists, and the role of print media in contemporary Brazil.
1.3.1.4 Online
Brazil’s most accessed website with news content is the portal UOL, which also hosts the web edition to Folha de S. Paulo, as well as other news sources, and attracted 50 million unique visitors in January 2012. The portal phenome-non in Brazil differs from that in other Latin American countries, since Brazilians were forced for many years to pay for a “content provider” on top of paying for their preferred ISP, which fueled the portals, such as UOL and Terra (5th
most accessed). MSN, Globo.com, and Yahoo! were roughly in the same range (32—46 million visitors), with a considerable advantage over iG and its 16 mil-lion unique visitors, and Abril and R7 with 12 milmil-lion each.
Despite the fact that these portals host content for some of the most wide-ly read print newspapers and magazines (or the websites for these publica-tions, including Folha de S. Paulo, O Globo, and Veja), they also provide email, Instant Messaging (IM), and social networking functionality, among other ser-vices. Not all of the traffi c to these sites can be said to be news-oriented. That is only true for dedicated news websites such as Estadao.com.br, the website for the newspaper O Estado de São Paulo, and the Lance! sports news website.
This ranking refl ects the dominance of media conglomerates in the online news market. UOL is owned by Grupo Folha, Globo.com is the web portal for Organizações Globo, MSN is a Microsoft property, Terra Brasil is the Brazilian portal of Terra Networks, part of the Telefónica Group. Abril.com is owned by Grupo Abril. R7 is owned by Rádio e Televisão Record.
Table 9.
Top 15 internet news websites, by unique visitors, January 2012
Site Unique visitors (million)
Uol.com.br 50
Msn.com 46
Globo.com 38
Yahoo.com 32
Terra.com.br 28
Ig.com.br 16
R7.com 12
Abril.com.br 12
Bol.uol.com.br 8.9
Oglobo.globo.com 7.5
Estadao.com.br 4.2
Mundodastribos.com 4.2
Lancenet.com.br 3.2
Clicrbs.com.br 3.1
Dihitt.com.br 0.8
1.3.2 Television News Programs
Journalism in FTA television is clearly dominated by Rede Globo. Besides broad-casting Jornal Nacional (National Journal), the main news bulletin in the coun-try, all the other bulletins quoted below belong to Rede Globo’s daily schedule. Nevertheless, since 2005 all the news bulletins from Rede Globo have shown declines in audience numbers. In 2010, Jornal Nacional registered the worst ratings in its history. The digital switch-over was not a factor, since digital television is still in its early stages in Brazil, and it broadcasts the same con-tent as analog television. And in contrast to some newspapers, television news broadcasters have not developed websites with a content offer distinct from the conventional platform (see section 6.3.1). It is worth noting that almost all the news bulletins with higher viewership belong to Organizações Globo.
Figure 16.
News bulletins with the highest ratings (% of total households),37 2005-2010
2005 2006 2007 2008 2009 2010
Jornal Nacional Praça TV 2nd Ed.
Globo Notícias Jornal Hoje
Praça TV 1st Ed. Jornal da Globo 0
5 10 15 20 25 30 35 40
Source: Ibope, Media Workstation.
More recent data shows sharp declines in audience for the top rating news bulletins.
Table 10.
Changes in audience ratings of news bulletins in 2012 and 2013
News bulletins Audience rating (%)
Jornal Nacional (Globo) -12
SPTV 2nd Edn (Globo) -10
Jornal da Globo (Globo) -11
Brasil Urgente (Band) -18
Jornal da Band (Band) -12
SBT Brasil (SBT) -3
Jornal do SBT (SBT) -6
RedeTV News (Rede TV!) -41
Jornal da Record (Record) +2
Cidade Alerta (Record) +6
Source: Ibope, January-August 2012 and January-August 2013.38
1.3.3 Impact of Digital Media on Good-quality News
Since the internet became the second main platform for news consumption, Brazilian audiences are defi nitely on the path to a larger number of sources and a greater variety of ways to experience news content. This has delivered new tools and opportunities for minority groups and independent media (see sec-tion 4.3.3), and an autonomous source of news for the section of the population with internet access.
The impact of digital media on the quality of news, however, is unclear. The same group of media conglomerates that dominates traditional news plat-forms also attracts the majority of internet users in Brazil, and the type of con-tent provided by these conglomerates remains mostly the same.
1.4 Assessments
The full implementation and wide adoption of digital broadcasting will take a considerable period of time, but it is safe to say that the switch from ana-log to digital broadcasting will not facilitate a greater variety of ownership or content and dilute concentration in the sector. There have not been any ob-servable changes in news offer and choice on television as a result of digital
broadcasting. Additionally, interactivity in television broadcasts, despite the hype surrounding Brazilian “Ginga” middleware (see section 7.1.1.1), is still only a promise, and the same is true of multicasting and a greater variety of televi-sion channels. As digital switch-over approaches, the freed 700 MHz band will be auctioned to telecommunications companies.
The impact of digitization in Brazil is more evident when one looks at inter-net use, rather than the country’s still embryonic digital broadcasting industry. Even though the digital divide remains wide, Brazil has a massive number of internet users, representing the largest internet population in Latin America. Television remains the main platform for news consumption, but there have been meaningful audience fl uxes in the past fi ve years. Audience numbers for FTA television are declining in parallel to an increase in pay-TV subscriptions; the internet population is on the rise, and is still far from reaching a plateau. The internet’s potential for cannibalizing television audiences as a competing source for news and entertainment should not be underestimated.
The overall news offer and choice are certainly more varied and compel-lingly richer in the online environment. Nevertheless, when we look at audience rankings for websites in Brazil, it is clear that the same media conglomerates that dominate the traditional media are currently the main players in the mar-ket. Independent media and a wealth of user-generated content (UGC) do ex-ist, but audiences fl ock to websites that are controlled by the most powerful incumbent players, such as Organizações Globo, Grupo Folha, Grupo Abril, and Record. These players’ business models may be in a state of rupture, but they have so far been very fl exible in adapting to a digital scenario, at least as far as maintaining a grip on audiences is concerned.
The immense infl uence historically exerted by Organizações Globo over
Brazil’s culture and politics needs to be stressed. Globo has an extremely wide reach, with signifi cant ratings on all platforms, including both FTA and pay-TV, newspapers, radio stations, magazines, and web platforms. While the news bul-letin Jornal Nacional’s audience may be in decline, everything points to Globo maintaining its position as a communications giant in the online environment.
2.1 Public Service and State Institutions
2.1.1 Overview of Public Service Media; News and Current Affairs Output Commercial interests have dominated Brazilian media from the beginning, leaving little opportunity for the development of non-commercial, public ser-vice media. What passes for public serser-vice broadcasting in Brazil nowadays is part of a convoluted, fl awed system, weak in reach and audience share, and rife with identity issues.This system comprises:
• the federal government’s TV Brasil (national) and eight radio stations
(regional), managed by the Brazil Communication Company (Empresa
Brasil de Comunicação, EBC);
• broadcasters operating under educational radio or television licenses, maintained by states, municipalities, universities, and private foundations; • some of the “basic free-use channels” that have been established,
through legislation, as must-carry channels for subscription television providers, including channels created by the federal and local legislative houses, the Brazilian supreme court, universities, and non-governmental organizations (NGOs);
• community radio stations.
During the early years of radio broadcasting, experimentation with both commercial and non-commercial models took place, but commercial radio emerged victorious when the sector was fi rst regulated. In 1931 and 1932,39
President Getulio Vargas positioned the state mainly as licensing authority and content regulator.
The fi rst broadcaster, Rádio Sociedade do Rio de Janeiro (still operational today as Radio MEC), founded in 1923 by Edgard Roquette-Pinto, was donated to the Ministry of Education and Culture in 1936, and consequently became the
fi rst state broadcaster.40 The fi rst major state broadcaster, however, was Rádio
Nacional do Rio de Janeiro, founded by Organizações Victor Costa in 1936. Rádio Nacional was taken over by the Getulio Vargas administration in 1940, and used as a propaganda tool during Vargas’s dictatorial Estado Novo regime (1937—1945), but it operated just like a commercial broadcaster, extracting most of its revenue from advertisements. It remained the foremost Brazilian broadcaster until the early 1950s, but lost its standing and infl uence thereafter.
The arrival of television occurred in the midst of a broadcasting system that was already fully dependent on advertising as its main source of revenue. Intimate relationships between government and broadcasting, however, re-mained a staple of the sector. The media conglomerate Organizações Globo has fl ourished through associations with the government, including during the military dictartoship years (1964-1985). TV Globo, founded in 1965, transmitted the fi rst program with national coverage, Jornal Nacional (National Journal), in 1969, using infrastructure built by the military.41
The fi rst major attempt at creating a public service broadcasting system began under military rule with Decreto-Lei (Executive Order) 236 of 1967, which created a new category of broadcast license for non-commercial radio and television, conceived as a tool for mass public education, granted to gov-ernments at the federal and state levels, universities, and foundations.42 The
de-cree was guided by a very limited idea of educational television, strictly based on the transmission of lectures, speeches, and debates; the concept of “edu-cational” broadcasting, however, was widened by broadcasters themselves to include cultural and journalistic content.
Almost every Brazilian state created its own educational broadcasting service in the following years, under the control and supervision of the federal government’s Fundação Centro Brasileiro de TV Educativa (FCBTVE).43 The non-commercial
na-ture of educational licenses was eventually mitigated in 1986 with the Sarney Law,44
40 J. Valente, “Sistema Público de Comunicação do Brasil” (Public Communication System in Brazil). In Intervozes, “Sistemas Públicos de Comunicação no Mundo: Experiências de Doze Países e o Caso Brasileiro” (Public Communication Systems in The World: Experiences of Twelve Countries and The Brazilian Case). São Paulo: Editora Paulus, 2009, p. 270 (hereaf-ter, J. Valente, Sistemas Públicos de Comunicação).
41 V.A. de Lima, “Mídia: Teoria e Política” (Media: Theory and Politics), 2nd edition. São Paulo, Editora Fundação Perseu Abramo, p. 141—173.
42 Executive Order 236/67, Articles 13 and 14.
43 Nine state broadcasters were created in the fi rst half of the 1970s, including TVE Rio and TV Cultura. See O.P. Pieranti, Políticas Públicas, p. 64.