Chinese Migrants in Small- and Medium-Sized
Enterprises in Two Cities of Guangdong
Liming Lu1,2, Guanyang Zou2,3, Zhi Zeng1,2, Lu Han1,2, Yan Guo1,2, Li Ling1,2*
1Faculty of Medical Statistics and Epidemiology, School of Public Health, Sun Yat-sen University, Guangzhou, China,2Sun Yat-sen Center for Migrant Health Policy, Sun Yat-sen University, Guangzhou, China,3Institute for International Health and Development, Queen Margaret University, Edinburgh, Scotland
Abstract
Objectives:To explore the relationship between health-related quality of life (HRQOL) status and associated factors among rural-to-urban migrants in China.
Methods:A cross-sectional survey was conducted with 856 rural-to-urban migrants working at small- and medium-size enterprises (SMEs) in Shenzhen and Zhongshan City in 2012. Andersen’s behavioral model was used as a theoretical framework to exam the relationships among factors affecting HRQOL. Analysis was performed using structural equation modeling (SEM).
Results:Workers with statutory working hours, higher wages and less migrant experience had higher HRQOL scores. Need (contracting a disease in the past two weeks and perception of needing health service) had the greatest total effect on HRQOL (b=20.78), followed by enabling (labor contract, insurance purchase, income, physical examination during work and training) (b= 0.40), predisposing (age, family separation, education) (b= 0.22) and health practices and use of health service (physical exercise weekly, health check-up and use of protective equipments) (b=20.20).
Conclusions:Priority should be given to satisfy the needs of migrant workers, and improve the enabling resources.
Citation:Lu L, Zou G, Zeng Z, Han L, Guo Y, et al. (2014) Health-Related Quality of Life and Its Correlates among Chinese Migrants in Small- and Medium-Sized Enterprises in Two Cities of Guangdong. PLoS ONE 9(1): e83315. doi:10.1371/journal.pone.0083315
Editor:Qinghua Sun, The Ohio State University, United States of America
ReceivedMay 31, 2013;AcceptedNovember 1, 2013;PublishedJanuary 2, 2014
Copyright:ß2014 Lu et al. This is an open-access article distributed under the terms of the Creative Commons Attribution License, which permits unrestricted use, distribution, and reproduction in any medium, provided the original author and source are credited.
Funding:This research was funded by the China Medical Board (Grant No. 09-984 and No. 12-111). The funder had no further role in the study design, data collection, analysis and interpretation of data, writing of the report, or decision to submit the paper for publication.
Competing Interests:The authors have declared that no competing interests exist.
* E-mail: lingli@mail.sysu.edu.cn
Introduction
China has experienced dramatic industrialization, urbanization, and economic growth over the last three decades [1]. As the important drivers of economic growth, small- and medium-sized enterprises (SMEs) employ 75 percent of China’s total workforce. SMEs contribute 60 percent of its GDP, and comprise over 99.5 percent of China’s businesses [2]. SMEs host most of the rural-to-urban migrants, who migrate from less developed areas to more developed areas for better livelihood. By 2011, the migrant population had reached 221 million, and is estimated to have an annual increase of 10% [3–5]. Access to health care and health-related quality of life (HRQOL) of migrants has become increasingly important in China [6]. Rural-to-urban migrants, particularly those employed at SMEs, are more vulnerable for occupational health risks and reduced HRQOL. SMEs often failed to provide adequate health protection for migrant workers due to insufficient funds, poor management and supervision [7,8]. Due to the household registration system, migrants are often deprived of local public health services and medical insurance schemes [9]. Migrants often live in poor conditions and work in highly intensive environment [8–10].
HRQOL is a broad concept consisting of physical health and psychological well-being. Perceived HRQOL can well predict subsequent physical illness and psychological disorders [11]. Studies found that the HRQOL of rural-to-urban migrants was poorer than that of urban residents [12–14]. HRQOL could be influenced by multiple factors, such as demographic characteris-tics, personal capacity, personal social security, work protection awareness, medical care needs and personal health practices[15– 18]. Most studies on the health of Chinese migrants have focused on particular aspects of health status (such as infectious diseases, disease control, occupational hazards) [5–10]. Few studies to date have been published on the integrated and comprehensive evaluation of migrant workers’ HRQOL. This study aims to explore the correlation and recursive relationships between these key factors and the HRQOL outcome.
Methodology
Theoretical Framework
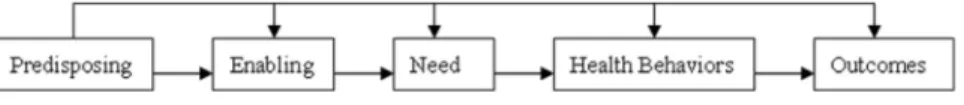
attitudinal determinants of health outcomes (Fig. 1). In this model, predisposing factors include demographic characteristics, social structure factors, and beliefs [20]. Enabling factors are resources at the individual, family, and community levels that may enable individuals to use health resources [20]. Needs, both perceived and evaluated, are influenced by the predisposing and enabling factors [20]. The interrelationship between these three categories will, in turn, determine health behavior (i.e., personal health practices and use of health services), and health outcomes (HRQOL) [20].
To date, few studies have examined Andersen’s model by exploring how the latent variables (e.g. predisposing, enabling, need, health behavior) interrelate with health outcomes of rural-to-urban migrants in SMEs in China. The latent variables are not directly measured, but reflected by the observed variables. Based on Andersen’s behavioral model, we used structural equation modeling (SEM) to build up an analysis model of HRQOL of rural-to-urban migrants and its associated factors.
Study setting
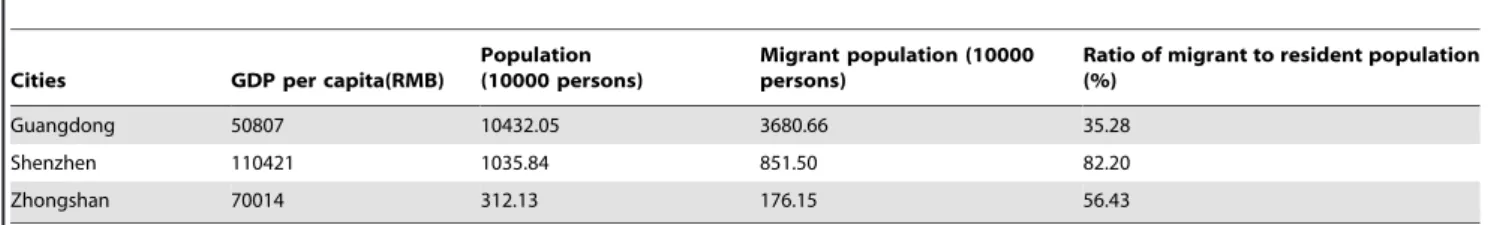
Guandong province has the largest number of rural-to-urban migrants in China [21]. The study was conducted in Shenzhen and Zhongshan, two of the cities in the Pearl River Delta Areas of Guangdong in spring of 2012. Shenzhen had higher GDP per capita and proportion of migrant population than Zhongshan (Table 1)[22]. A medium-sized enterprise has an operating income of RMB 20,400 million and 300,1000 employees; a small-sized
enterprise has an operating income of RMB 3,20 million and
20,300 employees; a miniature enterprise has less than RMB 3
million and less than 20 employees[23].
Sampling
A stratified sampling method was employed to select the study participants from miniature, small and medium sized enterprises in each city. Based on the random sampling estimation [24],
N~deffz
2p(1
{p)
e2 , 95% confidence(z), P= 0.5, design
ef-fect = 2.0, N~2:0 1:96
2
|0:5(1{0:5)
0:102 , each city required 192 samples. Considering the loss to follow rate of 20%, and satisfying multi-variable and multi-model analysis (normally 1.7 times the univariable and single-model analysis), we needed N = 19261.7/ 0.8 = 408 in each city. In total, we needed at least 816 samples from 2 cities. Based on the proportion of employees in the medium, small and miniature-sized group in both cities (6:5:1) [25], the required sample size was 204, 170 and 34 for each group in each city.
Enterprises which provided consent to the study were randomly selected from each group of the district administration’s list based on a computer-generated random number. The county CDC (or occupational health institute) assisted in the recruitment of the local enterprises
Samples
We recruited first-line production workers 1)without a perma-nent residency in Shenzhen or Zhongshan; 2) having resided in the study areas for at least one month; 3) able to provide written
informed consent. We excluded 1) team leaders or management personnel; 2) having difficulty in communications, such as reading or answering the study questionnaires. In total, we recruited 867 eligible migrant workers, with the response rate of 100%. We included 856 questionnaires for analysis as 11 had serious missing data or logical problems. In Shenzhen, we have selected 4 medium-sized, 9 small-sized, 5 miniature-sized enterprises, with 198, 157 and 71 migrant workers, respectively; in Zhongshan, we have selected 3 medium-sized, 4 small-sized, 3 miniature-sized enterprises, with 253, 144 and 33 migrant workers, respectively.
Ethics Statement
The study was approved by the Institutional Review Board of the School of Public Health, Sun Yat-sen University. Written informed consent was obtained from all the study participants. Data was preserved in Sun Yat-sen Center for Migrant Health Policy (CMHP) of Sun Yat-sen University.
Survey instrument
The 12-item Short Form Health Survey (SF-12) was used to collect information on the HRQOL of rural-to-urban migrants. SF-12 has good reliability and validity in most studies [26–28]. The instrument contains eight dimensions extracted from 12 items (Table 2) [28–30]. Two factors (Physical Component Summary (PCS) and Mental Component Summary (MCS)) can be calculated from the 8 dimensions by applying scoring algorithms with weighted item responses. The higher the score, the better the perceived HRQOL [31].
In addition to the SF-12, a structured questionnaire was developed in consultation with experts of public health, social science, public management. This questionnaire covered questions on demographic characteristics, occupational history, labor and social security, health status, and health services utilization. These indicators were chosen on the principle of ‘best fit’ to components of Andersen’s behavioral model.
Measures
To test Andersen’s model, firstly, we identified measured indicators for the five proposed latent variables from the questionnaire. The firstLatent variableis Predisposing factors, the corresponding measured variablesof which are age, family separa-tion, education. Based on the average age of Chinese migrants (27.9) in 2010 [7], the age variable was divided into two categories. The secondLatent variableis Enabling resources, the corresponding
measured variables of which are average monthly income, physical examination, length of labor contract, type of insurance and training on occupational health and safety. The thirdLatent variable
is Need, the correspondingmeasured variablesof which are perceived and evaluated need. Perceived needs meant occupational health service need as felt by migrant workers themselves. ‘‘Evaluated need’’ referred to whether migrants suffered from any diseases in the past 12 months or not. The fourthLatent variablesare Personal health practices and use of occupational health services, the corresponding measured variables of which are weekly physical exercise, use of protective equipments, regular health check-up.
Figure 1. Andersen’s behavioral model.
The fifthLatent variablesare Perceived HRQOL, the corresponding
measured variablesof which are PCS and MCS.
Statistical analysis
The database was constructed using Epidata 3.0. First, to test validity, the factor structure of SF-12 and measured variables of Anderson’s behavior’s model were extracted by performing exploratory factor analysis (EFA) through the principal component analysis with varimax rotation, respectively. It was hypothesized that a two-factor solution would be obtained with eigenvalues greater than 1 for SF-12 and four-factor solution for measured variables of Anderson behavior’s model. The corresponding factor loading equal or greater than 0.4 was considered satisfactory. To test reliability, the internal consistency for summary measures of PCS, MCS and measured variables were estimated using Cronbach’s alpha coefficient, and alpha $0.60 was considered satisfactory [32]. The study variables’ deviations from the normal
distribution remain mild with skewness statistics ranging from 0.32 to 1.44 [33]. Therefore, no attempts (e.g., data transformation) were made to improve the distributional properties.
Second, descriptive statistics were calculated for independent variables and statistical significant difference between groups was tested. The t-test was used for normally distributed continuous variables, and the chi-squared test was used for binominal variables. Independent variables: demographic characteristics, types of enterprises; Dependent variables: PCS & MCS (t-test for two groups or Analysis of variance (ANOVA) for three or more subgroups), migrants’ number in different SMEs (chi-squared test).
P#0.05 was considered to indicate statistical significance. Statis-tical analyses were performed using SPSS version 19.0.
Lastly, SEM was employed to test the hypothesized Andersen’s behavioral model that specified relationships among predisposing factors, enabling resources, care needs, health practices and use of health services, and health outcome. This analysis involved a
two-Table 1.General information of study cities (2011).
Cities GDP per capita(RMB)
Population (10000 persons)
Migrant population (10000 persons)
Ratio of migrant to resident population (%)
Guangdong 50807 10432.05 3680.66 35.28
Shenzhen 110421 1035.84 851.50 82.20
Zhongshan 70014 312.13 176.15 56.43
Available from: http://www.gdstats.gov.cn/tjnj/2012/ml1.htm
GDP: gross domestic product; RMB: renminbi (China’s currency in circulation, the unit of the RMB is the yuan). doi:10.1371/journal.pone.0083315.t001
Table 2.SF-12 item and summary descriptive statistics (N = 856).
Item description (scale) Mean (SD) 95% CI Response frequencies (%)
1 2 3 4 5 6
Health in general (GH)* 3.62(1.09) 3.54–3.69 13.1 32.6 23.6 24.9 5.8
Moderate activities (PF1) 2.91(0.32) 2.89–2.93 10.9 17.5 71.6
Climb several flights (PF2) 2.93(0.28) 2.91–2.95 12.7 19.3 68.0
Accomplished less (RP1) 1.90(0.30) 1.88–1.92 19.8 80.2
Limited kind of work (RP2) 1.90(0.29) 1.88–1.92 19.4 80.6
Pain interferes (BP)* 1.81(0.39) 1.78–1.84 25.2 25.4 26.6 15.5 7.3
Accomplished less (RE1) 1.87(0.33) 1.85–1.89 19.2 80.8
Not careful (RE2) 5.65(0.66) 5.61–5.70 13.2 86.8
Peaceful (MH1)* 4.41(1.25) 4.32–4.49 13.9 39.7 12.2 13.7 13.2 7.3
Blue/sad (MH2) 4.38(1.19) 4.30–4.46 5.5 6.8 11.6 15.1 16.8 44.2
Energy (VT)* 4.98(0.95) 4.92–5.04 11.8 38.2 17.7 12.3 13.2 6.8
Social time (SF) 5.59(0.86) 5.53–5.65 5.5 6.8 11.6 15.1 16.8 44.2
Summary statistics PCS MCS
Mean (SD) 53.43 51.31
95% CI 53.07–53.79 50.79–51.83
Cronbach’sa 0.62 0.65
Skewness 21.15 21.01
Minimum (% floor) 31(0.2) 23(0.1)
Maximum (% ceiling) 65(0.2) 66(0.1)
*Item recorded in order to make all response frequencies in the same direction. Now for all 12 items higher scores indicate better condition.
Abbreviations: GH: General Health, PF: Physical Functioning, RP: Role Physical, BP: Bodily Pain, RE: Role Emotional, MH: Mental Health, VT: Vitality, SF: Social Functioning, SD: standard deviation.
step process. First, confirmatory factor analysis (CFA) was used to describe the relationships between the latent constructs and their measured variables (measurement model). Standardized factor loadings were calculated for each indicator (the higher, the better). Then, SEM was performed to test the hypothesized relationships among all latent constructs (structural model). The measurement and structural models were examined using AMOS (Analysis of Moment Structures) 18.0. Standardized regression coefficients for all paths were estimated. Goodness of model fit was evaluated by using absolute and comparative fit indices. Missing data accounted for no more than 2% of any variables in this study and were imputed using mean replacement method [34]. A Chi-Square/DF ratio,3.0, a root mean squared error of approximation (RMSEA)
,0.06, standardized root mean square residual (SRMR),0.05, a goodness-of-fit index (GFI), comparative fit index (CFI), and Tacker-Lewis index (TLI) of 0.90 or above were taken to indicate an acceptable model fit [35].
Results
Basic characteristics of the study participants
Nearly 40% of the participants in this investigation were female, 80% were at the age of 15 to 39 years old, 36% were undergoing family separation; nearly 41% of China’s migrant workers in 2011 were female, 80.4% were at the age of 15 to 39 years old, 35% were undergoing family separation [36]. After the Chi-squared goodness-of-fit test, no significant difference was found between the distributions of sample characteristics (sex/age/family separa-tion) and those of China’s migrant workers in 2011 (all p -values.0.45).
The social-demographic information of study participants is reported in Table 3. Nearly 60% of the participants were more than 27.9 years old, 80% were educated at or below junior middle school education; 81.3% had changed jobs by the time we conducted the survey, and had resided in more than one place (each over 6 months). Eighty-seven percent migrated from other provinces. There were significantly higher proportion of migrants from other provinces in medium and miniature enterprises than the small enterprises (P= 0.014; P= 0.015). Over 50% had a monthly income less than RMB3000 (US$473.4). Over 60% of migrants worked more than 8 hours per day. Migrants working in medium enterprises had higher average monthly income (P,0.01) and longer working hours per day (P,0.01) than those working in the small and miniature enterprises.
Table 4 summarizes the measured indicators of the migrants’ characteristics according to Andersen’s model. Predisposing: for family separation, age and education see above; Enabling: over 40% did not receive occupational health and safety training and physical examination (for income see above); 65.8% had signed the labor contract of no less than one year and 91.7% had bought insurance; Need: more than 60% perceived the need of occupa-tional health service;Health behavior: more than 60% did not have weekly physical exercise, and regular health check-up, less than 20% used protective equipments during work.
Reliability and validity of SF-12 and measured variables
To test reliability, the SF-12 item and summary descriptive statistics are presented in Table 2. The results demonstrated that both summary measures exceeded the 0.60 level for Cronbach’s alpha, indicating satisfactory results (a for the PCS-12 = 0.62;
MCS-12 = 0.65). In addition, no floor or ceiling effects were observed, implying that the SF-12 items captured the full range of health status.
To test validity, the two-factor conceptual structure of the SF-12 was confirmed (Table 5). Principal components analysis with varimax rotation loaded two factors showed that eigenvalues for the two factors (physical and mental health) jointly accounted for 60.3% of the variance. The results indicated that items of physical functioning, role physical, bodily pain and general health loaded higher on the physical health component; items of vitality, social functioning, role emotional and mental health loaded higher on the mental health component.
Measured variables of Anderson’s behavior’s model had good reliability with most of domains $0.60 levels for Cronbach’s alpha; and good validity with the item loading higher on the corresponding factor than on other factors (Table 6).
HRQOL scores
The study participants had an average score of 53.4 for PCS and 51.3 for MCS, respectively. migrants who were male, over 27.9, had statutory working time (#8 hours/day) or a monthly income of over 3000 Yuan had a higher MCS score, than the migrants who were female, less than 27.9, did not have statutory working time or had a monthly income lower than 3000 Yuan. Migrants working in medium enterprises or having resided in more than 6 places(each over 6 months) had a lower PCS than those working in small-and miniature enterprises or having less than 6 residence locations(Table 3).
Confirmatory factor analysis
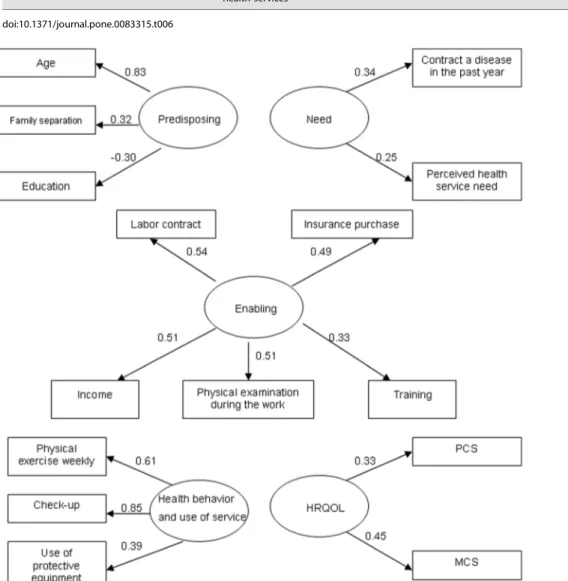
The revised measurement model indicated a GFI of 0.973, CFI of 0.925, TLI of 0.886, RMSEA of 0.045, SRMR of 0.045 and Chi-Square/DF of 2.736,suggesting an acceptable model fit (Fig. 2).
The predisposing factor was highly associated with age, family separation and education. Of these, age had the highest factor loading (0.83). The enabling factor was highly associated with the status of contract, insurance, physical examination and income. The need factor was highly associated with being ill in the past year and perception of needing health service. The health behavior and use of services factor was highly associated with frequency of physical exercise, regular check-up and using protective equipments. The perceived health outcome factor was highly associated with PCS and MCS (Fig. 2). The correlations between the five latent factors ranged between20.497 and 0.781, indicating that they had acceptable discriminant validity (i.e.
,0.85) [37].
Structural model analysis
Direct, indirect and total effects
Direct, indirect and total effects of the latent variables were illustrated in
Table 7 and Figure 3. Most of the direct effects were under expectation. Greater predisposing factor was associated with more enabling resources (b= 0.31); greater enabling resources were associated with less need (b=20.53); Greater need was associated with positive behavior and greater use of services (b= 0.14) and less HRQOL (b=20.78). Surprisingly, worse behavior and less use of services were associated with better perceived HRQOL.
Direct negative effect: health behavior and use of service on HRQOL (b=20.20); need on HRQOL (b=20.75); enabling on need (b=20.53).
Indirect effect: predisposing factor on HRQOL mediated by enabling, need and health behavior and use of service; enabling factor on HRQOL mediated by need and health behavior and use of service.
Total effect: Need had greater total effect on HRQOL (b=20.78), followed by enabling (b= 0.40), predisposing (b= 0.22) and health behavior and use of service (b=20.20).
Table 3.Demographic characteristics and scores of Chinese migrants among different SMEs (n= 856).
Variables
Medium N (%)
Small N (%)
Miniature
N (%) x2 N (%) PCS t & F MCS t & F
Age
.27.9 274(60.8) 164(54.5) 67(64.4) 4.37 505(59.0) 53.5565.07 0.74 52.8067.08 6.78***
#27.9 177(39.2) 137(45.5) 37(35.6) 351(41.0) 53.2665.87 49.1768.14
Sex
Female 208(46.1) 114(37.9) 23(22.1) 21.38** 345(40.3) 53.0265.78 1.79 49.9667.83 4.26***
Male 243(53.9) 187(62.1) 81(77.9) 511(59.7) 53.7165.14 52.2367.54
Education
Primary or less 53(11.8) 29(9.6) 18(17.3) 9.03 100(11.7) 52.7765.69 1.36 52.5767.21 2.23
Junior middle school 321(71.2) 201(66.8) 69(66.3) 591(69.0) 53.4165.37 51.3367.66
High school or above 77(17.0) 71(23.6) 17(16.4) 165(19.3) 53.9065.38 50.5068.24
BMI
Outside the normal range 173(38.4) 135(45.0) 33(31.7) 6.60 341(40.0) 53.0265.58 21.79 51.3767.84 0.14
18.5,22.9 278(61.6) 165(55.0) 71(68.3) 514(60.0) 53.6965.29 51.2967.67
Household register
Other Provinces 400(88.7) 248(82.4) 96(92.3) 9.33* 744(87.0) 53.5365.22 1.22 51.3767.78 0.53
Guangdong Province 51(11.3) 53(17.6) 8(7.7) 112(13.0) 52.7466.53 50.9667.46
Personal monthly income
,¥2000 20(4.4) 16(5.3) 23(22.1) 56.83** 59(6.9) 53.8165.13 1.23 50.1968.03 7.38
¥2000, 140(31.1) 67(22.3) 29(27.9) 236(27.6) 52.8666.00 50.1267.76
¥2500, 84(18.6) 84(27.9) 19(18.3) 187(21.8) 53.5365.38 50.3968.17
¥3000, 207(45.9) 134(44.5) 33(31.7) 374(43.7) 53.6765.07 52.7167.24g%
Hours of work
.8 h 333(73.8) 174(57.8) 45(43.3) 43.52** 552(64.5) 53.2965.60 20.99 50.1868.08 25.86***
#8 h 118(26.2) 127(42.2) 59(56.7) 304(35.5) 53.6765.06 53.3666.60
Ever changed work
Yes 362(80.3) 242(80.4) 92(88.5) 3.99 696(81.3) 53.4365.51 20.07 51.2467.58 20.72
No 89(19.7) 59(19.6) 12(11.5) 160(18.7) 53.4764.93 51.7368.33
Number of residences of more than six months
#3 9(2.0) 3(1.0) 1(1.0) 8.72 13(1.5) 53.3165.44 5.91** 51.2867.82 0.07
4,6 68(15.1) 54(17.9) 28(26.9) 150(17.5) 54.4664.53 51.5267.46
.6 374(82.9) 244(81.1) 75(72.1) 693(81.0) 49.7768.93gh 51.00
67.30
Total 451(52.7) 301(35.2) 104(12.1) 856 53.4365.42 51.3167.73
*P#0.05, **P#0.01, ***P#0.001,gP#0.05 (compared with the first option),hP#0.05 (compared with the second option),%P#0.01 (compared with the second and third option).
x2: the statistics for chi-squared test; t: the statistics for t-test; F: the statistics for Analysis of variance (ANOVA); PCS: physical component summary; MCS: mental component summary; h: hour; ¥: the currency symbol of RMB.
Note: Most of the variables’ categories follow the national migrants’ survey [3]. the mean age of Chinese migrants were 27.9 in 2011,thus the age variable was divided into two categories (.27.9 and#27.9). The monthly income of migrants was divided into four group ‘‘,¥2000’’, ‘‘,¥2500’’, ‘‘,¥3000’’ and ‘‘¥3000+’’. Our following results also suggested they were reasonable categorization with an equal sample in each group. Migrants often felt lonely and had less social support when they did not live with their family members. The term ‘‘family separation’’ could convey this meaning, but ‘‘divorced or widowed, married, and single’’ did not. The education was categorized by ‘‘primary school or less, junior middle school and high school or above.
Discussion
Our results suggest that Andersen’s behavioral model is a useful model in predicting the HRQOL among rural-to-urban migrants in SMEs in China. In our study, variables related to workers’ health, such as need for occupational health service, use of protective equipments, and occupational health training, were included in the model. Ten percent, 28%, 22% and 62% of the variance of the enabling resources, need, personal health practices and use of services, and perceived HRQOL could be explained by the related latent variables respectively. In consistent with another study, our study suggests good predicating power of the adapted Andersen model [38]. In particular, this model has the best predictability for perceived HRQOL, more than 50% of the variance of which could be explained by other factors in this model. Our study indicates the importance of sufficient enabling resources and small need in predicting good HRQOL. Our results echo other studies[38241], which adapted the Andersen’s model to examine the direct and mediated pathways between social, attitudinal and behavioral factors and perceived oral health outcomes. However, those studies have confined themselves in traditional methods, not the SEM. Use of SEM can explore the correlation and recursive relationships between these key factors and the HRQOL outcome.
Table 4.The latent and measured variables used in the analysis (N = 856).
Variable N/Mean %/SD Variable N/Mean %/SD
Predisposing factors Occupational health and safety training
Age No 367 42.9
.27.9 505 59.0 Yes 489 57.1
#27.9 351 41.0 Physical examination
Family separation(did not live with their family members)
No 397 46.4
Yes 307 35.9 Yes 459 53.6
No 549 64.1 Need
Education Perceived occupational health service need
Primary school or below 100 11.7 Yes 527 61.6
Junior middle school 591 69.0 No 329 38.4
High school or above 165 19.3 Contract a disease in the past 12 month
Enabling resources Yes 523 61.1
Personal monthly income No 333 38.9
,¥2000 59 6.9 Personal health practices and use of occupation
health services
¥2000, 236 27.6 Physical exercise weekly
¥2500, 187 21.8 No 517 60.4
¥3000, 374 43.7 Yes 339 39.6
Labor contract Use of protective equipments
,1 year 293 34.2 No 690 80.6
1 year, 312 36.4 Yes 166 19.4
3 years, 251 29.3 Regular check-up
Insurance No 535 62.5
No 71 8.3 Yes 321 37.5
One of the three 351 41.0 Perceived HRQOL
Two of the three 428 50.0 PCS 53.4 5.4
All of the three 6 0.7 MCS 51.3 7.7
SD: standard deviation; ¥: the currency symbol of RMB; PCS: physical component summary; MCS: mental component summary. doi:10.1371/journal.pone.0083315.t004
Table 5.Factor structure of the SF-12 derived from principal component analysis.
Item description SF-12 domain Factor 1 Factor 2
Health in general General Health 0.55 0.45
Moderate activities Physical Functioning 0.69 0.10
Climb several flights Physical Functioning 0.72 0.10
Accomplished less Role Physical 0.60 0.23
Limited kind of work Role Physical 0.56 0.29
Pain interferes Bodily Pain 0.65 0.35
Accomplished less Role Emotional 0.25 0.77
Not careful Role Emotional 0.22 0.77
Peaceful Mental Health 0.25 0.65
Blue/sad Mental Health 0.28 0.64
Energy Vitality 0.27 0.55
Social time Social Functioning 0.18 0.68
Variance explained (%) 37.49 22.80
Table 6.The reliability and validity of measured variables (N = 856).
Item description Domain Cronbach’sa Factor 1 Factor 2 Factor 3 Factor 4
Age Predisposing 0.60 0.64 0.24 0.10 20.22
Family separation Predisposing 0.67 0.06 20.06 0.06
Education Predisposing 20.58 0.19 20.04 0.23
Personal monthly income Enabling 0.57 20.01 0.67 20.06 20.12
Labor contract Enabling 20.03 0.71 20.21 20.12
Type of insurance purchase Enabling 20.03 0.63 0.14 0.03
Physical examination during the work Enabling 0.34 0.56 0.08 0.15
Occupational health and safety training Enabling 0.16 0.40 0.25 0.31
Perceived occupational health service need Need 0.65 20.09 20.31 0.71 0.11
Contract a disease in the past 12 month Need 0.07 20.11 0.63 20.23
Physical exercise weekly health practices and use of health services
0.63 20.25 20.01 0.07 0.69
Use of protective equipments health practices and use of health services
0.08 20.05 20.02 0.68
Regular check-up health practices and use of health services
20.20 20.02 20.09 0.77
doi:10.1371/journal.pone.0083315.t006
Figure 2. Measurement model of latent constructs (ellipses) and manifest indicator variables (rectangles). Values represent standardized factor loadings and all are statistically significant (P,0.01). GFI = 0.973; CFI = 0.925; TLI = 0.886; RMSEA = 0.045; SRMR = 0.045. Chi-Square/ DF = 2.736.
Our results highlight the importance of testing complex interrelationships between key contextual factors when examining migrant HRQOL. In this model, predisposing factor has direct effect on enabling factors, indicating the positive associations between the predisposing factors such as age, education and enabling variables such as income, insurance, labor contract.
Enabling factors have a negative direct effect on need factors, while predisposing factors have negative indirect effect on need factors mediated by enabling factors. In line with Andersen’s model, if one is more predisposed to seek care, they need to have access to the enabling resources [40,42].
Figure 3. Structural model for Andersen’s behavioral model.Standardized path coefficients are shown. *P,0.05; **P,0.01. GFI = 0.967; CFI = 0.886; TLI = 0.855; SRMR = 0.047; RMSEA = 0.047. Chi-Square/DF = 2.916. Solid lines = direct effect; dashed lines = indirect effect.
doi:10.1371/journal.pone.0083315.g003
Table 7.Direct, indirect and total effects for Andersen’s model.
Predisposing Enabling Need Health behavior and use of service
Enabling
Direct effect 0.31**
Indirect effect
Total effect 0.31**
Need
Direct effect 20.53**
Indirect effect 20.16*
Total effect 20.16* 20.53**
Health behavior and use of service
Direct effect 0.47** 0.14*
Indirect effect 20.02 0.08
Total effect 0.45** 0.08 0.14*
HRQOL
Direct effect 20.75** 20.20*
Indirect effect 0.22* 0.40** 20.03
Total effect 0.22* 0.40** 20.78** 20.20*
*P,0.05; **P,0.01.
In our study, health behavior factor has a negative direct effect on HRQOL. The health behavior factor was found to be more associated with health check-up (factor loading 0.85) than others (Fig. 2). This suggests that health check-up dominated the direction of relationship between health behavior and health outcome. In reality, weekly physical exercise and use of protective equipment have closer relations (closer in time to the health outcome) with HRQOL than health check-up once or twice a year (more distant in time). Thus, check-up leads to weak or negative effect in the causal chain between health behavior and perceived HRQOL.
Echoing with previous published studies [43,44], our study suggests that migrants who had statutory working time (#8 hours/ day) or higher income had a higher MCS score than migrants who did not have statutory working time or had lower income; Migrants who had less migrant experience had higher PCS score than migrants who had more migrant experience. In our complementary analysis, migrants in the medium enterprise had higher income, worked in longer hours per day and had a less PCS than those working in the small and miniature enterprise. Less PCS among migrants in medium enterprises might be due to larger business volume, more heavy workload and more stringent management. Therefore, providing enough labor protection and social security for workers will benefit the health of migrants especially those working in medium enterprises. Despite use of protective equipment helps to protect physical health, less than 20% migrant workers used it in this study. Wearing protective equipments might slow down the working efficiency of migrants, who seek better livelihood in the city. Also, SMEs may seek profit at the sacrifice of workers’ health by not investing. Limited use of protective equipments may contribute to the poor HRQOL scores of migrants.
Policy implications can be drawn from our study to improve the HRQOL of migrant workers. First, SMEs should satisfy the need of occupational health service (OHS) of migrants. Education program should be provided to improve the social responsibility of the employers [45,46]. Essential OHS services such as protective equipments should be provided to protect migrants’ health. Second, governments and employers should ensure the enabling resources to be provided to migrant workers. It is imperative to provide migrants with security benefits such as labor contracts and
insurances. Regular OHS training and physical examinations will improve the self-protection awareness of migrant workers and early detection of health problems [47]. Things will be much improved, following the implementation of universal basic occupational health service (BOHS) [48].
Our study is one of the first to apply Andersen’s behavior model and SEM to analyze potential determinants of HRQOL of migrant workers in SMEs. Several limitations should be born in mind. First, our study is cross-sectional; such that causality cannot be determined. Using this model entails more creative and challenging conceptualization, longitudinal and experimental study designs, and innovative types of statistical analyses [19]. Some important factors may have been neglected in the model, such as personal beliefs or biological risk factors [49]. Second, Cronbach’s alpha of 0.60 in this study is not very strong. As most of the migrants were young, they may not have some problems reflected in SF-12 (e. g. Pain interferes (BP) or Climb several flights (PF2), etc.). The inconsistency of choosing the answers of SF-12 between the old and the young migrants leads to its low reliability. Finally, future research is needed to identify more variables to explain the causal relationships among the variables of Anderson’s behavior’s model.
Acknowledgments
We are very grateful to the migrant workers interviewed. The author would like to thank the local CDC, the department of occupation disease prevention and control, the department of health supervisor and neighborhood offices involved who helped in respondent referral and data collection. Also, the author would like to thank Megan M. McLaughlin, from Sun Yat-sen Center for Migrant Health Policy and UNC Project-China, who helped in editing the English of our manuscript.
Data Access and Responsibility: Liming Lu and Li Ling had full access to all the data in the study and took responsibility for the integrity of the data and the accuracy of the data analysis.
Author Contributions
Conceived and designed the experiments: L. Lu GZ LH L. Ling. Performed the experiments: L. Lu ZZ LH YG. Analyzed the data: L. Lu ZZ LH. Contributed reagents/materials/analysis tools: L. Li GZ. Wrote the paper: L. Lu GZ L. Ling YG.
References
1. Wang X, Wu S, Song Q, Tse LA, Yu IT, et al. (2011) Occupational health and safety challenges in China—focusing on township-village enterprises. Arch Environ Occup Health 66: 3–11.
2. amCham-China (2011) Small- and Medium-Sized Enterprises. Available: http://web.resource.amchamchina.org. Accessed 26 May 2012.
3. Service Management Division of the National Population and Family Planning Commission for the Migrant Population (2011) Report on China’s migrant population development, 2011. Beijing: China Population Publishing House. 4. Mou J, Cheng J, Griffiths SM (2011) Internal migration and depressive
symptoms among migrant factory workers in Shenzhen, China. J Community Psychol 39: 212–230.
5. Li L, Wang HM, Ye XJ, Jiang MM, Lou QY, et al. (2007) The mental health status of Chinese rural-urban migrant workers: comparison with permanent urban and rural dwellers. Soc Psychiatry Psychiatr Epidemiol 42: 716–722. 6. Li Y, Wu SF (2010) Social networks and health among rural-urban migrants in
China: a channel or a constraint? Health Promot Int 25: 371–380. 7. Smith DR, Wang RS (2004) Occupational health and safety in China. J Occup
Health Saf (Aust N Z) 20: 441–444.
8. Xiao Y, Smith DR, Zhang X (2008) The current status and issues related to occupational health surveillance in China. J Occup Health Saf (Aust NZ) 24: 455–463.
9. Liu S, Griffiths SM (2011) From economic development to public health improvement: China faces equity challenges. Public Health 125: 669–674. 10. Wong DFK, Chang YL, He XS (2007) Rural migrant workers in urban China:
living a marginalized life. Int J Soc Welfare 16: 32–40.
11. Schnurr PP, Hayes AF, Lunney CA, McFall M, Uddo M (2006) Longitudinal analysis of the relationship between symptoms and quality of life in veterans treated for posttraumatic stress disorder. J Consult Clin Psychol 74: 707–713. 12. Wang W, Thompson DR, Ski CF, Liu M (2010) Health-related quality of life
and its influence factors among migrant workers. Chin J Public Health 26: 317– 318.
13. Researching Group of National Bureau of Statistics of China (2007) The analysis of factors affecting living quality of off-farm workers of China. Statistical Research 24: 13–19.
14. Researching Group of National Bureau of Statistics of China (2007) The evaluation of analysis of living quality index of off-farm workers of China. Statistical Research 24: 3–8.
15. Zhang J, Li X, Fang X, Xiong Q (2009) Discrimination experience and health-related quality of life among rural-to-urban migrants in China: the mediation effect of expectation-reality discrepancy. Qual Life Res 18: 291–300. 16. Zhu CY, Wang JJ, Fu XH (2012) Correlates of health-related quality of life in
China rural-urban female migrant workers. Qual Life Res 21: 495–503. 17. Chen YS, Chen M (2007) The relationship between health-related quality of life
and posttraumatic stress disorder or major depression for WreWghters in Kaohsiung, Taiwan. Health-related quality of life Research 16: 1289–1297. 18. Michalos A, Zumbo B, Hubley A (2000) Health and the health-related quality of
life. Social Indicators Research 51: 245–286.
19. Andersen RM (1995) Revisiting the behavioral model and access to medical care: does it matter? J Health Soc Behav 36(1): 1–10.
21. Guangdong Statistical Information Network (2011) Communique´ on Major Data of the sixth national census of 2010, Guangdong Province. Available: http://www.gdstats.gov.cn/tjgb/t20110510_83276.htm. Accessed 2012 May 26.
22. Guangdong Statistical Bureau (2012) Guangdong Statistical Yearbook 2012. Available: http://www.gdstats.gov.cn/tjnj/2012/ml1.htm. Accessed 18 July 2013.
23. The People’s Republic of China Ministry of Industry (2012) Notice of the issuance of the SME program standards require. Available: http://wenku.baidu. com/view/26300f6fa45177232f60a224.html. Accessed 2012 May 26. 24. Guo Q (2004) Handbook of sampling in research. Beijing: China Economic
Times Press.
25. People’s Government of Guangdong Province (2011) Communique´ on Major Data of the sixth national census of 2010, Guangdong Province. Available: http://www.gd.gov.cn/govpub/rdzt/rkpc/default.htm. Accessed 2012 May 26. 26. Gandek B, Ware JE, Aaronson NK, Apolone G, Bjorner JB, et al. (1998) Cross-validation of item selection and scoring for the SF-12 Health Survey in nine countries: results from the IQOLA Project. International Quality of Life Assessment. J Clin Epidemiol. 51: 1171–1178.
27. Montazeri A, Vahdaninia M, Mousavi SJ, Omidvari S (2009) The Iranian version of 12-item Short Form Health Survey (SF-12): factor structure, internal consistency and construct validity. BMC Public Health 9: 341.
28. Kontodimopoulos N, Pappa E, Niakas D, Tountas Y (2007) Validity of SF-12 summary scores in a Greek general population. Health and Quality of Life Outcomes 5: 55.
29. Montazeri A, Vahdaninia M, Mousavi SJ, Asadi-Lari M, Omidvari S, et al. (2011) The 12-item medical outcomes study short form health survey version 2.0 (SF-12v2): a population-based validation study from Tehran, Iran. Health and Quality of Life Outcomes 9: 12.
30. Comer JS, Blanco C, Hasin DS, Liu SM, Grant BF, et al. (2011) Health-Related Quality of Life Across the Anxiety Disorders: Results From the National Epidemiologic Survey on Alcohol and Related Conditions (NESARC). Journal of Clinical Psychiatry 72: 43–50.
31. Andrews G (2002) A brief integer scorer for the SF-12: validity of the brief scorer in Australian community and clinic settings. Australian and New Zealand Journal of Public Health 26: 508–510.
32. Noradilah Md Nordin, Mansor Abu Talib, Siti Nor Yaacob, Mohamad Shatar Sabran (2010) A Study on Selected Demographic Characteristics and Mental Health of Young Adults in Public Higher Learning Institutions in Malaysia. Global Journal of Health Science 2: 104–110.
33. Hobart JC, Williams LS, Moran K, Thompson AJ (2002) Quality of life measurement after stroke: uses and abuses of the SF-36. Stroke 33: 1348–1356.
34. Downey RG, King C (1998) Missing data in Likert ratings: A comparison of replacement methods. J Gen Psychol 125: 175–191.
35. Wu ML (2010) Structural Equation Model: AMOS operation and Application. Chongqing: Chongqing University press.
36. Service Management Division of the National Population and Family Planning Commission for the Migrant Population (2012) Report on China’s migrant population development, 2012. Beijing: China Population Publishing House. 37. Timothy A, Brown PsyD (2006) Confirmatory factor analysis for applied
research. New York: the Guildford Press.
38. Baker SR (2009) Applying Andersen’s behavioural model to oral health: what are the contextual factors shaping perceived oral health outcomes? Community Dentistry and Oral Epidemiology 37: 485–494.
39. Phillips KA, Morrison KR, Andersen R, Aday LA (1998) Understanding the context of healthcare utilization: assessing environmental and provider-related variables in the behavioral model of utilization. Health Serv Res 33: 571–596. 40. Stein JA, Andersen R, Gelberg L (2007) Applying the Gelberg-Andersen behavioral model for vulnerable populations to health services utilization in homeless women. J Health Psychol 12: 791–804.
41. Conner NE (2012) Predictive Factors of Hospice Use Among Blacks: Applying Andersen’s Behavioral Model. American Journal of Hospice & Palliative Medicine 29: 368–374.
42. Babitsch B, Gohl D, von Lengerke T (2012) Re-revisiting Andersen’s Behavioral Model of Health Services Use: a systematic review of studies from 1998–2011. Psychosoc Med 9: Doc11.
43. Yan Z, Peng AH, Liu FF (2010) Health-related quality of life and its influence factors among migrant workers. Chin J Public Health 3: 317–318.
44. Qian S, Wang WX, Wang Y (2008) The mental health status of 323 Henan migrant-workers and its influencing factors. China Journal of Health Psychology 16: 459–461.
45. Yu WL (2012) Occupational Health and Safety in China calls for CSR. Available: http://www.socialresponsibility.biz/discuss0906.pdf. Accessed 2012 May 26.
46. Liang Y, Xiang Q (2004) Occupational health services in PR China. Toxicology 198: 45–54.
47. Ma CH, Li XH, Wu YH (2012) Investigation on the Physical Living Conditions and Lifestyles of Migrant Workers in Hebei. Journal of North China Institute of Aerospace Engineering 22: 61–62.
48. Chen Y, Chen J, Sun Y, Liu Y, Wu L, et al. (2010) Basic Occupational Health Services in Baoan, China. Journal of Occupational Health 52: 82–88. 49. Finlayson TL, Gansky SA, Shain SG, Weintraub JA (2010) Dental utilization