1 www.gjmedph.org Vol. 2, No. 5 2013 ISSN#- 2277-9604
Induced Abortion and Women’s Reproductive Health in India
Sutapa Agrawal,1* Praween K Agrawal2
ABSTRACT
Despite the intensive national campaign for safe motherhood and legalization of induced abortion (IA), morbidity from abortion has remained a serious problem for Indian women. This study examined the consequences of IA on women’s reproductive health. Analysis used data of 90,303 ever-married women age 15-49 years, included in India’s second National Family Health Survey (NFHS-2, 1998-99). Binary logistic regression methods were used to examine the consequences of IA on women’s reproductive health. Independent of other factors, the likelihood of experiencing any reproductive health problems was 1.5 times higher (OR,1.46;95%CI,1.33-1.60;P<0.001) among women who had one
IA and 1.9 times higher (OR,1.85;95%CI,1.52-2.27;P<0.001) among women who had two or more IA compared to women with no history of IA. Study suggests that IA may have negative consequences for women’s reproductive health.
Keywords: induced abortion, reproductive health, women, NFHS-2, India
INTRODUCTION
Worldwide, induced abortion represents an
important aspect of women’s reproductive health
and rights. Under the 1971 Medical Termination of Pregnancy Act, a woman in India can legally obtain an induced abortion if her pregnancy carries the risk of grave physical injury, endangers her mental health, is the result of contraceptive failure (in case of a married woman) or rape, or is likely to produce a child with physical or mental abnormalities.1 In the global context, in which induced abortion is restricted by law and even criminalized in several countries, India enjoys the dubious distinction of being a country in which induced abortion is legal but largely unsafe and unavailable2 and therefore morbidity from abortion has remained a serious problem for Indian women.3
The World Health Organization Special Program of Research, Development and Training in Human Reproduction reported induced abortion to be a major reproductive health problem.4 A number of studies have shown that many Indian women suffer
from reproductive tract infections, or RTIs.5 Coupled with RTIs, induced abortion plays a critical role in the reproductive health of Indian women. In many instances, induced abortions—and more specifically, sex-selective abortions take place after 12 weeks of gestation, which is not safe for the health of the women. This may lead to obstetric morbidity and infertility, as well as risking the life of the women.6 Given the fact that women in India have little control over their own fertility and also have poor health, the chances are very high that they may experience abortion, which includes both spontaneous and induced abortion, and perhaps more than once.7 The reproductive health risk of induced abortion multiplies manifold if a woman has to resort to it repeatedly.8-9 The relationship between induced abortion and reproductive health problems has been hardly explored in the Indian context. Using nationally representative cross sectional population based data; this study examines the association between induced abortion and women’s reproductive health in India.
GJMEDPH 2013; Vol. 2, issue 5
*Corresponding Author 1
South Asia Network for Chronic Disease
Public Health Foundation of India New Delhi, India
sutapaiips@rediffmail.com 2
Population Council New Delhi, India sutapa.agrawal@phfi.org
Conflict of Interest—none
2 www.gjmedph.org Vol. 2, No. 5 2013 ISSN#- 2277-9604 METHODS
Data were mainly retrieved from India’s second National Family Health Survey10, conducted during 1998-99. NFHS-2 has been designed along the lines of the Demographic and Health Surveys that have been conducted in many developing countries since the 1980s. NFHS-2 collected demographic, socioeconomic, and health information from a nationally representative probability sample of 90,303 ever-married women aged 15-49 years residing in 92,486 households. All the states of India are represented in the sample (except the small Union Territories), covering more than 99 percent of
the country’s population. The sample is a multistage
cluster random sample with an overall response rate of 98 percent. Details of sample design, including sampling framework and sample implementation, are provided in the basic survey report for all India.10
In NFHS-2, information on pregnancies that did not result in a live birth is collected using the birth history section. For each interval between births, as well as the interval before the first birth and after the last birth, each woman was asked whether she had any stillbirths, spontaneous abortions, or induced abortions, and if yes, how many she had. This information was summed to obtain the total number of abortions of each type she has had in her lifetime. The analysis presented here is based on all reported induced abortion cases. Abortions that are reported in NFHS as induced abortions are most likely to be legal induced abortions. However, the extent to which women may have self-reported both legal and illegal types of abortions in the survey is indefinite.
Specifically, the data on reproductive health problems among ever-married women in NFHS-2 is
anticipated from women’s self-reported experience with each of the following problems during the last 3 months preceding the survey: vaginal discharge accompanied by itching, by irritation around the vaginal area, by severe lower abdominal pain not accompanied by menstruation, by fever, or by any other problem; pain or burning while urinating or frequent or difficult urination; and (among currently married women only) painful intercourse or bleeding after intercourse (ever). No effort was made to clinically test the symptoms. The survey was
conducted using an interviewer-administered questionnaire in the native language of the respondent using a local, commonly understood term for the reproductive morbidities. A total of 18 languages were used in the survey with back translation to in English to ensure accuracy and comparability. In our analysis, this reported prevalence of reproductive health problems is the response variable.
The control variables included in this study were age, rural/urban residence, religion, caste/tribe, couple’s
education, couple’s working status, wealth index, media exposure, women’s autonomy, induced
abortion, number of children ever born, and time since last birth. For definition of variables see
Table 1.
Bivariate analysis is carried out to explore the differential in induced abortion and socio demographic characteristics of women, followed by a chi-square to test significance level. The association between induced abortion and the reproductive health problems of women was examined by restoring any reproductive health problem as a dependent variable and using socio-demographic and maternal characteristics as independent variables in separate sets of adjusted and unadjusted models.
The results are presented in the form of odds ratios (ORs), with 95 percent confidence intervals (95% CIs). The estimation of confidence intervals takes into account design effects resulting from clustering at the level of the primary sampling unit. In the survey, certain states and certain categories of respondents were oversampled. Appropriate weights were used to restore the representativeness of the sample. The analysis was conducted through SPSS-16.
Human Subjects Informed Consent
The survey got ethical clearance from International
Institute for Population Science’s Ethical Review
3 www.gjmedph.org Vol. 2, No. 5 2013 ISSN#- 2277-9604 RESULTS
Induced Abortion Scenario in States of India
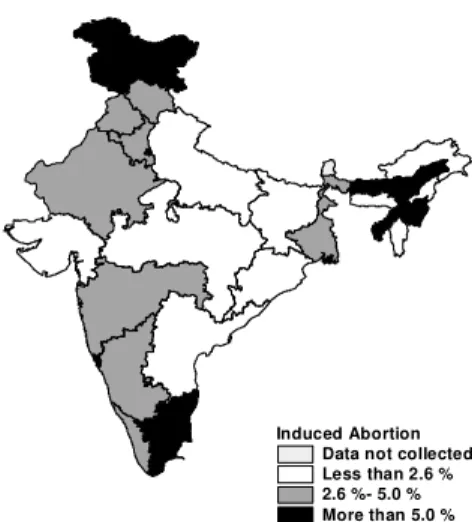
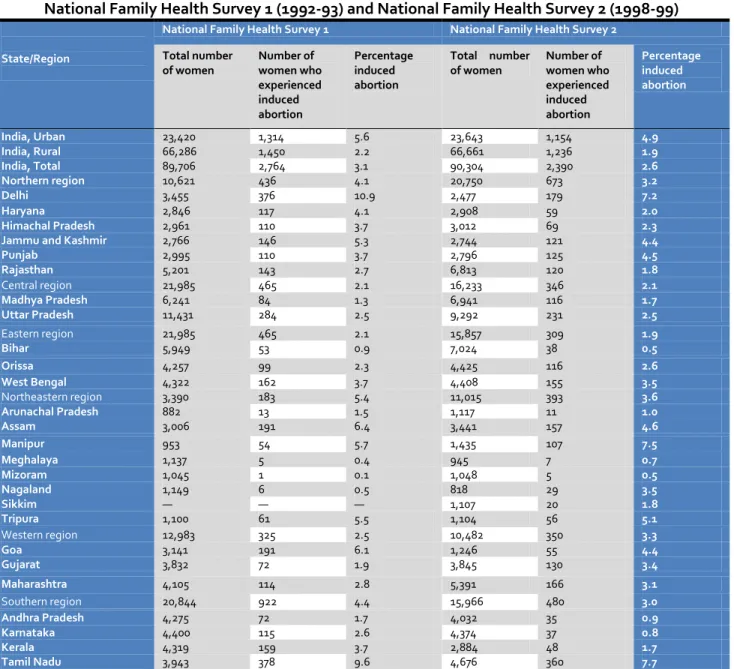
Table 1, Figure 1, and Figure 2 present the percentage of women who have ever experienced induced abortion in India by state during both rounds of NFHS. Overall, in India, almost 3 percent of women experienced induced abortion in NFHS-1 (3.1 percent); this statistic remains almost the same in NFHS-2 (2.6 percent). An urban-rural differential is seen in induced abortion, being substantially higher in urban areas (5.6 percent in NFHS-1 and 4.9 percent in NFHS-2) than in rural areas (2.2 percent in NFHS-1 and 1.9 percent in NFHS-2).
A substantial state-wise variation in induced abortion among women in India can be seen. In NFHS-1, Delhi showed the highest incidences of induced abortion (10.9 percent), followed by Tamil Nadu (9.6 percent), Assam (6.4 percent), Goa (6.1 percent), and Manipur (5.7 percent). In contrast, induced abortions were low (less than 1 percent) in Mizoram, Meghalaya, Nagaland, and Bihar. Overall, an almost similar pattern was found during NFHS-2, with the same groups of states falling in the high and low categories of experiencing induced abortion among women. Tamil Nadu shows highest incidences of induced abortion (7.7 percent), followed by Manipur (7.5 percent), Delhi (7.2 percent), Tripura (5.1 percent), Assam (4.6 percent), and Punjab (4.5 percent). Tamil Nadu was ranked highest in the NFHS-2 but was second—after Delhi—in NFHS-1. States such as Punjab, Orissa, Manipur, Gujarat, and Maharashtra also have shown an increase in induced abortion cases among women.
Figure 1 Induced abortion among women in India, 1992-93
Figure 2 Induced abortion among women in India, 1998-99
Induced Abortion Data not collected Less than 2.6 % 2.6 %- 5.0 % More than 5.0 %
Induced Abortion Among Women in India 1992-93
Induced Abortion Less than 2.6 2.6 - 5.0 More than 5.0
4 www.gjmedph.org Vol. 2, No. 5 2013 ISSN#- 2277-9604 Table 1 Percentage of ever-married women age 15-49 years who have
ever experienced induced abortion in India by states and region,
National Family Health Survey 1 (1992-93) and National Family Health Survey 2 (1998-99)
State/Region
National Family Health Survey 1 National Family Health Survey 2
Total number of women
Number of women who experienced induced abortion
Percentage induced abortion
Total number of women
Number of women who experienced induced abortion
Percentage induced abortion
India, Urban 23,420 1,314 5.6 23,643 1,154 4.9
India, Rural 66,286 1,450 2.2 66,661 1,236 1.9
India, Total 89,706 2,764 3.1 90,304 2,390 2.6
Northern region 10,621 436 4.1 20,750 673 3.2
Delhi 3,455 376 10.9 2,477 179 7.2
Haryana 2,846 117 4.1 2,908 59 2.0
Himachal Pradesh 2,961 110 3.7 3,012 69 2.3
Jammu and Kashmir 2,766 146 5.3 2,744 121 4.4
Punjab 2,995 110 3.7 2,796 125 4.5
Rajasthan 5,201 143 2.7 6,813 120 1.8
Central region 21,985 465 2.1 16,233 346 2.1
Madhya Pradesh 6,241 84 1.3 6,941 116 1.7
Uttar Pradesh 11,431 284 2.5 9,292 231 2.5
Eastern region 21,985 465 2.1 15,857 309 1.9
Bihar 5,949 53 0.9 7,024 38 0.5
Orissa 4,257 99 2.3 4,425 116 2.6
West Bengal 4,322 162 3.7 4,408 155 3.5
Northeastern region 3,390 183 5.4 11,015 393 3.6
Arunachal Pradesh 882 13 1.5 1,117 11 1.0
Assam 3,006 191 6.4 3,441 157 4.6
Manipur 953 54 5.7 1,435 107 7.5
Meghalaya 1,137 5 0.4 945 7 0.7
Mizoram 1,045 1 0.1 1,048 5 0.5
Nagaland 1,149 6 0.5 818 29 3.5
Sikkim — — — 1,107 20 1.8
Tripura 1,100 61 5.5 1,104 56 5.1
Western region 12,983 325 2.5 10,482 350 3.3
Goa 3,141 191 6.1 1,246 55 4.4
Gujarat 3,832 72 1.9 3,845 130 3.4
Maharashtra 4,105 114 2.8 5,391 166 3.1
Southern region 20,844 922 4.4 15,966 480 3.0
Andhra Pradesh 4,275 72 1.7 4,032 35 0.9
Karnataka 4,400 115 2.6 4,374 37 0.8
Kerala 4,319 159 3.7 2,884 48 1.7
Tamil Nadu 3,943 378 9.6 4,676 360 7.7
Note: the population covered in NFHS-2 differs slightly from that in NFHS-1. NFHS-1 did not include Sikkim and the Kashmir region of Jammu and Kashmir. NFHS-2 covered all the 26 states, but the survey work in Tripura was delayed considerably as a result of some local problems. Therefore, estimates for Tripura are not included in the national estimates of the national report. However, the population of the regions not common in the two surveys is small and should have only a negligible effect on the comparability of the national estimates from the two surveys.
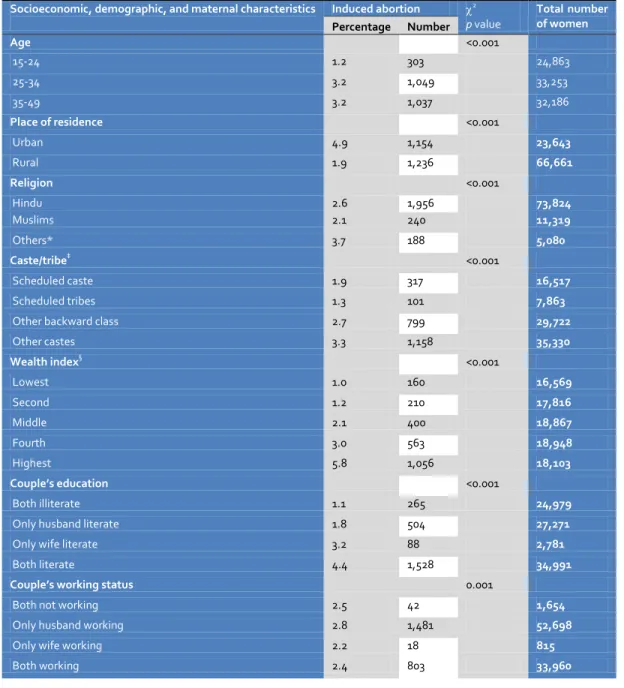
Induced Abortion by Socioeconomic, Demographic, and Maternal Characteristics
Data on induced abortion among ever-married women aged 15-49 years in India by selected
socioeconomic, demographic, and maternal
characteristics are presented in Table 2. A significant positive relationship is seen in the experience of
induced abortion with women’s age, wealth status,
couple’s education, mass media exposure, and
6 www.gjmedph.org Vol. 2, No. 5 2013 ISSN#- 2277-9604 Table 2 Induced abortion by socioeconomic, demographic, and maternal characteristics, India, 1998-99
Socioeconomic, demographic, and maternal characteristics Induced abortion 2
p value
Total number of women Percentage Number
Age <0.001
15-24 1.2 303 24,863
25-34 3.2 1,049 33,253
35-49 3.2 1,037 32,186
Place of residence <0.001
Urban 4.9 1,154 23,643
Rural 1.9 1,236 66,661
Religion <0.001
Hindu 2.6 1,956 73,824
Muslims 2.1 240 11,319
Others* 3.7 188 5,080
Caste/tribe‡ <0.001
Scheduled caste 1.9 317 16,517
Scheduled tribes 1.3 101 7,863
Other backward class 2.7 799 29,722
Other castes 3.3 1,158 35,330
Wealth index§ <0.001
Lowest 1.0 160 16,569
Second 1.2 210 17,816
Middle 2.1 400 18,867
Fourth 3.0 563 18,948
Highest 5.8 1,056 18,103
Couple’s education <0.001
Both illiterate 1.1 265 24,979
Only husband literate 1.8 504 27,271
Only wife literate 3.2 88 2,781
Both literate 4.4 1,528 34,991
Couple’s working status 0.001
Both not working 2.5 42 1,654
Only husband working 2.8 1,481 52,698
Only wife working 2.2 18 815
7 www.gjmedph.org Vol. 2, No. 5 2013 ISSN#- 2277-9604
(Table 2 Continued from page 2)
Socioeconomic, demographic, and maternal characteristics
Induced abortion 2
p value
Total number of women Percentage Number
Mass media exposure** <0.001
No exposure 1.1 418 37,412
Partial exposure 3.4 1,441 42,082
Full exposure 4.9 530 10,784
Autonomy ‡‡ <0.001
Low 2.0 648 32,679
Medium 2.4 679 28,024
High 3.6 1,064 29,602
Number of children ever born <0.001
0 1.1 112 9,925
1-2 3.4 1,072 31,888
3 2.9 503 17,347
4+ 2.3 702 31,142
Time since last birth <0.001
Less than 1 year 0.2 21 11,089
1-2 years 1.7 307 17,697
More than 2 years 3.8 1,949 51,591
Total 2.65 2,390 90,304
Note:*Other religions include Christian, Sikh, Buddhist, Jain, Jewish, Zoroastrian, and others
‡
Scheduled castes and scheduled tribes are castes and tribes that the government of India identifies as socially and economically backward and in need of special protection from social injustice and exploitation. Others is thus a default residual group that enjoys higher status in the caste hierarchy. §
For assessing the economic status of the household, a wealth index has been created. The wealth index was constructed using household asset data and housing characteristics. Each household asset is assigned a weight (factor score) generated through principal components analysis, and the resulting asset scores are standardized in relation to a normal distribution with a mean of zero and standard deviation of one.14 Each household is then assigned a score for each asset, and the scores were summed for each household; individuals are ranked according to the score of the household in which they reside. The sample is then divided into quintiles (i.e., five groups with an equal number of individuals in each). 20 household assets and housing characteristics includes: household electrification (electricity, kerosene, gas or oil, other source of lighting), drinking water source (pipe, hand pump, well in residence/yard/plot, public tap, hand pump, well, other water source), type of toilet facility (own flush toilet, public or shared flush toilet or own pit toilet, shared or public pit toilet, no facility), type of house (pucca, semi-pucca, kachha), cooking fuel (electricity, liquefied natural gas, or biogas, coal, charcoal, or kerosene, other fuel), house ownership (yes, no), number of household members per sleeping room, and ownership of a car, tractor, moped/scooter/ motorcycle, telephone, refrigerator, or color television, bicycle, electric fan, radio/transistor, sewing machine, black-and-white television, water pump, bullock cart or thresher, mattress, pressure cooker, chair, cot/bed, table, or clock/watch.
**Mass media exposure includes regular exposure to newspaper reading, listening to radio, and watching television. Full exposure means reading newspaper at least once a week, listening to radio at least once a week, watching television at least once a week; partial exposure means either of the above three options, and no exposure means none of the above options.
‡‡
Similar to the wealth index, an autonomy index has been created to determine the autonomy of the women in the household. Apart from the more
commonly measured dimensions of women’s status, such as education and work participation, in this study, autonomy was measured with certain
direct indicators concerning women’s power in the household. A set of situation-specific questions were asked to women. Each autonomy indicator is
assigned a weight (factor score) generated through principal components analysis, and the resulting autonomy scores are standardized in relation to a normal distribution with a mean of zero and standard deviation of one. The sample is then divided into three groups (low, medium, and high), with an equal number of individuals in each group. Questions used for constructing the autonomy index include 1) Are you allowed to have some money set aside that you can use as you wish? (yes, no). 2) Who makes the following decision in your household: a. What items to cook? b. Obtaining health care for yourself; c. Purchasing jewelry or other major household items, d. Your going and staying with parents or siblings. The responses for each of the above categories are Respondent, Husband, Jointly with Husband, Others in Household, Jointly with Others in the Household). 3. Do you need permission to a. Go to the market, b. Visit relatives or friends. Response to each of the above categories is yes, no, not allowed to go.
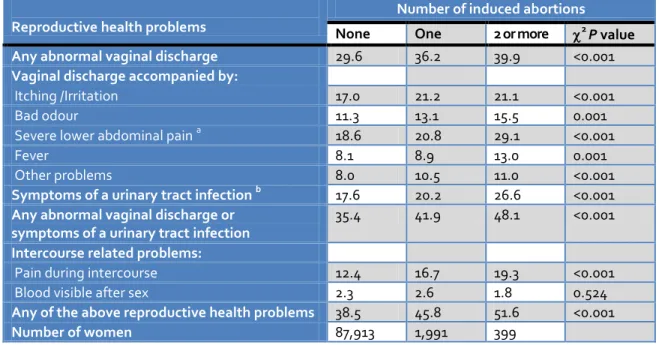
Induced Abortion and Reproductive Health Problems
Table 3 presents self-reported reproductive health problems among ever-married women aged 15-49 years in India, according to number of induced abortions. Most of the reproductive health problems are significantly exacerbated with an increase in the number of induced abortions. For example, 40
7 www.gjmedph.org Vol. 2, No. 5 2013 ISSN#- 2277-9604 and other problems according to the number of
induced abortions. Symptoms of a UTI were reported by 27 percent women who had had two or more induced abortions compared with 20 percent women with one induced abortion and only 18 percent women with no induced abortion history. Any abnormal vaginal discharge or symptoms of a UTI also notably increased (p<0.001) with an increase in
the number of induced abortions. Overall, a profound differential (p<0.001) is observed in any reproductive health problems according to number of induced abortions. Fifty-two percent of the women who had two or more induced abortions experienced reproductive health problems compared with 46 percent women who had one induced abortion and 39 percent women with no induced abortion history.
Table 3Specific reproductive health problems among ever-married women aged 15-49 years, according to number of induced abortions, India, 1998-99
Reproductive health problems
Number of induced abortions
None One 2 or more 2 P value
Any abnormal vaginal discharge 29.6 36.2 39.9 <0.001
Vaginal discharge accompanied by:
Itching /Irritation 17.0 21.2 21.1 <0.001
Bad odour 11.3 13.1 15.5 0.001
Severe lower abdominal pain a 18.6 20.8 29.1 <0.001
Fever 8.1 8.9 13.0 0.001
Other problems 8.0 10.5 11.0 <0.001
Symptoms of a urinary tract infection b 17.6 20.2 26.6 <0.001
Any abnormal vaginal discharge or symptoms of a urinary tract infection
35.4 41.9 48.1 <0.001
Intercourse related problems:
Pain during intercourse 12.4 16.7 19.3 <0.001
Blood visible after sex 2.3 2.6 1.8 0.524
Any of the above reproductive health problems 38.5 45.8 51.6 <0.001
Number of women 87,913 1,991 399
a Not related to menstruation.
b Includes pain or burning sensation while urinating or difficult or frequent urination.
Association between Induced Abortion and Reproductive Health Problems
The association between induced abortion and any reproductive health problem among women is seen by restoring logistic regression and is presented as an unadjusted and adjusted model in Table 4. The unadjusted model shows that the likelihood of experiencing any reproductive health problems is 1.4 times higher (OR, 1.35; 95% CI, 1.24-1.48; p<0.001) among women who had one induced abortion compared with women who had no abortion history, which increases to a likelihood that is 1.7 times higher (OR, 1.71; 95%CI, 1.40-2.08; p<0.001) among women who had had two or more induced abortions. The association remains significant and even more profound when we adjust for socio-demographic and
maternal factors such as number of children ever born, time since last birth, current age, type of
residence, religion, caste/tribe, couple’s education and working status, mass media exposure, autonomy, and wealth status. Incidence of any reproductive health problem was 1.5 times higher (OR, 1.46; 95%CI, 1.33-1.60; p<0.001) among women who had one induced abortion compared with women who had no induced abortion history, increasing to 1.9 times higher (OR, 1.85; 95% CI, 1.52-2.27; p<0.001) among women who had two or more induced abortions in the adjusted model.
Other factors, such as number of children ever born,
time since last birth, women’s current age, religion,
8 www.gjmedph.org Vol. 2, No. 5 2013 ISSN#- 2277-9604 associated with reproductive health problems among
women. The likelihood of experiencing any reproductive health problem was higher among Muslim women (OR, 1.59; 95% CI, 1.52-1.66; p<0.001) than Hindu women. However, the likelihood of experiencing any reproductive health problems was 7% lower in Other castes (OR, 0.93; 95% CI, 0.89-0.96; p<0.001) than scheduled caste, 11% lower (OR, 0.89; 95% CI, 0.86-0.92; p<0.001) among women with higher autonomy than those with lower autonomy, and 21% lower (OR, 0.79; 95% CI, 0.74-0.85; p<0.001) among women belonging to highest wealth index than those belonging to the lowest. Interestingly, other factors such as residence, education, working status, and media exposure were not found to be associated with reproductive health problems among women.
DISCUSSION
Induced abortion is possibly the most discordant
women’s health issue that policy makers and
planners face, particularly in developing countries. This study added some empirical finding on the consequences of induced abortion which could be useful for policy formulations in India. Our study shows that induced abortion is an important indicator of the reproductive health problem among Indian women and ascertained that women’s reproductive health deteriorates more when women resort to repeated induced abortion.
Higher reproductive health problems were also found among middle aged women, have had a delivery in the recent past (1-2 years ago), among Muslim women, among women belonging to other backward caste, when the women only is working, had partial media exposure and belonging to household with wealth quintile. This is a general phenomenon among the populations of Asia, including India. Substandard hygiene, low socio-economic status, promiscuity and traditional taboos against openness about these diseases are the usual factors responsible for this high
prevalence of reproductive health problems. Also, community-based studies conducted in various regions in India have all shown that the prevalence of reproductive morbidity among women from lower socio economic strata is very high.11,10
However, reproductive health problems among women belonging to other castes and belonging to households with better economic condition were found to be lower, which suggests that these women have better knowledge and practice of hygienic behavior. In India, women who belong to other castes mostly belong to households with higher economic conditions. It is more likely that those women would have better health-care-seeking behavior for their reproductive health problems. This may have led those women to report fewer reproductive health problems.
In addition, the higher autonomy of women was greatly associated with lower reproductive health problems among women. This may be because their having greater autonomy gives these women better access to health care services and, consequently, fewer reproductive health problems.
9 www.gjmedph.org Vol. 2, No. 5 2013 ISSN#- 2277-9604
Table 4 Unadjusted and adjusted odds ratios with 95% CI from logistic regression analysis showing associations between any reproductive health problem and induced abortion, controlling for socioeconomic, demographic, and maternal characteristics among ever-married women aged 15-49 years, India, 1998-99 (n = 89,141)
Predictor variables Reproductive health problem
Unadjusted (95% CI) Adjusted (95% CI) Odds
ratio
LL UL P value Odds ratio
LL UL P value
Number of induced abortions
None(ref) 1.00 1.00
One 1.35 1.24 1.48 <0.001 1.46 1.33 1.60 <0.001 2 or more 1.71 1.40 2.08 <0.001 1.85 1.52 2.27 <0.001
Number of children ever born
0 (ref) 1.00 1.00
1-2 0.81 0.78 0.85 <0.001 0.71 0.67 0.75 <0.001
3 0.88 0.84 0.93 <0.001 0.76 0.71 0.81 <0.001
4+ 0.92 0.88 0.96 <0.001 0.80 0.75 0.86 <0.001
Time since last birth
Less than 1 year (ref) 1.00 1.00
1-2 years 1.14 1.09 1.20 <0.001 1.14 1.08 1.20 <0.001 More than 2 years 1.15 1.10 1.20 <0.001 1.34 1.27 1.41 <0.001 Current age
15-24 years (ref) 1.00 1.00
25-34 years 1.10 1.07 1.14 <0.001 1.05 1.01 1.10 0.018
35 years or more 0.85 0.82 0.88 <0.001 0.76 0.72 0.80 <0.001
Type of residence
Rural (ref) 1.00 1.00
Urban 0.87 0.84 0.90 <0.001 0.98 0.95 1.02 0.404
Religion
Hindu (ref) 1.00 1.00
Muslims 1.53 1.47 1.60 <0.001 1.59 1.52 1.66 <0.001
Others 0.98 0.92 1.04 0.471 1.03 0.97 1.09 0.390
Caste/tribe
Scheduled caste (ref) 1.00 1.00
Scheduled tribes 1.01 0.97 1.05 0.671 1.03 0.99 1.08 0.107
Other backward class 1.12 1.06 1.17 <0.001 1.14 1.08 1.20 <0.001
Other castes 0.91 0.88 0.94 <0.001 0.93 0.89 0.96 <0.001
Couple’s education
Both illiterate (ref) 1.00 1.00
Only husband literate 1.00 0.96 1.03 0.893 1.02 0.99 1.06 0.231
Only wife literate 0.99 0.92 1.07 0.841 0.97 0.89 1.05 0.420
Both literate 0.86 0.84 0.89 <0.001 0.99 0.94 1.03 0.513
Couple’s working status
Both not working (ref) 1.00 1.00
Only husband working 1.08 0.98 1.20 0.125 1.07 0.96 1.18 0.216
Only wife working 1.17 0.99 1.39 0.069 1.22 1.02 1.45 0.028
Both working 1.15 1.04 1.27 0.007 1.12 1.01 1.24 0.037
Mass media exposure
No exposure (ref) 1.00 1.00
Partial exposure 1.00 0.97 1.03 0.869 1.09 1.06 1.13 <0.001
Full exposure 0.76 0.73 0.80 <0.001 0.98 0.93 1.04 0.567
Autonomy
Low (ref) 1.00 1.00
Medium 0.97 0.94 1.00 0.044 0.97 0.94 1.00 0.066
High 0.85 0.82 0.88 <0.001 0.89 0.86 0.92 <0.001
Wealth index
Lowest (ref) 1.00 1.00
Second 1.04 0.99 1.08 0.085 1.05 1.00 1.10 0.030
Middle 1.06 1.01 1.10 0.010 1.06 1.01 1.11 0.015
Fourth 0.99 0.95 1.04 0.726 0.99 0.94 1.04 0.615
Highest 0.76 0.73 0.80 <0.001 0.79 0.74 0.85 <0.001 Ref: Reference category;
LL: Lower limit; UL: Upper limit
10 www.gjmedph.org Vol. 2, No. 5 2013 ISSN#- 2277-9604 Women interviewed in NFHS-2 were not asked to
provide the exact dates of pregnancy terminations. In the birth history segment of the questionnaire, they were asked to report whether they had a terminated pregnancy between each birth, as well as before and after the first and last births. Because the pregnancy outcome record is linked to the birth records, the only way to determine the approximate date of when an induced abortion occurred is to look at abortions that happened after the most recent birth or births. Induced abortion during last 5 years could have been analyzed to minimize lifetime abortion experience and give a better association between induced abortion and reproductive health. However, when we looked at women whom we knew had an induced abortion in the last 5 years because they had at least one birth in the last 5 years, we realized we were biasing the sample toward more fertile women— exactly the women who were least likely to have experienced reproductive health problems, as many reproductive health problems can lead to infertility. A major limitation of the current analysis, therefore, is the possible time elapsed between experience of induced abortion (which could have happened at any
point in a woman’s lifetime) and reproductive health
problems in the 3 months before the interview. Moreover, the study is based on reported symptoms and experiences of reproductive health problems. Therefore, although we get a clear positive association between number of induced abortions and reproductive health problems, the results should be interpreted with caution.
Lastly, this study used relatively older data (NFHS-2 data conducted in 1998-99) rather than the latest round of the survey i.e., NFHS-3 which was conducted in 2005-06. This is largely because we cannot exclude the induced aborted information from NFHS-3 data. In NFHS-3 women were not specifically asked about induced abortion but all eligible women were asked to provide binary answer to the question, Have you ever had a pregnancy that miscarried, was aborted, or ended in a stillbirth? (available at www.nfhsindia.org). Thus, it was not possible to exclude the induced abortion cases from the data, as a woman can have any of the above pregnancy out come in her life. Thus, there was only
one question for all the outcomes and the answer was either yes or no without referring to any specific outcome. Therefore, NFHS-2 is the only available survey, where married women were specifically asked about induced abortion. Despite the fact that the data is slightly older, we believe that the pattern of association will remain similar. However, as very few/no study has been done on the association between induced abortion and women's reproductive health in India with a nationally representative data this study is an important contribution to the literature.
CONCLUSION
Induced abortion is possibly the most discordant
women’s health issue that policy makers and
planners face, particularly in developing countries. The study added some empirical finding on the consequences of induced abortion on women’s reproductive health; they could be useful for policy formulations in India. This study reveals that still there is a need to focus on unmet need for contraception in India to avoid the burden of unwanted pregnancy and induced abortion among women. Programs and policies should focus more on the knowledge, availability and accessibility and use of contraception among women as contraception is the surest way to prevent unintended pregnancy and the need for abortion. There is an urgent need for awareness about possible adverse consequences of
repeated induced abortions on a woman’s
reproductive health. However, more in-depth qualitative studies and clinical examination are needed to better understand the consequences of this complex and sensitive issue in India. In particular, further investigation and research are needed to ascertain the long-term reproductive health consequences of induced abortion.
ACKNOWLEDGEMENTS
11 www.gjmedph.org Vol. 2, No. 5 2013 ISSN#- 2277-9604 REFERENCES
1. Ministry of Health and Family Welfare, Government of India. Family Welfare Programme in India year book. 2001. New Delhi: Department of Family Welfare.
2. Ravindran TKS. Gender Gaps in Research on Abortion in India: A Critical Review of Selected Studies. The Gender and Reproductive Health Research Initiative. CREA. 2002.New Delhi. Pp 1-28.
3. Johnston HB. Abortion practice in India: A review of literature. Mumbai: Cehat and Health Watch 2002. 4. Mundigo AI, Indriso C. Abortion in the developing
world. 1999 New York: WHO, Zed Books.
5. Pachauri S, Gittlesohn J. Summary of research studies and implications for health policy and Programs. In Gittlesohn J, Bentley ME, Pelto PJ, Nag M, Pachauri S, Harrison AD, Landman LT, editors. Listening to women talk about their health issues and evidence from India. New Delhi: Ford Foundation and Har-Anand Publications 1994.
6. Unisa S, Prakasam CP, Sinha RK, Bhagat RB. Evidence of sex selective abortion from two cultural settings of India: A study of Haryana and Tamil Nadu. Mumbai: International Institute for Population Sciences 2003.
7. Babu NP, Nidhi D, Verma RK. Abortion in India: What does the National Family Health Survey tell us?
Journal of Family Welfare 1998; 44: 45-54.
8. Agrawal S. Interlinkages between Women’s
Childhood Experience, Autonomy, Sex preference and Elimination of the Girl Child: A Study of Women in Rural Haryana. Unpublished Ph.D. Thesis, International Institute for Population Sciences, Mumbai, India 2005.
9. Agrawal S. Determinants of Induced Abortion and Its
Consequences on Women’s Reproductive Health: Findings from India’s National Family Health Surveys.
DHS Working Paper No. 53. 2008.
10. International Institute for Population Sciences and ORC Macro. National Family Health Survey (NFHS-2), 1998-99: India. Mumbai: International Institute for Population Sciences 2000.
11. Bhatia JC, Cleland J, Bhagavan L, Rao NSN. Levels and determinants of gynecological morbidity in a district of South India. Stud. Fam. Plann. 1997;28(2): 95–103.
12. Koenig M, Jejeebhoy S, Singh S, Sridhar S. Undertaking Community-Based Research on the Prevalence of Gynecological Morbidity: Lessons From India. IUSSP Seminar in Manila, Philippines, on Innovative Approaches to the Assessment of Reproductive Health. IUSSP & Population Institute, University of the Philippines, Liege, Belgium 1996. 13. Arnold F, Kishor S, Roy TK. Sex-selective abortions in
India. Population and Development Review 2002;28: 759-785.
14. Fu, H, Darroch JE, Henshaw SK, Kolb E. Measuring the extent of abortion underreporting in the 1995 National Survey of Family Growth. International Family Planning Perspectives 1998;30: 128-133, and 138.