9
Agriculturae Conspectus Scientii cus | Vol. 75 (2010) No. 1 (9-19)
ORIGINAL SCIENTIFIC PAPER
Summary
One of the critical factors inl uencing land degradation is land use. However, the extent to which land use inl uences land degradation has not been fully ascertained in the southwestern part of Nigeria (i.e. particularly in Ogun State). h us, this study was designed to assess the extent to which land use inl uences crop productivity in Ogun State. Two major soil types identii ed at the site were Ali sols and Ultisols. Within these, three land use types (LUT) were identii ed: arable crop - Land Use 1, cash crop production - Land Use 2, and non-agricultural use – Land Use 3. h ese were evaluated for three commonly cultivated crops in the area, namely: maize, cassava and oil palm, using the FAO framework for Land Sustainability Evaluation (LSE). Soil degradation levels were assessed under three LUTs using parametric approach. Descriptive statistics and rank ordered correlation were used for the data analysis. h e results of the LSE showed that all the pedons were marginally suitable (S3) for maize, 60 % were of moderate (S 2) and 40 % of marginal (S 3) suitability for cassava respectively. However, for oil palm, 47 % of the lands were classii ed as being marginally suitable (S 3) while 53 % were not suitable (N). h e major limitations identii ed were sub-optimal, poor soil (i.e. texture(s) and fertility), poor drainage/ wetness (w), steep topography (t), and sub-optimal climate (c) (i.e. annual rainfall, mean annual temperature and length of growing season). Parametric assessment revealed that chemical degradation was moderate within LUT 2, but ranged between slight to none in LUTs 1 and 3 respectively. Land uses 2 and 3 were slightly degraded physically, while 1 was moderate. Land use was found to be signii cantly (P < 0.01) correlated with land degradation (r = 0.47**) at all sites. h e degradation level ranked from moderate to high due to inappropriate land uses. h us, it is recommended that in all LUTs must be a careful choice of appropriate use of land in order to reduce degradation.
Key words
land, degradation, land evaluation, land use, land productivity, Nigeria
Ef ect of Land Use on Soil Degradation
and Soil Productivity Decline on Ali sols
and Ultisols in Ogun State in South
Western, Nigeria
Bolarinwa Ayoola SENJOBI
1( )Olayiwola Ayoade OGUNKUNLE
21 Department of Soil Science and Farm Mechanization, College of Agricultural Sciences, Olabisi Onabanjo University, PMB 2002, Ago-Iwoye, Ogun State, Nigeria
e-mail: bolasenjobi@yahoo.com
2 Department of Agronomy, University of Ibadan, Nigeria
Introduction
One of the most serious problems currently af ecting agricul-tural productivity in developing countries of the tropics, includ-ing Nigeria, is land degradation. h e intensii cation of cultivation resulting in the opening up of new lands exposes the top soil to the elements of degradation and alters the natural ecological conservatory balances in the landscape. Such imbalances pose great dii culty for productivity increase to meet the food and i bre needs of a rapidly growing population in the region, thus endangering food security (Lal, 2007; Senjobi, 2007).
An estimate by Food and Agricultural Organisation (FAO) in 1984 indicated that 5 to 7 million hectares of land a year are lost globally to agricultural production as a result of erosion and related forms of land degradation, including siltation of water ways and dams. Tropical soils, which are generally less stable than those of the temperate climates, are particularly severely threatened, due to their fragile properties and the very aggres-sive climatic conditions. However, since the primary step to-wards ef ective land conservation is appropriate allocation of land to uses for which they are most suitable, land use should be in accordance to land potential capacity, so as to optimize and sustain agricultural productivity. However, in practice, par-ticularly is south western Nigeria, the use to which land is put is not ot en related to the land potential capacity for the use type (Senjobi, 2001). h is is largely because the decision on land use rests virtually with land owners/users, who are mostly peasant farmers and not on the outcome of professional land evaluation (Ogunkunle and Eghaghara, 1992). h is had rendered some of the previously agriculturally rich lands, progressively uni t for agricultural production especially where two or more land use types, contrasting in specii c details and potentials occur on similar soils or the same land use types on dissimilar soils.
In many urban areas in South Western Nigeria, for example, encroachment on agricultural lands for other uses without due regard for their qualities is rampant. In Ago-Iwoye, Ogun State, the establishment of a University resulted in stif competition for use of land for agriculture and non-agricultural use (e.g. resi-dential and road construction). Unfortunately, land use types, encroachment, misuse and consequences are least researched and poorly documented in these areas. Furthermore, beyond the South Western Nigeria microcosm, fears are ripe that the present pace of encroachment on agricultural lands may even-tually lead to the loss of substantial parts of prime agricultural lands in many countries to other land uses to the extent that they may become food importers (Fasina, 1996).
h ere is therefore need to have reliable information on the inl uence of dif erent land uses on land degradation and agri-cultural productivity in Ogun State, Nigeria. Information is also required on the extent to which the land has been misused in this area. h is will not only guide the land users (or owners) in relat-ing land degradation type to land use, but help in the choice of selection of the appropriate approach to land use. h is is the es-sence of this study. Specii cally, the study aims to evaluate three land use types (LUT) using the FAO method of land evaluation and then examine the kinds and degree of land degradation on these major LUTs in South Western Nigeria, as well as their im-plications on agricultural productivity.
Materials and methods
Description of the study site. h e study area is the Olabisi Onabanjo University Campus site, Ago-Iwoye, Ogun State lo-cated at point latitudes 6o55’ and 7o00’N and between longitudes
3o45’ and 4o05’. It covers about 3141 ha of land. h e area has
bi-modal rainfall, with peaks between June - July and September - October. h is is followed by a short period of dry season that is usually between November and February. It has an annual rainfall of about 1150 mm and it is located in the rain forest belt. Mean relative humidity of the area is generally high (about 80 %) with the peak between May and October and the annual mean temperature is 27oC. Tree species found in the study
area include: Pentaclethra macrophylla, Basqueia angloansis,
Piptadeniastrum africanam, Antiaris toxicaria var. Africana,
Cola gigantea, Milicia excelsa, Guarea spp. and Mimusop spp., and there is also the wide spread of Elaeis guineensis and these were dominated by the presence of Chlomolaena odorata; a per-ennial weed found in fallow lands in south western Nigeria. h is perennial weed reduces the amount of litter regeneration and the rate of re-growth of other weedy species in the study area. h e major land use types in the study area were: (i) arable crop (LUT 1), (ii) cash crop production (LUT 2) and (iii) non-agricultural uses (i.e. such as residential, commercial, and roads construc-tion) (LUT 3). h e major food crops in the area include cassava (Manihot spp), maize (Zea mays), cocoyam (Colocasia esculen-tum), yams (Dioscorea spp.), melon (Colocynthis spp), and variety of vegetables such as Celosia argentea, Amaranthus spp., okra (Abelmoschus esculentum) etc. h e major cash crops are cocoa, oil palm, kolanut and citrus while the commonest cropping pat-tern is early maize + cassava, yam + maize + melons. h ree land use types (LUT) were used for the purpose of this study: arable cropping, oil palm and building sites. It was observed that the land under arable cropping has been under continuous crop-ping for about sixteen years while the oil palm plantation has been established for over thirty years for commercial purpose with little or no input.
Agric. conspec. sci. Vol. 75 (2010) No. 1
11
Effect of Land Use on Soil Degradation and Soil Productivity Decline on Alfisols and Ultisols in Ogun State in South Western, Nigeria
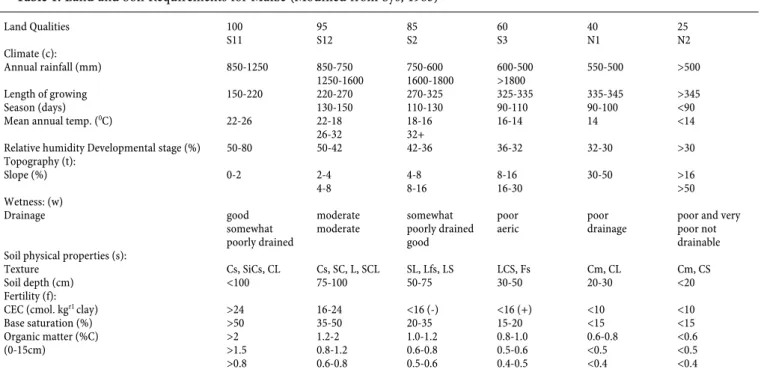
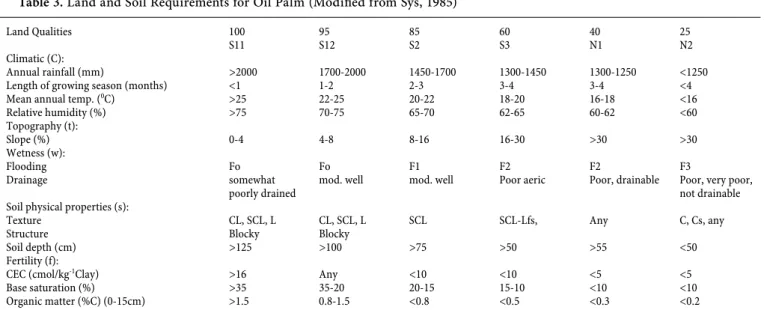
At er being air-dried for 72 hours, the samples were crushed and sieved using a 2 mm screens. Soil samples were analyzed for the following parameters: soil pH in both water and 0.01 M po-tassium chloride solution (1:1) using glass electrodes pH meter (Mclean, 1965). Total nitrogen was determined by the macro-kjeldahl digestion method of Jackson (1962), available P was at er (Bray and Kurtz, 1945) extraction using Bray-l extract followed by molybdenum blue colorimetry. Exchangeable cations were extracted with 1M NH4OAC (pH 7.0), K, Ca and Na were deter-mined using l ame photometer and exchangeable Mg by atomic absorption spectrophotometer (Sparks, 1996). Exchangeable acidity was determined by the KCl extraction method (Mclean, 1965) and organic carbon was at er dichromate wet oxidation method (Walkley and Black, 1934). h e organic matter content was got by multiplying a factor of percent organic carbon by 11.72. Cation exchange capacity (CEC) was calculated from the sum of all exchangeable cations. Available micronutrients were extracted with 1N NH4Cl solutions and determined by Atomic Absorption Spectrophotometer (AAS) (Water and Sammer, 1948 cited from Aruleba, 2004). Particle size analysis was done by the Bouyoucos (1951) method. Saturated hydraulic conductivity was determined using a constant head method and bulk density by core method. Soil porosity was estimated from the bulk density data at an assumed particle density of 2650 kgm-3. Water reten-tion at 15 bar was determined in order to calculate available water holding capacities of the soil proi le horizons (Mbagwu, 1985). Land evaluation. h e suitability of the soils was assessed for three crops (oil-palm, maize and cassava) that are commonly and currently grown in the study area following the method of
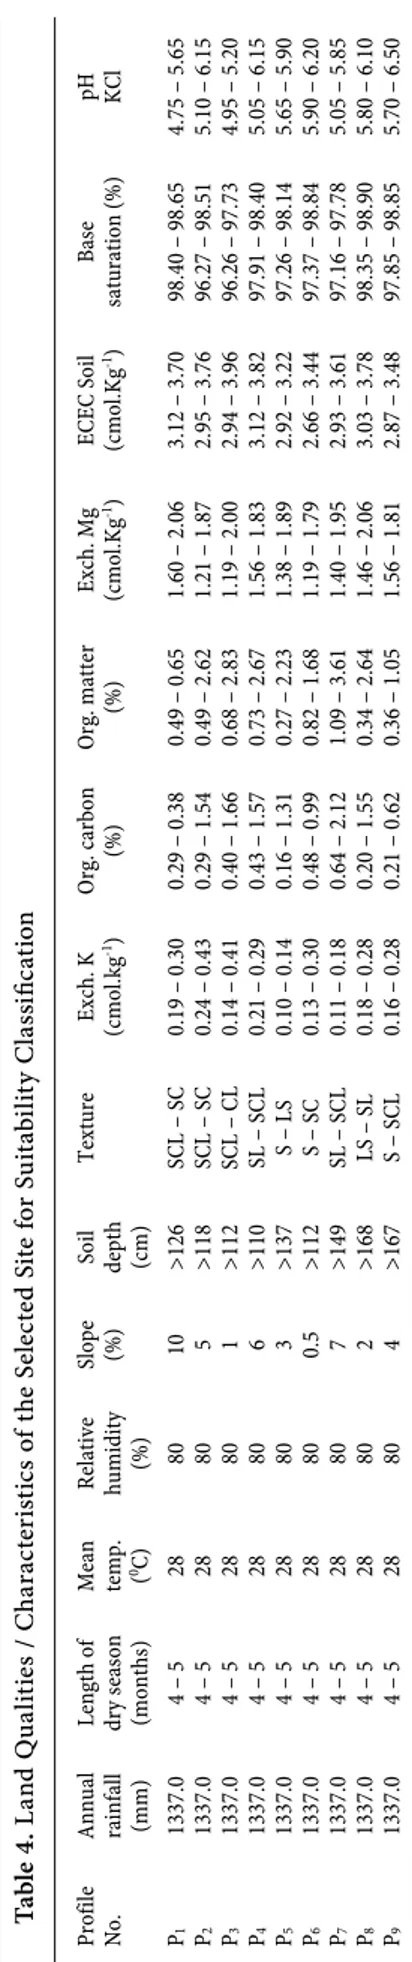
Sys (1985). h e detailed land and soil requirement for each of the crop are presented in Tables 1–3. Pedons were placed in suitabil-ity classes by matching their characteristics (Table 4) with the requirements of various crops (Tables 1-3). h e suitability class of a pedon is that indicated by its most limiting characteristics for the conventional approach (FAO, 1976).
For the parametric method, each limiting characteristic was rated as in Tables 1-3. h e index of productivity (actual and po-tential) was calculated using the following equation (Sys, 1985).
100 100 100 100 100
F E D C B A
IP
(c) (f) (w) (s) (f)
Where IP = Index of Productivity; A = overall fertility lim-iting and B, C … F are the lowest characteristic ratings of each land quality group. Five land quality groups climate (c), topog-raphy (t), soil physical properties (s), wetness (w) and fertility (f) were used in this method of evaluation. Only one member in each group was used for calculation purpose because there are usually strong correlations among members of the same group (e.g. texture and structure). For actual productivity index, all the lowest characteristics ratings for each land qualities group were substituted into the index of productivity equation above. However, in the case of potential productivity index, it was as-sumed that the corrective fertility measure will no longer have fertility constraints. Suitability classes S1, S2, S3 and N are equivalent to IP values of 100 – 75, 74 – 50, 49 – 25 and 24 – 0 respectively as shown in Table 5.
Land Qualities 100
S11
95 S12
85 S2
60 S3
40 N1
25 N2
Climate (c):
Annual rainfall (mm) 850-1250 850-750
1250-1600
750-600 1600-1800
600-500 >1800
550-500 >500
Length of growing Season (days)
150-220 220-270 130-150
270-325 110-130
325-335 90-110
335-345 90-100
>345 <90
Mean annual temp. (0C) 22-26 22-18
26-32
18-16 32+
16-14 14 <14
Relative humidity Developmental stage (%) 50-80 50-42 42-36 36-32 32-30 >30
Topography (t):
Slope (%) 0-2 2-4
4-8
4-8 8-16
8-16 16-30
30-50 >16 >50
Wetness: (w)
Drainage good
somewhat poorly drained
moderate moderate
somewhat poorly drained good
poor aeric
poor drainage
poor and very poor not drainable Soil physical properties (s):
Texture Cs, SiCs, CL Cs, SC, L, SCL SL, Lfs, LS LCS, Fs Cm, CL Cm, CS
Soil depth (cm) <100 75-100 50-75 30-50 20-30 <20
Fertility (f):
CEC (cmol. kgr1 clay) >24 16-24 <16 (-) <16 (+) <10 <10
Base saturation (%) >50 35-50 20-35 15-20 <15 <15
Organic matter (%C) >2 1.2-2 1.0-1.2 0.8-1.0 0.6-0.8 <0.6
(0-15cm) >1.5 >0.8
0.8-1.2 0.6-0.8
0.6-0.8 0.5-0.6
0.5-0.6 0.4-0.5
<0.5 <0.4
<0.5 <0.4
Symbols used for soil texture and structures are defined as follows: Cs: structure clay; Cm: massive clay; SiCs: silty clay, blocky clay; SiCL: silty clay loam; CL: clay loam; Si: silt; SiL: silty loam; SC: sandy clay; L: loam; SCL: sandy clay loam; SL: sandy loam; Lfs: loamy fine sand; LS: loam sand; LCS: loam coarse sand; Fs: fine sand; S: sand; CS: coarse sand.
Land degradation assessment by parametric approach. For each degradation process, the index of degradation was calcu-lated using the equation:
D = f (C, S, T, V, L, M) (FAO, 1979)
Where D = Index of Soil degradation, C = Climatic aggres-sivity factor, S = Soil factor, T = Topographic factor, V = Natural vegetable factor, L = Land use factor, and M = Management factor. h e degradation risk for each process was also calculated using the general formula (FAO, 1979).
D = f (C, S, T, K)
Where K = the constant, representing the standard condi-tion of V, L, and M.
h e land qualities / characteristics for grouping land into deg-radation classes are given in the Table 6. h e rating and determi-nation of the land qualities / characteristics of the land produced the various degradation classes for the soils given in Table 10.
Statistical Analyses. h e following statistical analyses were carried out:
– Rank correlation. Land use types, land suitability type and degree of degradation were ranked and the association
be-Land Qualities 100
S11
95 S12
85 S2
60 S3
40 N1
25 N2
Climatic (C):
Annual rainfall (mm) 1400-1800 1000-1400 1800-2400
750-600 >2400
600-550 550-500 <500
Length of growing season (months) 3-4 4-5 1-3
5-6 <1
6-7 7 <7
Mean temp. (0C) 26-20 26-30
20-18
>30
18-16 16-14 14-12 <12
Topography (t):
Slope (%) 0-4 4-8 8-16 16-30 30-50 >50
Wetness (w):
Drainage good good moderate somewhat
poorly drained
poor drainable poor, very poor not drainable Soil physical properties (s):
Texture L, SCL CS, SiCs, SiCL,
CL, SCL, SC
Cs, Lfs, LS, LCS, Fs
Cs, S, CS SC, Cm Cm, Si
Soil depth (cm) >125 >100 >75 >50 >55 <50
Fertility (f):
CEC (cmol/kg-1Clay) >16 Any <10 <10 <5 <5
Base saturation (%) >35 35-20 20-15 15-10 <10 <10
Organic matter (%C) (0-15cm) >1.5 0.8-1.5 <0.8 <0.5 <0.3 <0.2
Symbols used for soil texture and structures are defined as follows: Cs: structure clay; Cm: massive clay; SiCs: silty clay, blocky clay; SiCL: silty clay loam; CL: clay loam; Si: silt; SIL: silty loam; SC: sandy clay; L: loam; SCL: sandy clay loam; Lfs: loamy fine sand; LS: loam sand; LCS: loam coarse sand; Fs: fine sand; S: sand; CS: coarse sand.
Table 2. Land and Soil Requirements for Cassava (Modii ed from Sys, 1985)
Land Qualities 100
S11
95 S12
85 S2
60 S3
40 N1
25 N2
Climatic (C):
Annual rainfall (mm) >2000 1700-2000 1450-1700 1300-1450 1300-1250 <1250
Length of growing season (months) <1 1-2 2-3 3-4 3-4 <4
Mean annual temp. (0C) >25 22-25 20-22 18-20 16-18 <16
Relative humidity (%) >75 70-75 65-70 62-65 60-62 <60
Topography (t):
Slope (%) 0-4 4-8 8-16 16-30 >30 >30
Wetness (w):
Flooding Fo Fo F1 F2 F2 F3
Drainage somewhat
poorly drained
mod. well mod. well Poor aeric Poor, drainable Poor, very poor, not drainable Soil physical properties (s):
Texture CL, SCL, L CL, SCL, L SCL SCL-Lfs, Any C, Cs, any
Structure Blocky Blocky
Soil depth (cm) >125 >100 >75 >50 >55 <50
Fertility (f):
CEC (cmol/kg-1Clay) >16 Any <10 <10 <5 <5
Base saturation (%) >35 35-20 20-15 15-10 <10 <10
Organic matter (%C) (0-15cm) >1.5 0.8-1.5 <0.8 <0.5 <0.3 <0.2
Symbols used for soil texture, structure and flooding are defined as follows: Cs: structure clay; Cm: massive clay; SiCs: silty clay, blocky clay; SiCL: silty clay loam; CL: clay loam; Si: silt; SiL: silty loam; SC: sandy clay; L: loam; SCL: sandy clay loam; Lfs: loamy fine stand; LS: loam sand; Lcs: loam coarse sand; Fs: fine sand S: sand; CS: coarse sand. F0 = No flooding, F1 =1 – 2 flooding months in > 10 years, F2 = not more than 2 – 3 months in 5 years out of 10 years, F3 = 2 months almost every year, F4 = 2 – 3 months every year.
Agric. conspec. sci. Vol. 75 (2010) No. 1
13
Effect of Land Use on Soil Degradation and Soil Productivity Decline on Alfisols and Ultisols in Ogun State in South Western, Nigeria
tween them was estimated by the use of rank correlation co-ei cient.
– Multiple linear step-wise regression analysis (forward elimi-nation method). h is was employed to determine the relative contribution of each factor (land use types and suitability) to land degradation for each site. To achieve this objective, a step-down model that adds one variable to the regression equation at a time was used (SAS Inst., 1990). As each able was entered, the model incorporated a check on the vari-ance test. h e process of adding variables in turn continued until the contribution of the most recently entered variable was not signii cant at (P < 0.05) by the partial F-value. Any variable that provided a non-signii cant contribution was removed from the model.
Results and discussions
Land quality assessment
Land Suitability Evaluation (LSE)
h e matching of the land qualities / characteristics of the pedons (Table 4) with the land requirements of the crops (Tables 1 – 3) produced the various suitability classes for the various crops given in Tables 7 – 9.
Maize
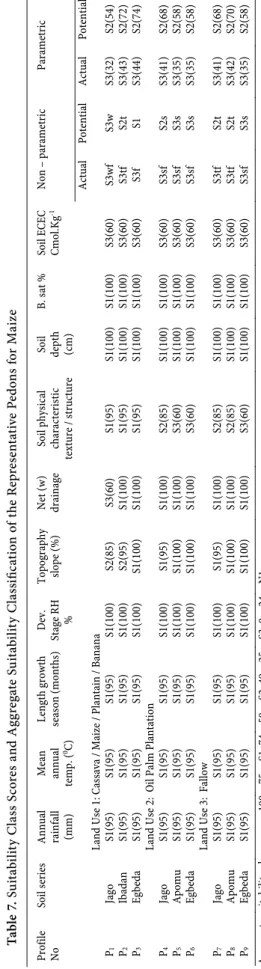
All the pedons are marginally suitable (S3) for both para-metric and non-parapara-metric approaches in all the land use types for maize production (Table 7). h e major limitations are soil texture and structure, which directly af ect water-holding ca-pacity, permeability of the soil and other physical properties. Other limiting factors are drainage and soil fertility, measured by CEC, organic matter and total nitrogen content.
Cassava
Table 8 shows the suitability of the soils for cassava produc-tion. At land use 1, about 66.7 % are moderately suitable (S2) and 33.3 % of the soils are not suitable (N1) using non-parametric method. At land use 2, about 33.3 % of the soils are permanently not suitable (N2) while the remaining 66.7 % are marginally suit-able (S3). About 66.7 % of soils in land use 3 are permanently not suitable (N2), while the remaining soils are moderately suitable (S2) with non-parametric approach. h e limitations found are poor soil structure and texture. h is af ects the aggregate and water-holding capacity of the soil. Other constraints include drainage and soil fertility.
Oil Palm
For oil palm production, the suitability of the soils is shown in Table 9. About 66.7% of the soils of land use 1 are currently not suitable (N1) and 33.3 % of the soils are marginally suitable (S3), while all the soils of land use types 2 and 3 are currently not suitable (N1). h e dominant limitations are climate (inadequate rainfall and length of dry season), soil texture and structure as well as drainage and soil fertility (CEC, organic matter + Total N).
Land degradation assessment by parametric method Physical Degradation
h e assessment of the present physical degradation for all the studied land use types determined from climate aggressivity
factor, soil factor, topography, vegetation, land use and manage- Profile No.
Annu
al
rainf
all
(mm)
Length of dry season (months) Mean temp. 0(
C)
Relative humidity
(%)
Slope (%)
So
il
depth (cm)
Texture Exch. K (cmol.kg -1) Org. carbon (%) Org. matter (%)
Exch. Mg (cmol.Kg
-1) ECEC So il (cmol.Kg -1) Base saturation (%)
pH KCl
P
1
1337.0
4 – 5
28 80 10 >126 SC L – SC 0.
19 – 0.30
0.29 – 0.38
0.49 –
0.65
1.60 – 2.06
3.12 – 3.
70
98.40 – 98.65
4.75 – 5.65
P2
1337.0
4 – 5
28 80 5 >118 SC L – SC 0.
24 – 0.43
0.29 – 1.54
0.49 –
2.62
1.21 – 1.87
2.95 – 3.
76
96.27 – 98.51
5.10 – 6.15
P
3
1337.0
4 – 5
28
80
1
>112
SC
L – C
L
0.
14 – 0.41
0.40 – 1.66
0.68 –
2.83
1.19 – 2.00
2.94 – 3.
96
96.26 – 97.73
4.95 – 5.20
P4
1337.0
4 – 5
28 80 6 >110 SL – SC L 0.
21 – 0.29
0.43 – 1.57
0.73 –
2.67
1.56 – 1.83
3.12 – 3.
82
97.91 – 98.40
5.05 – 6.15
P
5
1337.0
4 – 5
28 80 3 >137 S – LS
0.10 – 0.14
0.16 – 1.31
0.27 –
2.23
1.38 – 1.89
2.92 – 3.
22
97.26 – 98.14
5.65 – 5.90
P6
1337.0
4 – 5
28 80 0.5 >112 S – SC 0.
13 – 0.30
0.48 – 0.99
0.82 –
1.68
1.19 – 1.79
2.66 – 3.
44
97.37 – 98.84
5.90 – 6.20
P
7
1337.0
4 – 5
28 80 7 >149 SL – SC L 0.
11 – 0.18
0.64 – 2.12
1.09 –
3.61
1.40 – 1.95
2.93 – 3.
61
97.16 – 97.78
5.05 – 5.85
P8
1337.0
4 – 5
28 80 2 >168 L S – SL 0.
18 – 0.28
0.20 – 1.55
0.34 –
2.64
1.46 – 2.06
3.03 – 3.
78
98.35 – 98.90
5.80 – 6.10
P
9
1337.0
4 – 5
28 80 4 >167 S – SC L
0.16 – 0.28
0.21 – 0.62
0.36 –
1.05
1.56 – 1.81
2.87 – 3.
48
97.85 – 98.85
5.70 – 6.50
T able 4 . L a nd Q u a lit ie
s / C
h a ra cte ri st ic
s of t
h
e S
ele
ct
ed
Site for Su
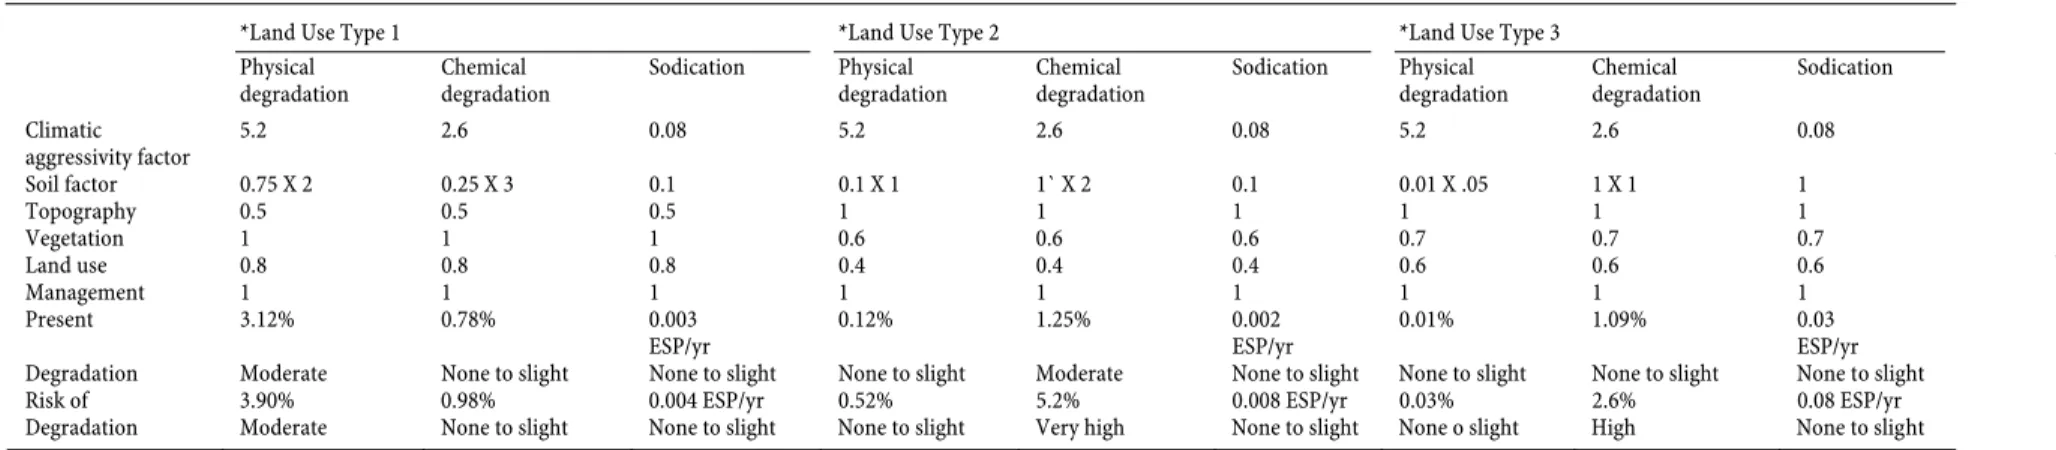
ment were as follows: 3.12 % (LUT 1); 0.12 % (LUT 2) and 5.2 % (LUT 3), hence the present physical degradation was none to slight for the land use type 2 and moderate for LUTs 1 and 3. While the risk of physical degradation was moderate for LUT 1 (3.90 %), and very high for LUT 3 (10.4 %), it was none to slight for LUT 2 with the risk of degradation of 0.52 %.
Chemical Degradation
h e assessment of the present chemical degradation deter-mined from climatic aggressivity factor, soil factor, topography, vegetation, land use and management for all the land use types was as follows 0.78 % (LUT 1) that is none to slight, 1.25 % (LUT 2) that is moderate and 2.6 % for LUT 3 that is high.
However, the risk of chemical degradation determined was very high for LUTs 2 and 3 (i.e. 5.2 %) and none to slight for LUT 1 (0.98 %).
Sodication
h e assessment of the present sodication determined from climatic aggressivity factor, soil factor, topography, vegetation, land use and management is none to slight for all the land use types with range between 0.0003 and 0.004 ESP/year. Hence, the risk of sodications for all the land use types is none to slight.
h e results of the land degradation assessment by parametric method show that the land degradation ranged between none to slight and high for physical and chemical degradation. h e
as-sessment of land degradation for oil palm based crop for physical Profile No
Soil series Annu al rainf all (mm) Mean annu al temp. ( 0C)
Length growth season (months)
Dev.
Stage R
H
%
Topography slope (%) Net (w) drainage Soil physical characteristic
texture /
structure
So
il
depth (cm)
B. s at % Soil ECEC Cmol.Kg -1
Non – p
arametric Parametric Actual Potential Actual Potential Land Use 1 : C assava / Maize / Pla ntain / Bana na P1 Jago S1(95) S1(95) S1(95) S1(100) S2(85) S3(60) S1(95) S1(100) S1(100) S3(60) S3wf S3w S3(32) S2(54) P2 Ibadan S1(95) S1(95) S1(95)
S1(100) S2(95) S1(100)
S1(95) S1(100) S1(100) S3(60) S3tf S2t S3(43) S2(72) P3 Egbeda S1(95) S1(95) S1(95)
S1(100) S1(100) S1(100)
S1(95) S1(100) S1(100) S3(60) S3f S1 S3(44) S2(74) L an d Us e 2: O il Pa lm Pl an ta tion P4 Jago S1(95) S1(95) S1(95)
S1(100) S1(95) S1(100)
S2(85) S1(100) S1(100) S3(60) S3sf S2s S3(41) S2(68) P5 Apomu S1(95) S1(95) S1(95)
S1(100) S1(100) S1(100)
S3(60) S1(100) S1(100) S3(60) S3sf S3s S3(35) S2(58) P6 Egbeda S1(95) S1(95) S1(95)
S1(100) S1(100) S1(100)
S3(60) S1(100) S1(100) S3(60) S3sf S3s S3(35) S2(58) Land Use 3
: Fallow
P7
Jago
S1(95)
S1(95)
S1(95)
S1(100) S1(95) S1(100)
S2(85) S1(100) S1(100) S3(60) S3tf S2t S3(41) S2(68) P8 Apomu S1(95) S1(95) S1(95)
S1(100) S1(100) S1(100)
S2(85) S1(100) S1(100) S3(60) S3tf S2t S3(42) S2(70) P9 Egbeda S1(95) S1(95) S1(95)
S1(100) S1(100) S1(100)
S3(60) S1(100) S1(100) S3(60) S3sf S3s S3(35) S2(58) Aggregate suitabilit y class
scores: 100 –
75 =
S1; 74
– 50
=
S2; 49 – 25
= S3 ; 0 – 24 = N1 T able 7 . Su it ab il it y C la ss S core s a n d A g g re g ate Su it ab il it y C la ssi i ca ti o n o f t h e R ep re se n ta ti ve P ed o n s f o r M a ize
Land Quality *Land Use Type
1 2 3 Rainfall annual (mm) 1337.0 1337.0 1337.0 Rainfall mean monthly (mm) 111.4 111.4 111.4 Potential evapotranspiraton
(PET) annual mean (mm)
1080.2 1080.2 1080.2
PET monthly mean (mm) 90.0 90.0 90.0
Air temp (0C) 28 28 28
Erodibility class III II I
Silt 3.8 3.9 2.13
% clay 9.5 10.6 5.9
% O. M 1.58 0.87 1.28
Soil factor (physical) 0.75 X 2 0.1 X 1 0.01 X 0.5 Soil factor (chemical) 0.25 X 3 1 X 2 1 X 1
Soil factor (sodication) 0.1 0.1 1
Soil texture class 1 1 1
Clay type 1 1 1
Topography 0.5 1 1
Vegetation 1 0.6 0.7
Land use 0.8 0.4 0.6
Management 1 1 1
* Land Use Type1=Cassava/Maize; 2=Oil Palm; 3=Building Site Index of productivity values Suitability classes
100-75 S1 75-50 S2 49-25 S3 24-0 N
Table 5. Productivity index and corresponding suitability
classes
Table 6. Land Qualities/Characteristics for Parametric
A
g
ri
c.
c
o
n
sp
ec.
s
ci
. V
o
l. 7
5
(
2
01
0)
N
o
. 1
15
E
ffe
ct
o
f L
an
d
U
se o
n
S
o
il D
eg
ra
d
at
io
n a
n
d S
o
il P
ro
d
uc
tiv
it
y D
ec
lin
e o
n
A
lf
is
o
ls
a
n
d U
lti
so
ls
i
n
O
g
u
n
St
ate i
n
S
o
u
th W
es
ter
n
,
Ni
ge
ri
a
Profile No
Soil series
Annual rainfall (mm)
Mean annual temp. (0C)
Length growth season (months)
Dev. stage RH
%
Topography slope (%)
Net (w) drainage
Soil physical characteristic texture / structure
Soil depth
(cm)
B. sat % Soil ECEC Cmol.Kg-1
Non – parametric Parametric
Actual Potential Actual Potential
Land Use 1: Cassava / Maize /Plantain/Banana
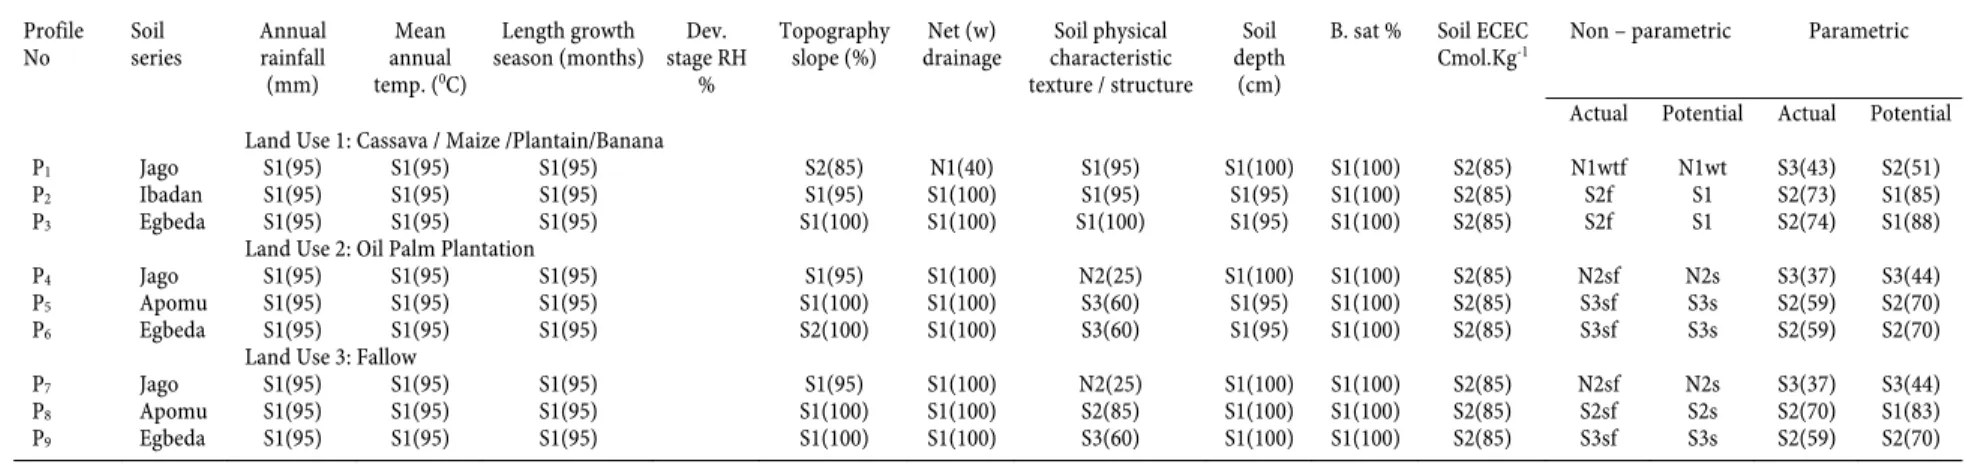
P1 Jago S1(95) S1(95) S1(95) S2(85) N1(40) S1(95) S1(100) S1(100) S2(85) N1wtf N1wt S3(43) S2(51)
P2 Ibadan S1(95) S1(95) S1(95) S1(95) S1(100) S1(95) S1(95) S1(100) S2(85) S2f S1 S2(73) S1(85)
P3 Egbeda S1(95) S1(95) S1(95) S1(100) S1(100) S1(100) S1(95) S1(100) S2(85) S2f S1 S2(74) S1(88)
Land Use 2: Oil Palm Plantation
P4 Jago S1(95) S1(95) S1(95) S1(95) S1(100) N2(25) S1(100) S1(100) S2(85) N2sf N2s S3(37) S3(44)
P5 Apomu S1(95) S1(95) S1(95) S1(100) S1(100) S3(60) S1(95) S1(100) S2(85) S3sf S3s S2(59) S2(70)
P6 Egbeda S1(95) S1(95) S1(95) S2(100) S1(100) S3(60) S1(95) S1(100) S2(85) S3sf S3s S2(59) S2(70)
Land Use 3: Fallow
P7 Jago S1(95) S1(95) S1(95) S1(95) S1(100) N2(25) S1(100) S1(100) S2(85) N2sf N2s S3(37) S3(44)
P8 Apomu S1(95) S1(95) S1(95) S1(100) S1(100) S2(85) S1(100) S1(100) S2(85) S2sf S2s S2(70) S1(83)
P9 Egbeda S1(95) S1(95) S1(95) S1(100) S1(100) S3(60) S1(100) S1(100) S2(85) S3sf S3s S2(59) S2(70)
Aggregate suitability class scores: 100 – 75 = S1; 74 – 50 = S2; 49 – 25 = S3; 0 – 24 = N1
Table 8. Suitability Class Scores and Aggregate Suitability Classii cation of the Representative Pedons for Cassava
Table 9. Suitability Class Scores and Aggregate Suitability Classii cation of the Representative Pedons for Oil Palm
Profile No
Soil series Annual rainfall (mm)
Mean annual temp. (0C)
Length growth season
(months)
Dev. stage RH
%
Topography slope (%)
Net (w) drainage
Soil physical characteristic texture/structure
Soil depth
(cm)
B. sat % Soil ECEC Cmol.Kg-1
Org. arbon %
Non-parametric Parametric
Actual Potential Actual Potential Land Use 1: Cassava / Maize /Plantain /Banana
P1 Jago S3(60) S1(100) S3(60) S1(100) S2(85) S3(60) N1(40) S1(100) S1(100) S3(60) N1(40) N1cwtf N1t N1(11) S3(27)
P2 Ibadan S3(60) S1(100) S3(60) S1(100) S1(95) S1(95) N1(40) S1(100) S1(100) S3(60) N1(40) N1csf N1s N(12) S3(29)
P3 Egbeda S3(60) S1(100) S3(60) S1(100) S1(100) S1(95) S1(100) S1(100) S1(100) S3(60) S3(60) S3cf S3s S3(35) S2(58)
Land Use 2: Oil Palm Plantation
P4 Jago S3(60) S1(100) S3(60) S1(100) S1(95) S1(95) S3(60) S1(100) S1(100) S3(60) N1(40) N1csf S3cs N(14) S3(36)
P5 Apomu S3(60) S1(100) S3(60) S1(100) S1(100) S1(95) N1(40) S1(100) S1(100) S3(60) S3(60) N1csf N1cs N(22) S3(37)
P6 Egbeda S3(60) S1(100) S3(60) S1(100) S1(100) S1(95) N1(40) S1(100) S1(100) S3(60) S3(60) N1csf N1cs N(22) S3(37)
Land Use 3: Fallow
P7 Jago S3(60) S1(100) S3(60) S1(100) S1(95) S1(95) S3(60) S1(100) S1(100) S3(60) S2(85) S3csf S3cs S3(26) S3(44)
P8 Apomu S3(60) S1(100) S3(60) S1(100) S1(100) S1(95) S3(60) S1(100) S1(100) S3(60) N1(40) N1csf S3cs N(15) S3(37)
P9 Egbeda S3(60) S1(100) S3(60) S1(100) S1(100) S1(95) N1(40) S1(100) S1(100) S3(60) N1(40) N1csf N1cs N(12) S3(30)
A
g
ri
c.
c
o
n
sp
ec.
s
ci
. V
o
l. 7
5
(
2
01
0)
N
o
. 1
la
ri
n
wa
A
yoo
la
S
E
N
JO
B
I,
O
la
y
iw
o
la
A
yo
ad
e OG
U
N
K
U
N
L
E
Table 11. Rank Correlation Coei cients between Land Use Types, Land Type, Land Suitability and Land Degradation in Land Use Type 1 (Cassava/Maize)
Table 10. Degradation Class Scores by Parametric Method for the Land Use Type Sites
*Land Use Type 1 *Land Use Type 2 *Land Use Type 3 Physical
degradation
Chemical degradation
Sodication Physical degradation
Chemical degradation
Sodication Physical degradation
Chemical degradation
Sodication
Climatic aggressivity factor
5.2 2.6 0.08 5.2 2.6 0.08 5.2 2.6 0.08
Soil factor 0.75 X 2 0.25 X 3 0.1 0.1 X 1 1` X 2 0.1 0.01 X .05 1 X 1 1
Topography 0.5 0.5 0.5 1 1 1 1 1 1
Vegetation 1 1 1 0.6 0.6 0.6 0.7 0.7 0.7
Land use 0.8 0.8 0.8 0.4 0.4 0.4 0.6 0.6 0.6
Management 1 1 1 1 1 1 1 1 1
Present 3.12% 0.78% 0.003 ESP/yr
0.12% 1.25% 0.002 ESP/yr
0.01% 1.09% 0.03 ESP/yr
Degradation Moderate None to slight None to slight None to slight Moderate None to slight None to slight None to slight None to slight Risk of 3.90% 0.98% 0.004 ESP/yr 0.52% 5.2% 0.008 ESP/yr 0.03% 2.6% 0.08 ESP/yr Degradation Moderate None to slight None to slight None to slight Very high None to slight None o slight High None to slight
* Land Use Type1=Cassava/Maize; 2=Oil Palm; 3=Fallow
LUT LT Oil palm Cassava Maize B.D (g/cm3)
Permeability (cm/hr)
B. sat (%)
N (cmol.kg-1)
P (mg/kg-1)
K (cmol.kg-1)
ESP (%)
Organic matter content (%) LUT - -0.365 -0.218 -0.509* a -0.250 0.250 a -0.179 0.391 -0.311 -0.688** -0.378 LT - 0.937** 0.717** a 0.021 -0.021 a -0.259 0.010 0.273 0.251 -0.037 Oil palm 0.429 a 0.055 -0.055 a -0.245 -0.058 0.108 0.150 -0.097
Plantain a a A a a A a a a a
Cassava a -0.055 0.055 a -0.181 0.140 0.492* 0.350 0.097
Maize A a a A a a a a
B.D -0.063 a -0.220 -0.208 0.055 -0.115 -0.543*
Permeability a -0.147 0.019 0.220 0.115 -0.197
B. Sat A a a a a
N -0.312 0.035 0.011 0.764**
P -0.131 -0.269 -0.237
K 0.340 0.160
Esp 0.260
Organic matter content
A
g
ri
c.
c
o
n
sp
ec.
s
ci
. V
o
l. 7
5
(
2
01
0)
N
o
. 1
17
E
ffe
ct
o
f L
an
d
U
se o
n
S
o
il D
eg
ra
d
at
io
n a
n
d S
o
il P
ro
d
uc
tiv
it
y D
ec
lin
e o
n
A
lf
is
o
ls
a
n
d U
lti
so
ls
i
n
O
g
u
n
St
ate i
n
S
o
u
th W
es
ter
n
,
Ni
ge
ri
a
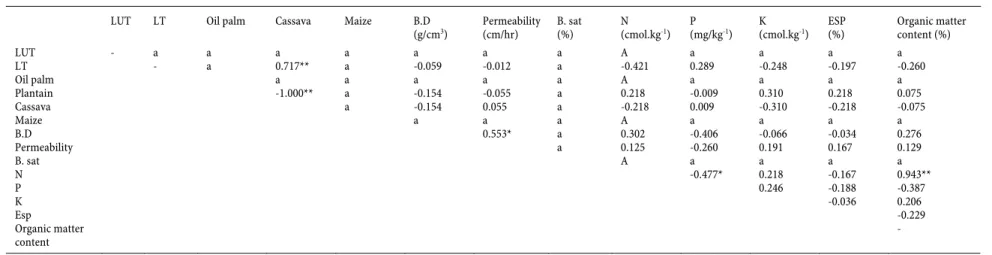
Table 12. Rank Correlation Coei cients between Land Use Types, Land Type, Land Suitability and Land Degradation in Land Use Type 2 (Oil Palm)
LUT LT Oil palm Cassava Maize B.D (g/cm3)
Permeability (cm/hr)
B. sat (%)
N (cmol.kg-1)
P (mg/kg-1)
K (cmol.kg-1)
ESP (%)
Organic matter content (%)
LUT - a a a a a a a A a a a a
LT - a 0.717** a -0.059 -0.012 a -0.421 0.289 -0.248 -0.197 -0.260
Oil palm a a a a a A a a a a
Plantain -1.000** a -0.154 -0.055 a 0.218 -0.009 0.310 0.218 0.075 Cassava a -0.154 0.055 a -0.218 0.009 -0.310 -0.218 -0.075
Maize a a a A a a a a
B.D 0.553* a 0.302 -0.406 -0.066 -0.034 0.276
Permeability a 0.125 -0.260 0.191 0.167 0.129
B. sat A a a a a
N -0.477* 0.218 -0.167 0.943**
P 0.246 -0.188 -0.387
K -0.036 0.206
Esp -0.229
Organic matter content
-
* = significant at 5%; ** =significant at 1%; a = cannot be computed because at least one of the variables is constant.
Table 13. Rank Correlation Coei cients between Land Use Types, Land Type, Land Suitability and Land Degradation in Land Use Type 3 (Building Site)
LUT LT Oil palm Cassava Maize B.D (g/cm3)
Permeability (cm/hr)
B. sat (%)
N (cmol.kg-1)
P (mg/kg-1)
K (cmol.kg-1)
ESP (%)
Organic matter content (%)
LUT - A a a a A a a A a a a A
LT -0.717** 0.445* a 0.349 -0.547* a 0.137 0.105 0.040 a -0.093 Oil palm -0.943** a -0.524* 0.764** a -0.290 -0.039 -0.275 a 0.027 Plantain -0.105 a -0.190 0.327 a -0.032 -0.116 -0.085 a 0.107 Cassava a 0.507* -0.721** a 0.307 0.000 0.334 a 0.010
Maize A a a A a a a A
B.D -0.218 a 0.531* -0.116 0.559* a 0.510*
Permeability a -0.037 -0.266 -0.065 a 0.277
B. Sat a a a a A
N 0.026 0.134 a 0.472*
P -0.192 a -0.218
K a 0.192
Esp A
Organic matter content
-
nii cant (P < 0.01) for some physical properties (i.e. permeabil-ity, bulk density), chemical properties (total N, K and nitrogen) and biological properties (organic matter content) and signii -cant (P < 0.05) for some physical (bulk density) and chemical (potassium) in most of the land use sites. h is is an indication that crops that were planted on the land are not suitable and ap-propriate for the potential capacity of the soil. h is suggests that when lands are not used according to their suitabilities classii ca-tion, they tend to have much ef ect on the soil physical proper-ties. h e ef ect of suitability on the chemical degradation may be undoubtedly due to excessive crop uptake coupled with nutrient loss through leaching. h is result of rank correlation between land use type and land suitability showed that correlation was statistically non-signii cant at all the land use sites and this in-dicate unappreciable relationship between them.
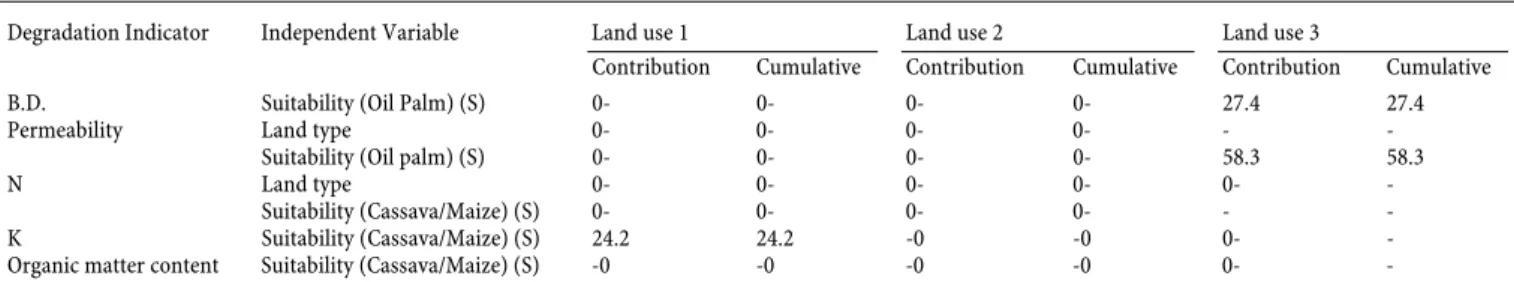
h e result of the multiple linear stepwise regression analysis (Table 14) showed that factors contributing to dif erent forms of degradation dif er from one land use type to another and suggests that virtually most of the degradation forms are con-tributed to by suitability in all the land use types. h is could be attributed to the exploitative nature of the crops which are mainly cassava/maize and oil palm as well as exposure of land by the arable crops.
Building site and arable-based crops land use types showed greater decline in physical and chemical properties following the exposure of the soils to erosion menace and over-exploitation of the nutrients by soil depleting crops. h e dif erences observed in physical and chemical properties of the soils under these land use types could probably be explained mainly on the basis of nutrient cycling and farm management practices (Adejuwon and Ekanade, 1988; Senjobi, 2007). In the oil palm based land use, the sandy texture of the soils, which does not only result in the excessive drainage and retention of little moisture, encourages the leaching of essential nutrients especially exchangeable K that is needed for high yield in oil palm production (as reported by Tinker, 1963; and Ataga et. al., 1981). Ogunkunle (1993) and Senjobi (2001) also noted that loss of potassium through leaching in an oil palm plantation leads to decrease in the optimum yield.
It is important to note that inappropriate allocation of land for any use hinder the optimization of agricultural and land man-agement practices coupled with the choice of the crops (which are soil depleting crops) and absence of residue management practices on the part of the farmers must have probably ampli-i ed these changes (Senjobampli-i, 2007). Also, the sandy texture of the soils make them highly vulnerable to one form of erosion or the
Table 14. Stepwise Multiple Linear Regression Analysis of Land Use Types, Land Types, Land Suitability and Land Degradation
Degradation Indicator Independent Variable Land use 1 Land use 2 Land use 3
Contribution Cumulative Contribution Cumulative Contribution Cumulative
B.D. Suitability (Oil Palm) (S) 0- 0- 0- 0- 27.4 27.4
Permeability Land type 0- 0- 0- 0- - -
Suitability (Oil palm) (S) 0- 0- 0- 0- 58.3 58.3
N Land type 0- 0- 0- 0- 0- -
Suitability (Cassava/Maize) (S) 0- 0- 0- 0- - -
K Suitability (Cassava/Maize) (S) 24.2 24.2 -0 -0 0- -
Organic matter content Suitability (Cassava/Maize) (S) -0 -0 -0 -0 0- -
Model for Land degradation: Land use 1 - Potassium, Y = 0.38 + 0.49S1 – 0.08LUT - 0.16LT – 0.13S2 ; Land use 3 - Permeability, Y=2.93 – 0.15S1 – 0.28LT; Potassium, Y=0.53 + 0.30SY + 0.60LT; LUT – Land use type, LT – Land type, S1 – Cassava/Maize, S2 – Oil palm
showed none to slight degradation. Degradation was moderate for arable based crops. It was moderate for present degradation and high for risk of degradations for building site with respect to physical parameters.
h e present degradation and risk of degradation were high and very high chemically for building site and it was moderate and very high respectively for oil palm based crop. However, the present and risk of degradation for chemical were both none-slight for arable-based crops. With the parametric method of assessment, all characteristics of the soil, climate, environ-ment and manageenviron-ment factors are considered in the assessenviron-ment while in the case of direct method, the soil quality decides the degradation class, apart from this the parametric method is multiplicative and more stricter on the soil factor and climate than other method. h e risk of land degradation was assessed i rst, using the data on the physical aspects of the environment. Subsequently the present rate of degradation was derived from the risk by introducing the human factors of land use and soil management (FAO, 1979).
It was observed form the LSE results that soil texture was the major soil constraint to optimum performance of both arable and the cash crops production in the experimental area. h is is because soil texture is very vital in relation to the soil nutri-ent status and soil moisture retnutri-ention (Senjobi, 2007). However, most of the pedons were found to be marginally suitable for all the commonly grown crops despite the appreciable content of organic matter in the soils. h is is because the sandy texture of the soils as well as high concentration of the gravel in the soil must have encouraged the leaching of the available soil nutri-ents thereby limiting the suitability of the planted crops (Senjobi, 2007). However, good soil management practices that encour-age the use of organic manure, cultivation of cover crops, zero tillage as well as correct usage of the land for the use it is meant for are required before substantial improvement and sustainable production can be achieved.
sig-Agric. conspec. sci. Vol. 75 (2010) No. 1
19
Effect of Land Use on Soil Degradation and Soil Productivity Decline on Alfisols and Ultisols in Ogun State in South Western, Nigeria
other upon exposure and consequently increase the degradation processes. h e observed decline in NPK could be attributed to reduction of organic matter content during tillage and manage-ment practices and nitrate – nitrogen (NO3 –N) loss by leaching and crop mining through uptake (Agboola, 1987).
Application of inorganic fertilizers, organic manures, cultiva-tion of cover crops, and correct usage of the land for the purpose it is best suited for will go a long way to reduce the degradation level of the soils.
Prevention of surface wash and its consequences through mulching of the soils throughout the year (Lal, 1975) will help in reducing the energy impact of both rain drops and leaf drops and will prevent serious run of and erosion of the topsoil. In view of the competition between agricultural land use and non-agricultural uses for limited land space, steps should be taken to stop the loss of good agricultural lands to non-agricultural uses (Senjobi, 2001). h is will go a long way to combat degra-dation processes.
Conclusions
h e degradation processes were very prominent under build-ing site and cassava and maize based croppbuild-ing systems and very high under oil palm based crop.
Land suitability contributed greatly to land degradation in all land use sites. Land use type signii cantly correlated with land degradation, that is, it inl uenced signii cantly land degra-dation chemically. Physical degradegra-dation accounted for most of the degraded soils in all the land use types.
In view of the above, land use type and land suitability need to be considered in taking appropriate approach to soil degra-dation, rehabilitation or improvement for agricultural uses in the sites under study.
It was observed that the land use types employed on the study sites were not very compatible with the characteristics of the soil. h is inappropriate allocation of land to uses coupled with the inadequate agricultural techniques enhanced the ex-posure of farm lands and predisposed the soils to both water and wind erosion.
To take adequate care of these dei ciencies, and minimize land degradation in the study sites, the following measures are recom-mended: plausible land use approach, multiple cropping, uses of organic mulching, contour ridge and cultivation of cover crops.
In addition to the above measures, there is the need to under-stand the soil adequately through detailed soil survey and land evaluation. When this is carefully done, the soil can then be put to appropriate land use i.e. cultivate the crops that are most suit-able for the land having known its capability and constraints.
References
Adejuwon, J. O. and Ekanade, O. (1987). Edaphic component of the enviromental degradation resulting from the replacement of Tropical rain forest by i eld and tree crops in South Western Nigeria. International Tree Crops Journal (UK). 4(4): 269 – 282. Agboola, A. A. (1987). Farming system in Nigeria. Proceedings on
Land development and management of Acid Tropical soil in Africa. Lusaka Zambia 9 – 16 April 1987 67 – 81.
Aruleba, J. O. (2004). Inl uence of cropping systems and land types on land suitability and degradation in South Western Nigeria. A Ph.D. thesis in the Department of Agronomy, University of Ibadan. 242pp.
Ataga D. O; Omoti, U; and Uzu, F. O. (1981). Management of the acid sand in Nigeria for tree crop production. In: Acid sands of Southern Nigeria. Soil Science Society of Nigeria Special Publication 1, pp. 86 – 150.
Bouyoucos, G. H. (1951). A recalibration of the hydrometer for making mechanical analysis of soils. Agronomy Journal 43: 434 – 438.
FAO (1976). A framework for land evaluation. Soil Bulletin 32, FAO Rome 79 pp.
FAO (1979). A provisional methodology for soil degradation assessment. FAO Rome 84 pp.
FAO (1984). Guidelines for land evaluation for Rainfed Agriculture. FAO Soils Bulletin No. 52 FAO, Rome 237 pp.
FAO (1984). Guidelines for land use planning. FAO development series. FAO Rome 96 pp.
FAO, (1984). Keeping the land Alive: Soil Erosion – its causes and cures. (E.F.S). FAO Soils Bull No. 50.
FAO, (1984). Land food and people. Economic and Social Development Series No. 30 FAO, Rome.
FAO/UNESCO (2006). A Framework for International Classii cation, Correlation and Communication. World Soil Resources Reports. No. 103, FAO, Rome.
Fasina, A. S. (1996). Land use and land quality in selected areas of Lagos State. A Ph. D. thesis in the Dept. of Agronomy, University of Ibadan. 229pp.
Jackson, M.L. (1962). Soil chemical analysis. Prentice Hall, New York.
Lal, R. (1975). Role of Mulching Techniques in Tropical Soils and Water Management. I.I.T.A. Technical Bulletin No. 1.
Mbagwu, J. S. C. (1985). Estimating dry season water requirements from climatological and soil available capacity data in the sedimentary and basement complex areas of south Nigeria. Catena Vol. 12:201-209.
Mclean, E. O. (1965). Aluminum: In methods of soil analysis (ed. C. A. Black) Agronomy No. 9 Part 2, Amer. Soc. Agronomy, Madison, Wisconsin, 978 – 998.
Ogunkunle, A.O. (1993). Soil in land suitability evaluation. An example with oil palm in Nigeria. Soil Use and Management 9:35-40.
Ogunkunle, A.O. and Eghaghara, O.O. (1992). Inl uence of land use on soil properties in a forest region of Southern Nigeria. Soil Use and Management. 8(3): 121-125.
Senjobi, B.A. (2001). Parametric and conventional approaches for soil potential evaluation in three ecological zones of southern Nigeria. Moor Journal of Agricultural Research 2(2): 91-102. Senjobi, B. A. (2007). Comparative Assessment of the Ef ect of Land
Use and Land Type on Soil Degradation and Productivity in Ogun State, Nigeria. 161pp. Unpublished Ph.D. h esis submitted to the Department of Agronomy, University of Ibadan, Nigeria. Soil Survey Staf (2003). Keys to Soil Taxonomy, USDA SMSS
Technical Monograph No. 9, Cornell University 332pp. Sparks, D. L. (1996). Methods of Soil Analysis. Part 3. Chemical
Methods. SSSA and ASA. Madison, W1. p. 551-574.
Sys, C. (1985). Land evaluation. International Training Centre for Postgraduate Soil Scientists Vol. I, II and III State Univ. Ghent. Tinker, P.B.H. (1963). Changes occuring in the sedimentary soils
of Southern Nigeria at er oil palm plantation establishment. Journal of the West African Institute for Oil Palm Research 4: 66 – 81.
Walkley, A. and Black, I.A. (1934): Determination of organic matter in soil. Soil Science 37, 549-556.