with Tailored Random Networks
Stephan Bialonski1,2,3*, Martin Wendler4, Klaus Lehnertz1,2,3
1Department of Epileptology, University of Bonn, Bonn, Germany, 2Helmholtz Institute for Radiation and Nuclear Physics, University of Bonn, Bonn, Germany,
3Interdisciplinary Center for Complex Systems, University of Bonn, Bonn, Germany,4Fakulta¨t fu¨r Mathematik, Ruhr-Universita¨t Bochum, Bochum, Germany
Abstract
We investigate interaction networks that we derive from multivariate time series with methods frequently employed in diverse scientific fields such as biology, quantitative finance, physics, earth and climate sciences, and the neurosciences. Mimicking experimental situations, we generate time series with finite length and varying frequency content but from independent stochastic processes. Using the correlation coefficient and the maximum cross-correlation, we estimate interdependencies between these time series. With clustering coefficient and average shortest path length, we observe unweighted interaction networks, derived via thresholding the values of interdependence, to possess non-trivial topologies as compared to Erdo¨s-Re´nyi networks, which would indicate small-world characteristics. These topologies reflect the mostly unavoidable finiteness of the data, which limits the reliability of typically used estimators of signal interdependence. We propose random networks that are tailored to the way interaction networks are derived from empirical data. Through an exemplary investigation of multichannel electroencephalographic recordings of epileptic seizures – known for their complex spatial and temporal dynamics – we show that such random networks help to distinguish network properties of interdependence structures related to seizure dynamics from those spuriously induced by the applied methods of analysis.
Citation:Bialonski S, Wendler M, Lehnertz K (2011) Unraveling Spurious Properties of Interaction Networks with Tailored Random Networks. PLoS ONE 6(8): e22826. doi:10.1371/journal.pone.0022826
Editor:Michal Zochowski, University of Michigan, United States of America
ReceivedJune 1, 2011;AcceptedJuly 2, 2011;PublishedAugust 5, 2011
Copyright:ß2011 Bialonski et al. This is an open-access article distributed under the terms of the Creative Commons Attribution License, which permits unrestricted use, distribution, and reproduction in any medium, provided the original author and source are credited.
Funding:MW and SB were supported by the German National Academic Foundation. SB and KL acknowledge support from the German Science Foundation (LE 660/4-2). The funders had no role in study design, data collection and analysis, decision to publish, or preparation of the manuscript.
Competing Interests:The authors have declared that no competing interests exist. * E-mail: bialonski@gmx.net
Introduction
The last years have seen an extraordinary success of network theory and its applications in diverse disciplines, ranging from sociology, biology, earth and climate sciences, quantitative finance, to physics and the neurosciences [1–4]. There is now growing evidence that research into the dynamics of complex systems profits from a network perspective. Within this framework, complex systems are considered to be composed of interacting subsystems. This view has been adopted in a large number of modeling studies and empirical studies. It is usually assumed that the complex system under study can be described by aninteraction network, whose nodes represent subsystems and whose links
represent interactions between them. Interaction networks derived from empirical data (multivariate time series) have been repeatedly studied in climate science (climate networks, see [5–9] and references therein), in seismology (earthquake networks, see, e.g., [10–13]), in quantitative finance (financial networks, see e.g. [14– 18] and references therein), and in the neurosciences (brain functional networks, see [19,20] for an overview). Many interaction networks have been reported to possess non-trivial properties such as small-world architectures, community struc-tures, or hubs (nodes with high centrality), all of which have been considered to be characteristics of the dynamics of the complex system.
When analyzing empirical data one is faced with the challenge of defining nodes and inferring links from multivariate noisy time series with only a limited number of data points due to stationarity
requirements. Different approaches varying to some degree across disciplines have been proposed. For most approaches, each single time series is associated with a node and inference of links is based on time series analysis techniques. Bivariate time series analysis methods, such as the correlation coefficient, are used as estimators of signal interdependence which is assumed to be indicative of an interaction between different subsystems. Inferring links from estimates of signal interdependence can be achieved in different ways. Weighted interaction networks can be derived by consid-ering estimated values of signal interdependence (sometimes mapped via some function) as link weights. Since methods characterizing unweighted networks are well-established and readily available, such networks are more frequently derived from empirical data. Besides approaches based on constructing minimum spanning trees (see, e.g., reference [14]), on significance testing [21–23], or on rank-ordered network growth (see, e.g., reference [15]), a common practice pursued in many disciplines is to choose a threshold above which an estimated value of signal interdependence is converted into a link (‘‘thresholding’’, see, e.g., references [5,12,16,20]). Following this approach, the resulting unweighted interaction networks have been repeatedly investigat-ed employing various networks characteristics, among which we mention the widely-used clustering coefficient C and average shortest path length L to assess a potential small-world characteristic, and the node degrees in order to identify hubs.
neurosciences [29–31]; the issue of spatial sampling of complex systems [31–33]. This calls not only for a careful interpretation of results but also for the development of appropriate null models that incorporate knowledge about the way networks are derived from empirical data.
We study – from the perspective of field data analysis – a fundamental assumption underlying the network approach, namely that the multivariate time series are obtained from interacting dynamical processes and are thus well represented by a model of mutual relationships (i.e., an interaction network). Visual inspection of empirical time series typically reveals a perplexing variety of characteristics ranging from fluctuations on different time scales to quasi-periodicity suggestive of different types of dynamics. Moreover, empirical time series are inevitably noisy and finite leading to a limited reliability of estimators of signal interdependencies. This is aggravated with the advent of time-resolved network analyses where a good temporal resolution often comes at the cost of diminished statistics. Taken together, it is not surprising that the suitability of the network approach is notoriously difficult to judge prior to analysis.
We here employ the above-mentioned thresholding-approach to construct interaction networks for which we estimate signal interdependence with the frequently used correlation coefficient and the maximum cross correlation. We derive these networks, however, from multivariate time series of finite length that are generated by independent (non-interacting) processes which would a priori not advocate the notion of a representation by a model of mutual relationships. In simulation studies we investigate often used network properties (clustering coefficient, average shortest path length, number of connected components). We observe that network properties can deviate pronouncedly from those observed in Erdo¨s-Re´nyi networks depending on the length and the spectral content of the multivariate time series. We address the question whether similar dependencies can also be observed in empirical data by investigating multichannel electroencephalographic (EEG) recordings of epileptic seizures that are known for their complex spatial and temporal dynamics. Finally, we propose random networks that are tailored to the way interaction networks are derived from multivariate empirical time series.
Methods
Interaction networks are typically derived fromN multivariate time series xi (i[f1,. . .,Ng) in two steps. First, by employing
some bivariate time series analysis method, interdependence between two time seriesxi(t)andxj(t)(t[f1,. . .,Tg) is estimated
as an indicator for the strength of interaction between the underlying systems. A multitude of estimators [34–40], which differ in concepts, robustness (e.g., against noise contaminations), and statistical efficiency (i.e., the amount of data required), is available. Studies that aim at deriving interaction networks from
rm
ij :~maxt
j(xi,xj)(t)
ffiffiffiffiffiffiffiffiffiffiffiffiffiffiffiffiffiffiffiffiffiffiffiffiffiffiffiffiffiffiffiffiffiffiffiffiffiffiffiffiffi j(xi,xi)(0)j(xj,xj)(0)
p
( )
, ð2Þ
with
j(xi,xj)(t):~
PT{t
t~1 xi(tzt)xj(t) ,t§0
j(xj,xi)({t) ,tv0
(
ð3Þ
to define the entries of the cross correlation matrix rm. As practiced in field data analysis, we normalize the time series to zero mean before pursuing subsequent steps of analysis. Note that rm
ij is then the maximum value of the absolute cross covariance
function. Both interdependence estimators are symmetric (rc
ij~rcji
andrm
ij~rmji) and are confined to the interval½0,1. High values
indicate strongly interdependent time series while dissimilar time series result in values close to zero forTsufficiently large.
Second, the adjacency matrix A representing an unweighted undirected interaction network is derived from rc (or rm) by thresholding. For a thresholdh[½0,1entriesAij andAjiofAare set to1(representing an undirected link between nodesiandj) for all entriesrc
ijwh(rmijwh, respectively) withi=j, and to zero (no
link) otherwise. In many studies h is not chosen directly but determined such that the derived network possesses a previously specified mean degree kk:~N{1P
iki, where ki denotes the
degree ofi, i.e., the number of links connected to nodei. More frequently,his chosen such that the network possesses a previously specified link density E~kk(N{1){1
. We will follow the latter approach and derive networks for fixed values ofE.
To characterize a network as defined by A, a plethora of methods have been developed. Among them, the clustering coefficientCand the average shortest path lengthLare frequently used in field studies. The local clustering coefficientCiis defined as
Ci:~
1
ki(ki{1)
P
j,mAijAjmAmi, if kiw1 0, if ki[f0,1g:
(
ð4Þ
Cirepresents the fraction of the number of existing links between
neighbors of node i among all possible links between these neighbors [1,2,41]. The clustering coefficientCof the network is defined as the mean of the local clustering coefficients,
C:~1 N
XN
i~1
Ci: ð5Þ
The average shortest path length is defined as the average shortest distance between any two nodes,
~ L
L:~ 2
N(Nz1) X
iƒj
lij, ð6Þ
and characterizes the overall connectedness of the network. lij
denotes the length of the shortest path between nodesiandj. The definition of the average shortest path length varies across the literature. Like some authors, we here include the distance from each node to itself in the average (lii~0Vi). Exclusion will,
however, just change the value by a constant factor of (Nz1)=(N{1).
If a network disintegrates into a number Nc of different
connected components, there will be pairs of nodes(i,j), for which no connecting path exists, in which case one usually setslij~?
and thusLL~~?. In order to avoid this situation, in some studieslij
in equation (6) is replaced byl{1
ij . The quantity defined this way is
called efficiency [42,43]. Another approach, which we will follow here and which is frequently used in field studies, is to exclude infinite values oflij from the average. The average shortest path
length then reads
L:~ 1 jSj
X
(i,j)[S
lij, ð7Þ
where
S:~f(i,j)jlijv?;i,j~1,. . .,Ng ð8Þ
denotes the set of all pairs(i,j)of nodes with finite shortest path. The number of such pairs is given by jSj. Note that L?0for Nc?N.
In field studies, values of C and L obtained for interaction networks are typically compared with average values obtained from an ensemble of random Erdo¨s-Re´nyi (ER) networks [24]. Between every pair of nodes is a link with probabilityE, and links for different pairs exist independently from each other. The expectation value of the clustering coefficient of ER networks is CER~E [2]. The
dependence of the average shortest path lengthLERof ER networks
onEandNis more complicated (see references [2,44]). Almost all ER networks are connected, ifE&lnN=(N{1). ER networks with a predefined number of links (and thus link density) can also be generated by successively adding links between randomly chosen pairs of nodes until the predefined number of links is reached. During this process, multiple links between nodes are avoided.
Results
Simulation studies
We consider time serieszi,i[f1,. . .,Ng, whose entrieszi(t)are
drawn independently from the uniform probability distributionUon the interval(0,1). We will later study the impact of different lengths T of these random time series on network properties. In order to enable us to study the effects of different spectral contents on network properties, we add the possibility to low-pass filterziby considering
xi,M,T(t):~M{1
X
tzM{1
l~t
zi(l), zi(l)*U, ð9Þ
where t[f1,. . .,Tg, and 1ƒM%T. By definition xi,1,T(t)~
zi(t)Vt. With the size M of the moving average we control the
spectral contents of time series. We here chose this ansatz for the sake of simplicity, for its mathematical treatability, and because the random time series with different spectral contents produced this way show all properties we want to illustrate.
In the following we will study the influence of the lengthT of time series on network properties by consideringxi,1,Tfor different
T. For a chosen value ofT we determineRrealizations ofxi,1,T
and we denote each realizationr withx(i,1,r)T. When studying the influence of the spectral content we will consider xi,M,T’ with differentMand withT’~500. We chose this value ofT’because we are interested in investigating time series of short length as typically considered in field studies. For a chosen value ofM we determineR realizations ofxi,M,T’ and we denote realizationr withx(ir,M),T’.
In order to keep the line of reasoning short and clear, we will present supporting and more rigorous mathematical results in Appendix S1 and refer to them in places where needed. In addition, since we observed most simulation studies based onrmto yield qualitatively the same results as those based onrc, we will present results based onrc only and report results of our studies based onrmwhenever we observed qualitative differences.
Clustering coefficient. Letr(ijr,1,)T :~rc(x(r)
i,1,T,x
(r)
j,1,T)denote
the absolute value of the empirical correlation coefficient estimated for time seriesx(ir,1,)T andx(jr,1,)T, and let us considerRrealizations, r[f1,. . .,Rg. Because of the independence of processes generating the time series and because of the symmetry of the correlation coefficient, we expect the Rvalues of the empirical correlation coefficient calculated for finite and fixed T to be distributed around the mean value 0. The variance of this distribution will be higher the lower we chooseT. If we sample one value r(ijr,1,)T out of the R values it is almost surely that r(ijr,1,)Tw0. Thus there are thresholds 0vhvr(ijr,1,) T for which we would establish a link between the corresponding nodesiand j when deriving a network. Let us now consider a network ofN nodes whose links are derived fromN time series as before. For somehw0the network will possess links andEw0. We expect to observeEfor some fixedhw0to be higher the larger the variance of the distribution of r(ijr,1,) T. Likewise, for fixed values of E we expect to findhto be higher the lower we choose a value ofT.
As a first check of this intuition we derive an approximationEal for the edge density by making use of the asymptotic limit (T??, see Appendix S1, Lemma 2 for details),
Eal(h,T)~2W({pffiffiffiffiTh), ð10Þ
where W denotes the cumulative distribution function of a standard normal distribution. In figure 1 (top left) we show the dependence ofEal(h,T)onhfor exemplary values of T. Indeed, Eal(h,T)is decreasing inhandT.
The concession of taking the asymptotic limit when deriving equation (10) may limit its validity in the case of small values ofT in which we are especially interested. Thus, we approach this case by simulation studies. Let us consider R~106 values ofr(r)
12,M,T
obtained for R realizations of two time series xi,M,T,
i[f1,2g,r[f1,. . .,Rg. We estimate the edge density^EE(h,M,T)by
^EE(h,M,T):~R{1X
r
H12,(r)M,T(h), ð11Þ
different values ofT shown in figure 1 (top left) indicates a good agreement between Eal(h,T) andE^E(h,1,T) for larger values of T but an increasing difference forTv30.
We proceed by estimating the clustering coefficientCC^ for our model usingRrealizations of three time seriesxi,M,T,i[f1,. . .,3g
by
^ C
C(h,M,T):~ P
rH
(r) 12,M,T(h)H
(r) 13,M,T(h)H
(r) 23,M,T(h)
P
rH
(r) 12,M,T(h)H
(r) 13,M,T(h)
: ð12Þ
The dependence ofCC^(h,1,T)onhfor variousT is shown in the top right part of figure 1. For fixedT,CC^(h,1,T)decreases from1 with increasing values of h which one might expect due to the decrease of E. However, we also observe forhw0that CC^(h,1,T) takes on higher values the lowerT.
In order to investigate whether the clustering coefficients of our networks differ from those of Erdo¨s-Re´nyi networks we use equation (11) and obtain CC^M,T(E)~CC^(h^h(E,M,T),M,T) with
^
h(E,M,T)~inffh: ^E(h,M,T)§Eg. This allows the comparison withCER(E)~E by considering the ratio^cc(E,M,T):~CC^M,T(E)=
CER(E). Remarkably,^cc(E,1,T)&1for a range of values ofEandT (cf. lower left part of figure 1).^cc(E,1,T)even increases for smallE andT. This indicates that there is a relevant dependence between the three random variables rij,M,T, ril,M,T, and rjl,M,T for different indices i,j,l and small T. For T?? and fixed edge density,Cconverges toCERbecause the dependence between the
random variables rij,M,T, i,j[f1,. . .,Ng, vanishes (i.e., the
random variables will converge in distribution to independent normal random variables).
In order to gain deeper insights into the influence of the spectral contents of random time series on the clustering coefficient, we repeat the steps of analysis with time seriesxi,M,T’, whereT’~500is kept fix, and we choose different values ofM. Figure 1 (top panels and lower left) shows that the higher the amount of low-frequency contributions (largeM) the higher^EE(h,M,T’)andCC^(h,M,T’)(for hw0), and the higher^cc(E,M,T’)(forE%1). The difference between Erdo¨s-Re´nyi networks and our time series networks becomes more pronounced (^cc(E,M,T’)&1) the smallerEand the higherM.
Given the similar dependence of^cc,CC, and^ ^EEonTandM, we hypothesize that the similarity can be traced back to similar variances ofrij,1,T andrij,M,T’ for some values of T andM. By making use of the asymptotic variance of the limit distributions of T??, we derive an expression relating Var(rij,1,T) and Var(rij,M,T)to each other (see Appendix S1, Lemma 1),
Var(rij,M,T)&g(M)Var(rij,1,T),with g(M)~2 3Mz
1
3M: ð13Þ
We are now able to define an effective lengthTeff of time series,
Teff(M):~
T’
g(M), ð14Þ
for whichVar (rij,1,T
eff)&Var (rij,M,T’). In the lower right part of
figure 1 we showTeff(M) in dependence onM. To investigate
Figure 1. Simulation results for the edge density, the clustering coefficient, and the effective length.Top row: Dependence of edge density^EE(h,M,T)(left) and of clustering coefficientCC^(h,M,T)(right) on the thresholdhfor different values of the sizeMof the moving average and
of the lengthTof time series. Values of edge densityEal(h,T)obtained with the asymptotic limit (equation (10)) are shown as lines (top left). Bottom left: Dependence of the ratio^cc(E,T,M)~CC^M,T(E)=CER(E)on edge densityE. Note, that we omitted values of estimated quantities obtained for
h[fh:(R{1P
rH
(r) 12,M,T(h)H
(r)
13,M,T(h))v10
{3gsince the accuracy of the statistics is no longer guaranteed. Bottom right: Dependence of effective lengthTeffas determined by equation (14) (black line) and its numerical estimateTTeff^ (red markers) onM.
whether equation (14) also holds for small values of T, we determine numerically, for different values of h, CC^(h,1,T) for T[f3,. . .,T’gas well asCC^(h,M,T’)for some chosen values ofM. Eventually, we determine for each value ofM a value ofT, for which CC^(h,1,T)and CC^(h,M,T’) curves match in a least-squares sense, and denote this value withTT^eff (see the lower right part of
figure 1). We observe a maximum deviation Teff{TT^eff
&2and conclude that equation (14) indeed holds for small lengthTof time series. Moreover, numerically determined dependencies of^EEonh,
^ C
C on h, as well as ^cc on E for pairs of values (M,T’) show a remarkable similarity to those dependencies obtained for pairs of values(1,TT^eff).
Thus, the clustering coefficient of networks derived from random time series of finite length and/or with a large amount of low-frequency contributions is higher than the one of Erdo¨s-Re´nyi (ER) networks – independently of the network sizeN (cf. equation (12)). This difference becomes more pronounced the lower the edge densityE, the lower the lengthTof time series, and the larger the amount of low-frequency contributions. These results point us to an important difference between ER networks and our model networks: possible edges in ER networks are not only (1) equally likely but also (2) independently chosen to become edges. While property (1) is fulfilled in our model networks, property (2) is not.
Average shortest path length. Next we study the impact of the length of time series and of the amount of low-frequency contributions on the average shortest path lengthLof our model networks by employing a similar but different simulation approach as used in the previous section. To estimateL, we considerR~100 networks with a fixed number of nodes (N~100). We derive our model networks by thresholding r(ijr,)M,T, i,j[f1,. . .,Ng, r[f1,. . .,Rg. Let L(r)(E,1,T) denote the average shortest path length for network r with M~1 and different values ofT, and L(r)(E,M,T’) the average shortest path length for networkrwith
fixed value ofT (T~T’~500) and different values of M. With L(ERr)(E)we refer to the average shortest path length obtained for the r-th ER network of sizeN and edge densityE. Mean values over realizations will be denoted asLL^(E,1,T), LL^(E,M,T’), andLL^ER(E)
respectively. Finally, we define^ll(E,1,T):~LL^(E,1,T)=LL^ER(E)and ^
l
l(E,M,T’):~LL^(E,M,T’)=LL^ER(E).
In figure 2 we show the dependence ofLL^and^llonEfor various values ofM and T. All quantities decrease asEincreases which can be expected due to additional edges reducing the average distances between pairs of nodes of the networks. For fixedE%1,LL^ takes on higher values the higherMor the lowerT. With equation (14) we haveLL^(E,1,Teff)&LL^(E,M,T’)which resembles the results obtained for the clustering coefficient. Differences between the average shortest path lengths of our model networks and ER networks (as characterized by ^ll) become more pronounced the higherMand the lowerT. For edge densities typically reported in field studies (E&0:1), however, differences are less pronounced (^ll*v1:2, cf. figure 2 right) than the ones observed for the clustering coefficient (^ccw2 for selected values of M and T, cf. figure 1 bottom left). We obtained qualitatively similar results for small (N~50) and large numbers of nodes (N~500).
Number of connected components and degree distribution. Since the number of connected components of a given network might affect network characteristics such as the average shortest path length (see equation (7)), we investigate the impact of different length of time series and of the amount of low-frequency contributions on the average number of connected componentsNN^c(E,M,T)of the networks derived fromxi,1,Teff and xi,M,T’. We determineNN^c(E,M,T)as the mean ofRrealizations of
the corresponding networks and with NN^c,ER(E) we denote the
mean value of the number of connected components in R realization of ER networks. For the edge densities considered here we observe ER networks to be connected (cf. figure 3),Nc,ER&1,
which is in agreement with the connectivity condition for ER networks, E&lnN=(N{1)&0:05 (for N~100). Similarly, we observeNN^c(E,1,Teff)&1, even for small values ofT (cf. figure 3
right). In contrast,NN^c(E,M,T’)takes on higher values the lowerE
and the higherM (cf. figure 3 left). In order to achieve a better understanding of these findings, we determine degree probability distributions of our model networks. Let^ppk denote the estimated
probability of a node to possess a degree k, i.e., ^
p
pk~#fi(r):ki(r)~k,r[f1,. . .,Rgg=(NR). With pp^k(E,M,T) we
will denote the estimated degree distribution for networks derived fromxi,M,T. We briefly recall that the degree distribution of ER
networkspk,N,ERfollows a binomial distribution,
pk,N,ER(E)~
N{1 k
Ek(1{E)N{k{1,
ð15Þ
which we show in figure 4 forN~100and variousE(top panels and lower left panel). In the same figure we present our findings for ^
p
pk(E,M,T) for various values of T~Teff and M. We observe
^ p
pk(E,1,Teff)to be equal topp^k,N,ER(E)within the error to be expected
due to the limited sample size used for the estimation. For ^
p
pk(E,M,T’), however, we observe striking differences in comparison
to the previous degree distributions. In particular, for decreasingE and higherM, the probability of nodes with degreek~0increases, which leads to networks with disconnected single nodes, thereby increasing the number of connected components of the network.
We hypothesize that the observed differences in the number of connected components as well as in the degree distributions are related to differences in the spectral content of different realizations of time seriesx(i,rM) ,T’forMw1. In particular, a node i with a low degree ki might be associated with a time series
x(ir,M),T’, which possesses, by chance, a small relative amount of low frequency contributions (or, equivalently, a large relative amount of high frequency contributions).
In order to test this hypothesis, we generateRrealizations of N~100 time series x(ir,M),T’ and estimate their periodograms ^
P
P(i,rM) (f) for frequencies f[f0,. . .,fNyqgusing a discrete Fourier transform [45].fNyq denotes the Nyquist frequency, and
period-ograms are normalized such thatP
fPP^
(r)
i,M(f)~1. From the same
time series, we then derive the networks using E~0:1 and determine the degrees k(ir). For some fixedf’w0we define the total power above f’ (upper frequency range) as PP^H,(i,Mr)~
PfNyq
f0 PP^
(r)
i,M(f), and the total power below f’ (lower frequency
range) as PP^L,(i,Mr)~Pff~’{01PP^(i,rM) (f). For each realization r we estimate the correlation coefficients between the degrees and the corresponding total power contents in upper and lower frequency range, k(Lr)~corr(k(r),PP^L,(r)
M ) and k
(r)
H~corr(k(r),PP^ H,(r)
M ),
respec-tively, and determine their mean values,kL(M)~R{1Prk
(r)
L and
kH(M)~R{1Prk
(r)
H. Note thatkL(M)~{kH(M)by
construc-tion. We choosef’~f’(M)such that 40% of the total power of the filter function associated with the moving average is contained within the frequency rangef [½0,f’.
For increasingMwe observe in the lower right panel of figure 4
the degrees to be increasingly correlated with PP^L,(Mr), which
corresponds to an anti-correlation of degrees withPP^H,(Mr). Thus, as
does not sensitively affect the observed qualitative relationships as long as0vf’%fNyqis fulfilled.
We briefly summarize the results obtained so far, which indicate a striking difference between networks derived from independent random time series usingrc orrm(cf. equations (1) and (2)) and corresponding ER networks. First, we observed the clustering coefficient C and the average shortest path length L of our networks to be higher the lower the lengthTof the time series (cf. figures 1 and 2). Second, for some fixedTwe observedCandLto be higher the larger the amount of low frequency components (as parametrized by M) in the time series. In addition, these contributions led to an increasing number of connected compo-nents in our networks and to degree distributions that differed strongly from those of the corresponding ER networks (cf. figures 3 and 4). We mention thatLas defined here (cf. equation (7)) tends to decrease for networks with an increasing number Nc of
connected components, and L?0 for Nc?N. L thus depends non-trivially on the amount of low frequency components in the time series. Third, for small edge densitiesE and for short time series lengths or for a large amount of low frequency components, the clustering coefficient deviates more strongly from the one of corresponding ER networks (^ccw2) than the average shortest path
length (^ll*v1:2; cf. figure 2 right and figure 1 (bottom left)). Networks derived from independent random time series can thus be classified as small world networks if one usesc&1andl&1as practical criterion, which is often employed in various field studies (cf. [31] and references therein).
Field data analysis
The findings obtained in the previous section indicate that strong low frequency contributions affect network properties C andLin a non-trivial way. We now investigate this influence in electroencephalographic (EEG) recordings of epileptic seizures that are known for their complex spatial and temporal changes in frequency content [46–49]. We analyze the multichannel (N~53+21 channels) EEGs from 60 patients capturing 100 epileptic seizures reported in reference [50]. All patients had signed informed consent that their clinical data might be used and published for research purposes. The study protocol had previously been approved by the ethics committee of the University of Bonn. During the presurgical evaluation of drug-resistant epilepsy, EEG data were recorded with chronically implanted strip, grid, or depth electrodes from the cortex and from within relevant structures of the brain. The data were sampled at Figure 2. Simulation results for the average shortest path length.Dependence of the average shortest path lengthLL^(E,M,T)(left) and of the
ratio^ll(E,M,T)~LL^(E,1,T)=LER(E)(right) on edge densityEfor different values of the sizeMof the moving average and of the lengthTof time series. Lines are for eye-guidance only.
doi:10.1371/journal.pone.0022826.g002
Figure 3. Simulation results for the number of connected components.Dependence of the number of connected componentsNN^c(E,M,T)
on the edge densityEfor different values of the sizeMof the moving average (left, forT~500) and of the lengthTof time series (right, forM~1). Lines are for eye-guidance only.
200 Hz within the frequency band 0:5{70 Hz using a 16-bit analog-to-digital converter. Electroencephalographic seizure on-sets and seizure ends were automatically detected [51], and EEGs were split into consecutive non-overlapping windows of 2.5 s duration (T~500 sampling points). Time series of each window were normalized to zero mean and unit variance. We determined rc and rm for all combinations of EEG time series from each window and derived networks with a fixed edge densityE~0:1in order to exclude possible edge density effects. WithLcandCcas
well asLmandCmwe denote characteristics of networks based on
rcandrm, respectively. In order to simplify matters, we omit the window indexing in the following.
We investigate a possible influence of the power content of EEG time series on the clustering coefficient and the average shortest path length by comparing their values to those obtained from ensembles of random networks that are based on properties of the EEG time series at two different levels of detail. For the first ensemble and for each patient we derive networks from random time series with a power content that approximately equals the mean power content of all EEG time series within a window. Let ^
P
Pi(f)denote the estimated periodogram of each EEG time seriesi,
and with P(f)~N{1P
iPP^i(f) we denote the mean power for
each frequency componentf over allNtime series. We normalize P(f)such thatP
fP(f)~1. We generateNrandom time series of
length T~500 whose entries are independently drawn from a uniform probability distribution, and we filter these time series in the Fourier domain usingpffiffiffiffiffiffiffiffiffiP(f)
as filter function. We normalize
the filtered time series to zero mean and unit variance and derive a network based onrcorrm(E~0:1). We use 20 realizations of such networks per window in order to determine the mean values of network characteristicsC(1)
c andL(1)c as well asC(1)m andL(1)m based
onrcorrm, respectively. Since the power spectra of all time series equal each other, these random networks resemble the ones investigated in the previous section.
With the second ensemble, we take into account that the power content of EEG time series recorded from different brain regions may differ substantially. For this purpose we make use of a well established method for generating univariate time series surrogates [52,53], which have power spectral contents and amplitude distributions that are practically indistinguishable from those of EEG time series but are otherwise random. Amplitudes are iteratively permuted while the power spectrum of each EEG time series is approximately preserved. Since this randomization scheme destroys any significant linear or non-linear dependencies between time series, it has been successfully applied to test the null hypothesis of independent linear stochastic processes. For each patient, we generated 20 surrogate time series for each EEG time series from each recording site and each window, and derived networks based on either rc or rm (E~0:1). Mean values of characteristics of these random networks are denoted asC(2)
c and
L(2)
c as well asCm(2)andL(2)m, respectively.
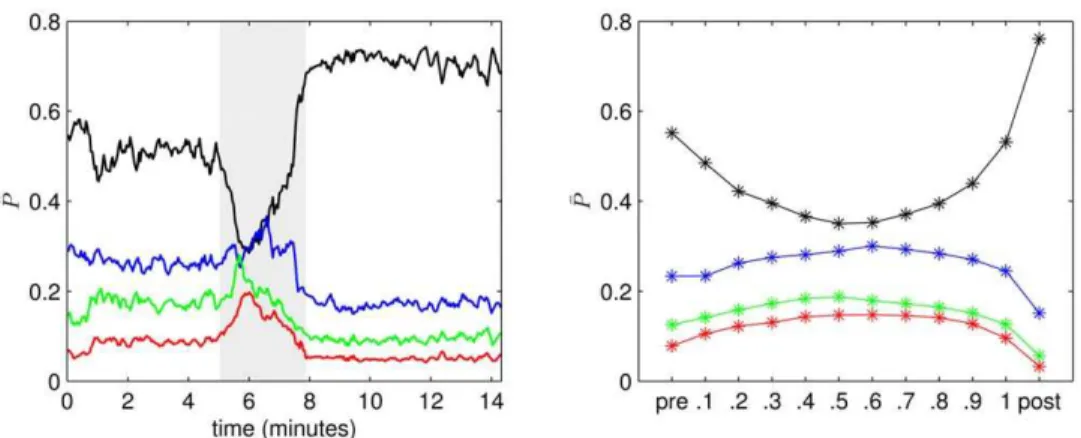
We begin with an exemplary recording of a seizure of which we show in figure 5 (left) the temporal evolution of the relative amount of power in thed- (0–4 Hz,Pd),q- (4–8 Hz,Pq),a- (8–12 Hz,Pa), Figure 4. Simulation results for the degree distribution.(a–c) Degree distributions^ppk(E,M,T)estimated forR~1000realizations of networks
derived from time seriesxi,M,T(N~100) via thresholding using various edge densitiesE~kk(N{1){1
and for selected values of the sizeMof the moving average and of the lengthTof time series. The symbol legend in (a) also holds for (b) and (c). (d) Dependence of correlation (kL(M))
between node degrees and power content in the lower frequency range on the sizeMof the moving average. Mean values of correlations obtained forR~100realizations of networks for each value ofM are shown as crosses and standard deviations as error bars. Stars indicate significant differences in comparison tokL(1)(Bonferroni corrected pair-wise Wilcoxon rank sum tests for equal medians,pv0:01). Lines are for eye-guidance
only.
andb- (12–20 Hz,Pb) frequency bands. Prior to the seizure thed -band contains more than 50% of the total power which is then shifted towards higher frequencies and back towards low frequencies at seizure end. Pd is even higher after the seizure than prior to the seizure.
In figure 6 we show the temporal evolution of network properties obtained for this recording based on rc (top panels) and rm (bottom panels). During the seizure both the clustering coefficients Cc andCmand the average shortest path lengthsLc
andLmshow pronounced differences to the respective properties
obtained from the random networks. These differences are less pronounced prior to and after the seizure, where C(2)
m and L(2)m
even approach the values of Cm and Lm, respectively.C(1)c and
C(1)
m decrease during the seizure and already increase prior to
seizure end, resembling the changes ofPd(cf. figure 5 (left)). This is in accordance with results of our simulation studies: there we observed the clustering coefficient to be higher the larger the amount of low frequency components in the time series; this could also be observed, but to a much lesser extent, for the average shortest path length. Indeed, L(1)
m and L(1)c vary little over time,
andL(1)
c is only slightly increased after the seizure, reflecting the
high amount of power in thed-band.
We only observe small deviations betweenC(1)
c andC(2)c as well as
betweenL(1)
c and L(2)c , which appear to be systematic (for many
windows C(1)
c *vCc(2) and L(1)c w*L(2)c ). These suggest that for interaction networks derived from rc, both random network ensembles appear appropriate to characterize the influence of power in low frequency bands on clustering coefficient and the average shortest path length. In contrast, we observed differences betweenC(1)
m and Cm(2), as well as betweenL(1)m and L(2)m. These
differences were most pronounced during the seizure and forL(1) m
and L(2)
m also after the seizure. This finding indicates that the
clustering coefficient and average shortest path length of interaction networks derived fromrmdepend sensitively on the power contents of EEG time series recorded from different brain regions. Thus, for these interaction networks only the random networks that account for the complex changes in frequency content of different brain regions prior to, during, and after seizures appear appropriate to characterize the influence of power in low frequency bands on clustering coefficient and the average shortest path length.
We continue by studying properties of networks derived from the EEG recordings of all 100 focal onset seizures. Due to the different durations of seizures (mean seizure duration:110+60s)
we partitioned each seizure into 10 equidistant time bins (see reference [50] for details) and assigned the time-dependent network properties to the respective time bins. For each seizure we included the same number of pre-seizure and post-seizure windows in our analysis and assigned the corresponding time-dependent network properties to one pre-seizure and one post-seizure time bin. Within each time bin we determined the mean value (e.g.,CCc) and its standard error for each property. In figure 5
(right), we show for each time bin the mean values of the relative amount of power in different frequency bands of all seizure recordings (PPd,PPq,PPa,PPb). Similar to the exemplary recording (cf. figure 5 (left)), we observe a shift in the relative amount of power in low frequencies prior to seizures towards higher frequencies during seizures and back to low frequencies at seizure end. The amount of power in thed-band is on average higher in the post-seizure bin than in the pre-seizure bin.
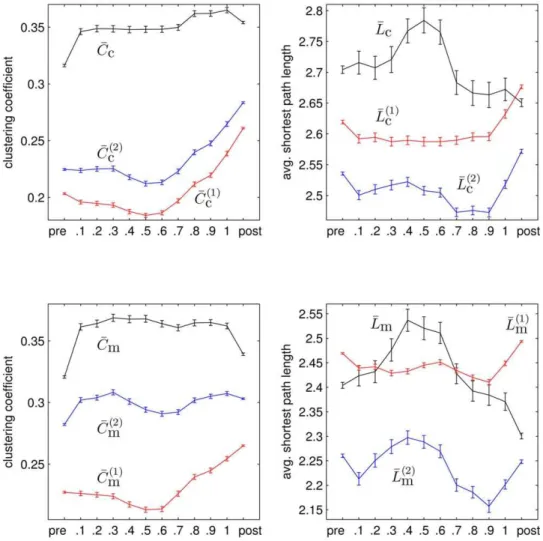
In figure 7 we show the mean values of properties of networks in each time bin for all seizures. We observeCC(1)
c , CCc(2), LL(1)c , LL(2)c ,
C C(1)
m, andLL(1)m to decrease during seizures and to increase prior to
seizure end thereby roughly reflecting the amount of power contained in low frequencies (cf. figure 5 (right),PPd).CCc(1)andCCc(2)
and to a lesser extent alsoLL(1)
c and LL(2)c roughly follow the same
course in time, however, with a slight shift in the range of values as already observed in the exemplary recording of a seizure (cf. figure 6). Differences between both random network ensembles are most pronounced in network properties based onrm, i.e., between
C C(1)
m andCC(2)m as well as betweenLL(1)m andLL(2)m. This corroborates
the observation that the clustering coefficient and the average shortest path length of the random networks based onrmdepend more sensitively on the power contents of EEG time series recorded from different brain regions than the respective quantities derived from rc. While LLc and LLm show a similar
course in time, reaching a maximum in the middle of the seizures, we observe a remarkable difference betweenCCcandCCmprior to
end of the seizures, where the amount of power in low frequencies is large. WhileCCmdecreases at the end of the seizures,CCcdoes not
and remains elevated after seizures. Interestingly, considering the corresponding quantities obtained from the second random network ensemble, CC(2)
m fluctuates around 0:3+0:01 and does
not increase at the end of seizures, while, in contrast,CC(2)
c increases
at the end of the seizures, traversing an interval of values roughly three times larger than the interval containing values of CC(2)
m.
Taken together these findings suggest that the pronounced Figure 5. Evolving relative amount of power during epileptic seizures.(Left) Relative amount of powerPP^contained in thed- (PPd^ , black),q
-(PPq^ , blue),a- (PaP^ , green), andb- (PPb^ , red) frequency bands during an exemplary seizure. Profiles are smoothed using a four-point moving average. Grey-shaded area marks the seizure. (Right) Mean values (PPd, PPq,PPa, PPb) of the relative amount of power averaged separately for pre-seizure, discretized seizure, and post-seizure time periods of 100 epileptic seizures. Lines are for eye-guidance only.
changes of the frequency content of EEG time series seen during epileptic seizures influence the values of the clustering coefficient and the average shortest path length.
A comparison of some value of a network property with the one obtained for a random network with the same edge density and number of nodes is typically achieved by calculating their ratio. If ER networks are used for comparison, the value of a network property is rescaled by a constant factor. In this case, the time-dependent changes of network properties shown in figure 7 will be shifted along the ordinate only. In order to take into account the varying power content of EEG time series recorded from different brain regions we instead normalize the clustering coefficients and the average shortest path lengths with the corresponding quantities from the second random network ensembleCC(2)
c ,CCm(2),LL(2)c , and
L L(2)
m (cf. figure 8). We observe the normalized network properties
to describe a concave-like movement over time indicating a reconfiguration of networks from more random (before seizures) towards a more regular (during seizures) and back towards more random network topologies. This is in agreement with previous observations using a different and seldom used thresholding method [50].
Discussion
The network approach towards the analysis of empirical multivariate time series is based on the assumption that the data is well represented by a model of mutual relationships (i.e., a network). We studied interaction networks derived from finite time series generated by independent processes that would not advocate a representation by a model of mutual relationships. We observed the derived interaction networks to show non-trivial network
topologies. These are induced by the finiteness of data, which limits reliability of estimators of signal interdependence, together with the use of a frequently employed thresholding technique. Since the analysis methodology alone can already introduce non-trivial structure in the derived networks, the question arises as to how informative network analysis results obtained from finite empirical data are with respect to the studied dynamics. This question may be addressed by defining and making use of appropriate null models. In the following, we briefly discuss two null models that are frequently employed in field studies.
Erdo¨s-Re´nyi (ER) networks represent one of the earliest and best studied network models in mathematical literature and can be easily generated. They can be used to test whether the network under consideration complies with the notion of a random network in which possible edges are equally likely and indepen-dently chosen to become edges. We observed that clustering coefficientC and average shortest path length Lfor interaction networks derived from finite random time series differed pronouncedly from those obtained from corresponding ER networks, which would likely lead to a classification of interaction networks as small-world networks. Since the influence of the analysis methodology is not taken into account with ER networks, they may not be well suited for serving as null models in studies of interaction networks derived from finite time series.
Another null model is based on randomizing the network topology while preserving the degrees of nodes [26,54,55]. It is used to evaluate whether the network under consideration is random under the constraint of a given degree sequence. Results of our simulation studies point out that the structures induced in the network topology by the way how networks are derived from empirical time series cannot be related to the degree sequence Figure 6. Evolving network properties during an exemplary epileptic seizure.Network propertiesCcandLc(top row, black lines) as well as CmandLm(bottom row, black lines) during an exemplary seizure (cf. figure 5 (left)). Mean values and standard deviations of network properties obtained from surrogate time series (C(2)
c ,L(2)c ,C(2)m,L(2)m) are shown as blue lines and blue shaded areas, respectively, and mean values and standard deviations of network properties obtained from the overall power content model (C(1)
c ,L(1)c ,C(1)m,L(1)m) are shown as red lines and red shaded areas, respectively. Profiles are smoothed using a four-point moving average. Grey-shaded area marks the seizure. For corresponding Erdo¨s-Re´nyi networks
CER&0:1andLER&2:4for all time windows.
only. We observed that C and L from interaction networks remarkably depended on the finiteness of the data, while the degree distribution did not (cf. figure 4 (a–c), M~1). The usefulness of degree-preserving randomized networks has also
been subject of debate since they do not take into account different characteristics of the data and its acquisition [56,57]. Moreover, the link-switching algorithm frequently employed for generating such networks has been shown to non-uniformly sample the space Figure 7. Evolving network properties averaged over 100 epileptic seizures.Mean values (black) of network propertiesCc(top left),Lc(top right),Cm(bottom left), andLm(bottom right) averaged separately for pre-seizure, discretized seizure, and post-seizure time periods of 100 epileptic seizures. Mean values of corresponding network properties obtained from the first and the second ensemble of random networks are shown as red and blue lines, respectively. All error bars indicate standard error of the mean. Lines are for eye-guidance only.
doi:10.1371/journal.pone.0022826.g007
Figure 8. Evolving normalized network properties averaged over 100 epileptic seizures.Mean values ofCc=Cc(2)andCm=Cm(2)(left) as well
asLc=L(2)c andLm=L(2)m (right) averaged separately for pre-seizure, discretized seizure, and post-seizure time periods of 100 epileptic seizures. All error
of networks with predefined degree sequence (see, e.g., references [25,58]). This deficiency can be addressed by using alternative randomization schemes (see, e.g., [58–60] and references therein). We propose to take into account the finite length and the frequency contents of time series when defining null models. For this purpose we applied the same methodological steps as in field data analysis (estimation of signal interdependence and threshold-ing of interdependence values to define links) but used surrogate time series [53] to derive random networks (second ensemble). These surrogate time series comply with the null hypothesis of independent linear stochastic processes and preserve length, frequency content, and amplitude distribution of the original time series. For these random networks, we observed (in our simulation studies) dependencies between properties of networks and properties of time series: the clustering coefficient C, and, to a lesser extent, the average shortest path length Lare higher the higher the relative amount of low frequency components, the shorter the length of time series, and the smaller the edge density of the network. Results obtained from an analysis of interaction networks derived from multichannel EEG recordings of one hundred epileptic seizures confirm that the pronounced changes of the frequency content seen during seizures influence the values of C and L. Comparing these network characteristics with those obtained from our random networks allowed us to distinguish aspects of global network dynamics during seizures from those spuriously induced by the applied methods of analysis.
Our random networks will likely be classified as small-world networks when compared to ER networks which might indicate that small-world topologies in networks derived from empirical data as reported in an ever increasing number of studies can partly or solely be related to the finite length and frequency content of time series. If so, small-world topologies would be an overly complicated description of the simple finding of finite time series with a large amount of low frequency components. In this context, our approach could be of particular interest for studies that deal with short time series and low frequency contents, as, for example, is the case in resting state functional magnetic resonance imaging studies (see, e.g., references [61–65]). In such studies, taking into account potential frequency effects could help to unravel information on the network level that would be otherwise masked. We observed the degrees of nodes of our random networks to be correlated with the relative amount of power in low-frequencies in the respective time series (cf. figure 4). The degree of a node has been used in field studies as an indicator of its centrality in the network (see, e.g., [2,66] and references therein). Particular interest has been devoted to nodes which are highly central (hubs). In this context it would be interesting to study whether findings of hubs in interaction networks can partly or solely be explained by the various frequency contents of time series entering the analysis. In such a case, hubs would be a complicated representation of features already present on a single time series level. We are confident that our random networks can help to clarify this issue.
Our simulation studies were based on the simplified assumption that power spectra of all time series from which a network is derived are approximately equal. The dependencies ofCandLon the power content could also be observed qualitatively for networks derived from EEG time series – that were recorded from different brain regions and whose power spectra may differ substantially among each other – but only if link definition was based on thresholding the values of the correlation coefficient (rc).
Thus, estimating mean power spectra of multivariate time series can provide the experimentalist with a rule of thumb for the potential relative increase ofCandLin different networks based
on the correlation coefficient. This rule of thumb, however, might not be helpful if the maximum value of the absolute cross correlation (rm) is used to estimate signal interdependencies. In
this case,C andL depended sensitively on the heterogeneity of power spectra (see the second random network ensemble). It would be interesting to investigate in future studies, which particular properties of rc and rm can be accounted for these
differences.
We close the discussion with two remarks, the first being of interest for experimentalists. Our findings also shed light on a network construction technique that relies on significance testing in order to decide upon defining a link or not [21]. For this purpose, a null distribution of a chosen estimator of signal interdependence (rm) is generated for each pair of time series and
a link is established if the null hypothesis of independent processes generating the time series can be rejected at a predefined significance level. It was suggested in Ref. [21] to use a limited subset of time series in order to minimize computational burden when generating null distributions. Our findings indicate that networks constructed this way will yield an artificially increased number of false positive or of false negative links which will depend on the frequency contents of time series being part or not part of the subset. Our second remark is related to network modeling. By choosing some threshold and generating time series that satisfy the relation between the size of the moving average and the length of time series, networks can be generated which differ in their degree distributions but approximately equal in their clustering coefficient and average shortest path length. This property could be of value for future modeling studies.
2. Boccaletti S, Latora V, Moreno Y, Chavez M, Hwang DU (2006) Complex networks: Structure and dynamics. Phys Rep 424: 175–308.
3. Arenas A, Dı´az-Guilera A, Kurths J, Moreno Y, Zhou C (2008) Synchronization in complex networks. Phys Rep 469: 93–153.
4. Barrat A, Barthe´lemy M, Vespignani A (2008) Dynamical Processes on Complex Networks. New York, USA: Cambridge University Press.
5. Tsonis AA, Roebber PJ (2004) The architecture of the climate network. Physica A 333: 497–504.
6. Yamasaki K, Gozolchiani A, Havlin S (2008) Climate networks around the globe are significantly affected by El Nin˜o. Phys Rev Lett 100: 228501.
7. Donges JF, Zou Y, Marwan N, Kurths J (2009) Complex networks in climate dynamics. Eur Phys J–Spec Top 174: 157–179.
8. Tsonis AA, Wang G, Swanson KL, Rodrigues FA, da Fontura Costa L (2010) Community structure and dynamics in climate networks. Clim Dynam, in press. 9. Steinhaeuser K, Chawla NV, Ganguly AR (2011) Complex networks as a unified framework for descriptive analysis and predictive modeling in climate science. Statistical Analysis and Data Mining 4: in press.
10. Abe S, Suzuki N (2004) Small-world structure of earthquake network. Physica A 337: 357–362. 23.
11. Abe S, Suzuki N (2006) Complex-network description of seismicity. Nonlinear Proc Geoph 13: 145–150.
12. Jime´nez A, Tiampo KF, Posadas AM (2008) Small world in a seismic network: the California case. Nonlinear Proc Geoph 15: 389–395.
13. Krishna Mohan TR, Revathi PG (2011) Network of earthquakes and recurrences therein. J Seismol 15: 71–80.
14. Mantegna RN (1999) Hierarchical structure in financial markets. Eur Phys J B 11: 193–197.
15. Onnela JP, Kaski K, Kertesz J (2004) Clustering and information in correlation based financial networks. Eur Phys J B 38: 353–362.
16. Boginski V, Butenko S, Pardalos PM (2005) Statistical analysis of financial networks. Comput Stat An 48: 431–443.
17. Qiu T, Zheng B, Chen G (2010) Financial networks with static and dynamic thresholds. New J Phys 12: 043057.
18. Emmert-Streib F, Dehmer M (2010) Influence of the time scale on the construction of financial networks. PLoS ONE 5: e12884.
19. Reijneveld JC, Ponten SC, Berendse HW, Stam CJ (2007) The application of graph theoretical analysis to complex networks in the brain. Clin Neurophysiol 118: 2317–2331.
20. Bullmore E, Sporns O (2009) Complex brain networks: graph theoretical analysis of structural and functional systems. Nat Rev Neurosci 10: 186–198. 21. Kramer MA, Eden UT, Cash SS, Kolaczyk ED (2009) Network inference with
confidence from multivariate time series. Phys Rev E 79: 061916.
22. Donges JF, Zou Y, Marwan N, Kurths J (2009) The backbone of the climate network. Europhys Lett 87: 48007.
23. Emmert-Streib F, Dehmer M (2010) Identifying critical financial networks of the DJIA: Toward a network-based index. Complexity 16: 24–33.
24. Erdo˝s P, Re´nyi A (1959) On random graphs I. Publ Math Debrecen 6: 290–297. 25. Rao AR, Jana R, Bandyopadhyay S (1996) A Markov chain Monte Carlo method for generating random (0,1)-matrices with given marginals. Sankhya Ser A 58: 225–242.
26. Maslov S, Sneppen K (2002) Specificity and stability in topology of protein networks. Science 296: 910–913.
27. James R, Croft DP, Krause J (2009) Potential banana skins in animal social network analysis. Behav Ecol Sociobiol 63: 989–997.
28. Lima-Mendez G, van Helden J (2009) The powerful law of the power law and other myths in network biology. Mol Biosyst 5: 1482–1493.
29. Ioannides AA (2007) Dynamic functional connectivity. Curr Opin Neurobiol 17: 161–170.
30. Butts CT (2009) Revisiting the foundations of network analysis. Science 325: 414–416.
31. Bialonski S, Horstmann MT, Lehnertz K (2010) From brain to earth and climate systems: Small-world interaction networks or not? Chaos 20: 013134. 32. Antiqueira L, Rodrigues FA, van Wijk BCM, da F Costa L, Daffertshofer A
(2010) Estimating complex cortical networks via surface recordings–a critical note. Neuroimage 53: 439–449.
34. Brillinger D (1981) Time Series: Data Analysis and Theory. San Francisco, USA: Holden-Day.
35. Pikovsky AS, Rosenblum MG, Kurths J (2001) Synchronization: A universal concept in nonlinear sciences. Cambridge, UK: Cambridge University Press. 36. Boccaletti S, Kurths J, Osipov G, Valladares DL, Zhou CS (2002) The
synchronization of chaotic systems. Phys Rep 366: 1–101.
37. Kantz H, Schreiber T (2003) Nonlinear Time Series Analysis. Cambridge, UK: Cambridge Univ. Press, 2nd
edition.
38. Pereda E, Quian Quiroga R, Bhattacharya J (2005) Nonlinear multivariate analysis of neurophysiological signals. Prog Neurobiol 77: 1–37.
39. Hlava´cˇkova´-Schindler K, Palusˇ M, Vejmelka M, Bhattacharya J (2007) Causality detection based on information-theoretic approaches in time series analysis. Phys Rep 441: 1–46.
40. Lehnertz K, Bialonski S, Horstmann MT, Krug D, Rothkegel A, et al. (2009) Synchronization phenomena in human epileptic brain networks. J Neurosci Methods 183: 42–48.
41. Watts DJ, Strogatz SH (1998) Collective dynamics of ‘small-world’ networks. Nature 393: 440–442.
42. Latora V, Marchiori M (2001) Efficient behavior of small-world networks. Phys Rev Lett 87: 198701.
43. Latora V, Marchiori M (2003) Economic small-world behavior in weighted networks. Eur Phys J B 32: 249–263.
44. Chung F, Lu L (2001) The diameter of sparse random graphs. Adv Appl Math 26: 257–279.
45. Press WH, Teukolsky SA, Vetterling WT, Flannery BP (2002) Numerical Recipes in C. Cambridge, UK: Cambridge University Press, 2nd
edition. 46. Franaszczuk PJ, Bergey GK, Durka PJ, Eisenberg HM (1998) Time-frequency
analysis using the matching pursuit algorithm applied to seizures originating from the mesial temporal lobe. Electroencephalogr Clin Neurophysiol 106: 513–521.
47. Schiff SJ, Colella D, Jacyna GM, Hughes E, Creekmore JW, et al. (2000) Brain chirps: spectrographic signatures of epileptic seizures. Clin Neurophysiol 111: 953–958.
48. Jouny CC, Franaszczuk PJ, Bergey GK (2003) Characterization of epileptic seizure dynamics using Gabor atom density. Clin Neurophysiol 114: 426–437. 49. Bartolomei F, Cosandier-Rimele D, McGonigal A, Aubert S, Regis J, et al.
(2010) From mesial temporal lobe to temporoperisylvian seizures: A quantified study of temporal lobe seizure networks. Epilepsia 51: 2147–2158.
50. Schindler K, Bialonski S, Horstmann MT, Elger CE, Lehnertz K (2008) Evolving functional network properties and synchronizability during human epileptic seizures. Chaos 18: 033119.
51. Schindler K, Leung H, Elger CE, Lehnertz K (2007) Assessing seizure dynamics by analysing the correlation structure of multichannel intracranial EEG. Brain 130: 65–77.
52. Schreiber T, Schmitz A (1996) Improved surrogate data for nonlinearity tests. Phys Rev Lett 77: 635–638.
53. Schreiber T, Schmitz A (2000) Surrogate time series. Physica D 142: 346–382. 54. Roberts JM (2000) Simple methods for simulating sociomatrices with given
marginal totals. Soc Networks 22: 273–283.
55. Maslov S, Sneppen K, Zaliznyak A (2004) Detection of topological patterns in complex networks: correlation profile of the internet. Physica A 333: 529–540. 56. Artzy-Randrup Y, Fleishman SJ, Ben-Tal N, Stone L (2004) Comment on ‘‘Network Motifs: Simple building blocks of complex networks’’ and ‘‘super-families of evolved and designed networks’’. Science 305: 1107.
57. Milo R, Itzkovitz S, Kashtan N, Levitt R, Alon U (2004) Response to comment on ‘‘Network Motifs: Simple building blocks of complex networks’’ and ‘‘superfamilies of evolved and designed networks’’. Science 305: 1107. 58. Artzy-Randrup Y, Stone L (2005) Generating uniformly distributed random
networks. Phys Rev E 72: 056708.
59. Del Genio CI, Kim H, Toroczkai Z, Bassler KE (2010) Efficient and exact sampling of simple graphs with given arbitrary degree sequence. PLoS ONE 5: e10012. 27.
61. Eguiluz VM, Chialvo DR, Cecchi GA, Baliki M, Apkarian AV (2005) Scale-free brain functional networks. Phys Rev Lett 94: 018102.
62. van den Heuvel MP, Stam CJ, Boersma M, Hulshoff Pol HE (2008) Small-world and scale-free organization of voxel-based resting-state functional connectivity in the human brain. Neuroimage 43: 528–539.
63. Hayasaka S, Laurienti PJ (2010) Comparison of characteristics between region-and voxel-based network analyses in resting-state fMRI data. Neuroimage 50: 499–508. 64. Fransson P, A˚ den U, Blennow M, Lagercrantz H (2011) The functional architecture of the infant brain as revealed by resting-state fMRI. Cereb Cortex 21: 145–154.
65. Tian L, Wang J, Yan C, He Y (2011) Hemisphere- and gender-related differences in small-world brain networks: A resting-state functional MRI study. Neuroimage 54: 191–202.
66. Guye M, Bettus G, Bartolomei F, Cozzone PJ (2010) Graph theoretical analysis of structural and functional connectivity MRI in normal and pathological brain networks. Magn Reson Mater Phy 23: 409–421.
67. Small M, Yu D, Harrison RG (2001) Surrogate test for pseudoperiodic time series data. Phys Rev Lett 87: 188101.
68. Breakspear M, Brammer M, Robinson PA (2003) Construction of multivariate surrogate sets from nonlinear data using the wavelet transform. Physica D 182: 1–22.
69. Nakamura T, Small M (2005) Small-shuffle surrogate data: Testing for dynamics in fluctuating data with trends. Phys Rev E 72: 056216.
70. Keylock CJ (2006) Constrained surrogate time series with preservation of the mean and variance structure. Phys Rev E 73: 036707.
71. Suzuki T, Ikeguchi T, Suzuki M (2007) Algorithms for generating surrogate data for sparsely quantized time series. Physica D 231: 108–115.