Levels and Age Dependency of
Neurofilament Light and Glial Fibrillary Acidic
Protein in Healthy Individuals and Their
Relation to the Brain Parenchymal Fraction
Mattias Vågberg1
*, Niklas Norgren2, Ann Dring1, Thomas Lindqvist3, Richard Birgander3, Henrik Zetterberg4,5, Anders Svenningsson1
1Department of Pharmacology and Clinical Neuroscience, Section of Neuroscience, UmeåUniversity,
Umeå, Sweden,2UmanDiagnostics AB, Umeå, Sweden,3Department of Radiation Sciences, Section of Diagnostic Radiology, UmeåUniversity, Umeå, Sweden,4Clinical Neurochemistry Laboratory, Institute of Neuroscience and Physiology, the Sahlgrenska Academy at the University of Gothenburg, Mölndal, Sweden, 5UCL Institute of Neurology, Queen Square, London, United Kingdom
*mattias.vagberg@umu.se
Abstract
Background
Neurofilament light (NFL) and Glial Fibrillary Acidic Protein (GFAP) are integral parts of the axonal and astrocytal cytoskeletons respectively and are released into the cerebrospinal fluid (CSF) in cases of cellular damage. In order to interpret the levels of these biomarkers in disease states, knowledge on normal levels in the healthy is required. Another biomarker for neurodegeneration is brain atrophy, commonly measured as brain parenchymal fraction (BPF) using magnetic resonance imaging (MRI). Potential correlations between levels of NFL, GFAP and BPF in healthy individuals have not been investigated.
Objectives
To present levels of NFL and GFAP in healthy individuals stratified for age, and investigate the correlation between them as well as their correlation with BPF.
Methods
The CSF was analysed in 53 healthy volunteers aged 21 to 70 (1 sample missing for GFAP analysis) and 48 of the volunteers underwent determination of BPF using MRI.
Results
Mean (±SD) NFL was 355 ng/L (±214), mean GFAP was 421 ng/L (±129) and mean BPF was 0.867 (±0.035). All three biomarkers correlated with age. NFL also correlated with both GFAP and BPF. When controlled for age, only the correlation between NFL and GFAP retained statistical significance.
a11111
OPEN ACCESS
Citation:Vågberg M, Norgren N, Dring A, Lindqvist T, Birgander R, Zetterberg H, et al. (2015) Levels and Age Dependency of Neurofilament Light and Glial Fibrillary Acidic Protein in Healthy Individuals and Their Relation to the Brain Parenchymal Fraction. PLoS ONE 10(8): e0135886. doi:10.1371/journal. pone.0135886
Editor:Markus Reindl, Medical University of Innsbruck, AUSTRIA
Received:April 21, 2015
Accepted:July 27, 2015
Published:August 28, 2015
Copyright:© 2015 Vågberg et al. This is an open access article distributed under the terms of the
Creative Commons Attribution License, which permits unrestricted use, distribution, and reproduction in any medium, provided the original author and source are credited.
Data Availability Statement:The complete data set can not be made publicly available for ethical reasons. Data are available after decision from the Regional Ethical Review Board of Umeå University for researchers who meet the criteria for access to confidential data.
Conclusions
This study presents data on age-stratified levels of NFL and GFAP in the CSF of healthy individuals. There is a correlation between levels of NFL and GFAP and both increase with age. A correlation between NFL and BPF was also found, but did not retain statistical signifi-cance if controlled for age.
Introduction
Neurofilaments are important structural components in axons in the peripheral as well as the central nervous system (CNS). They compose a heteropolymer of the three subunits: neurofila-ment light (NFL), medium and heavy chains (NFH) [1]. Elevated levels of NFL can be mea-sured in cerebrospinal fluid (CSF) following axonal damage in the CNS [2–4]. Both levels of NFH and NFL have been shown to correlate with age [5–9]. Glial fibrillary acidic protein (GFAP) is another structural component of astrocytes. Elevated GFAP levels in CSF can be seen in cases of astrocytic damage [4]. As with NFL, correlation between levels of GFAP in CSF and age has been described [10], but the relationships have not been thoroughly investigated for either marker in healthy individuals.
It has been shown that global brain atrophy occurs with normal aging in healthy individuals [11]. This can be measured as a decrease in brain parenchymal fraction (BPF), here defined as the total volume of brain parenchyma divided by the total intracranial volume. The BPF has been shown to correlate negatively with age in healthy individuals [12–14].
Both NFL and GFAP are potential clinical biomarkers of central nervous system (CNS) tis-sue damage, but in order to properly interpret individual clinical values the normal range in relation to the patients’age needs to be known. It can also be hypothesised that an dency of tissue damage markers such as NFL and GFAP could correlate with the age-depen-dency of BPF. The goal of this study was to investigate the relationship between levels of NFL and GFAP in CSF of healthy individuals, and their relationships to BPF.
Methods
Study population
Lumbar puncture was performed in 53 (27 females) neurologically healthy volunteers. The vol-unteers were interviewed by a research nurse to screen for any neurological disease or any first degree relatives with such diseases. Individuals with morbidity not directly related to the ner-vous system were accepted for inclusion. Median age was 33.7 years (interquartile range 21.3; range 21 to 69.9). A subset of 48 (24 female) of the individuals also volunteered for magnetic resonance imaging. The median age of the individuals who underwent MRI was 33.0 years (interquartile range 18.4; range 21.3 to 69.9 years).
Analysis of NFL and GFAP
Level of NFL in CSF was measured using ELISA (UmanDiagnostics NF-light assay, Uman-Diagnostics AB) according to the ELISA kit instructions. The manufacturer of the kit states the assay’s lower limit of quantification as 61 ng/l and mean intra- and inter-assay coefficient of variation as 4% and 6% respectively. Levels of NFL were analysed by two different labs, produc-ing dual NFL values for each volunteer.
(ALF). The funders had no role in study design, data collection and analysis, decision to publish, or preparation of the manuscript. UmanDiagnostics AB provided support in the form of salaries for author NN, supplied NFL-kits for the study and provided lab-space for NFL analysis, but did not have any additional role in the study design, data collection and analysis, decision to publish, or preparation of the manuscript. The specific roles of all authors are
articulated in the‘author contributions’section.
Level of GFAP in CSF was measured using an in house ELISA based on polyclonal antibod-ies as previously described in detail [15]. The assay has a lower limit of quantification of 70 ng/l and intra- and inter-assay coefficients of variation of 4% and 8%, respectively.
Magnetic resonance imaging
The MRI was acquired using a 3T Philips scanner. Five echoes were acquired at multiples of 17.5 ms. Four saturation delays were acquired at 150, 570, 1550, and 3370 ms. This resulted in 20 axial images per slice at different echo times and saturation delays, allowing for quantifica-tion of the relaxaquantifica-tion rates R1 and R2 and the proton density. The repetiquantifica-tion time was 3.5 sec-onds for 30 slices of 4.5 mm slice thickness, with a gap of 0.5 mm. The field of view was 230 mm, and the in-plane resolution was 1 mm. The BPF was determined using the SyMap method [13], based on MRI relaxometery.
Ethics statement
The study was approved by the Regional Ethical Review Board of Umeå University and all par-ticipants gave written informed consent.
Statistics
All statistics were computed using SPSS (IBM Corp. 2013 SPSS Statistics for Windows, version 22.0). The Shapiro-Wilk test in conjunction with inspection of histograms and the skewness statistic were used to test for normality of distribution. Age, NFL and BPF were all non-nor-mally distributed. Spearman’s rho was used for bivariate correlation testing. Partial rank corre-lations was used for non-parametric partial correlation testing. Linear regression was used to evaluate the relationship between age and NFL, GFAP and BPF. Wilcoxon signed rank test was used to test for inter-lab differences in NFL levels. Anα-level of 0.05 was chosen for
determina-tion of statistical significance. The Bonferroni-Holm method was applied to control for family-wise error rate in the significance testing of the partial correlations. One individual (specified inFig 1) was excluded from correlation testing and regression line estimation regarding NFL on the basis of having an outlier NFL value and no other individuals of the same age was avail-able for comparison.
Results
Comparison of NFL values between labs
The mean NFL values for the whole group (±SD) were 332ng/L (±221 ng/L) for lab one and 378 ng/L (±209 ng/L) for lab two. The difference was statistically significant (p<0.001).
How-ever, the individual values obtained from the two labs displayed a high degree of correlation (r = 0.977, p<0.001). The mean value of NFL from the two labs was used for all calculations
below.
NFL and GFAP
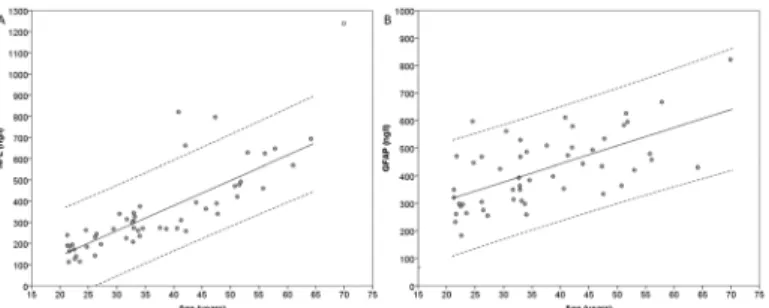
One GFAP sample was missing (data lost), resulting in GFAP values for 52 individuals, NFL values for 53 individuals and BPF values for 48 individuals. All three biomarkers were available for 47 individuals. The mean values of NFL, GFAP and BPF are presented inTable 1. The val-ues for NFL and GFAP are plotted in relation to age inFig 1and linear regressions with age as the independent variable are shown. Both NFL (r = 0.870) and GFAP (r = 0.595) correlated with age (p<0.001). Levels of NFL and GFAP also correlated with each other (r = 0.655,
MRI
The MRI of each individual was examined by an experienced neuroradiologist in conjunction with an experienced neurologist. None of the 48 individuals who underwent MRI had any MRI findings that were determined to be clinically significant. However, ten of the individuals had abnormal findings of benign appearance assumed to have minimal impact on the measure-ments of NFL, GFAP and BPF. These included one case of Arnold Chiari malformation type 1, one case of hyperostosis, one case of sinusitis, two cases of pineal gland cysts, one case of caver-noma and four cases of unspecific white matter changes of gliotic appearance.
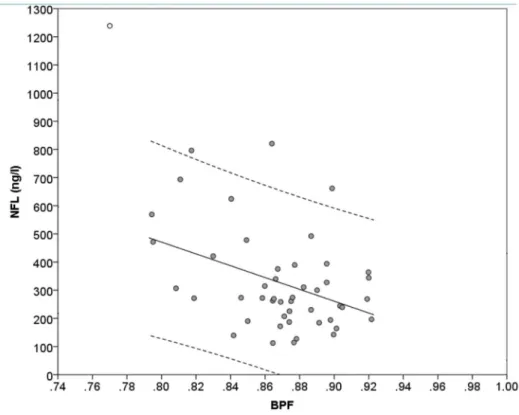
The BPF values are presented inTable 1. The BPF correlated negatively with levels of NFL (r = -0.308, p = 0.035) and with age (r = -0.396, p = 0.005) but not with GFAP (p = 0.151). Val-ues of NFL are presented plotted against valVal-ues of BPF inFig 2.
Partial correlation
Partial correlations while controlling for age are shown inTable 2. In this analysis only the cor-relation between NFL and GFAP remained statistically significant.
Fig 1. Levels of NFL and GFAP plotted against age.The levels of NFL (A) and GFAP (B) in CSF plotted against age. The dashed lines represent 95% prediction intervals. The linear regression between NFL and age had an R2-value of 0.649, a coefficient of 11.8 ng/l/year (SE = 1.23, p<0.001) and an intercept at -95 ng/l
(p = 0.05). The linear regression between GFAP and age had an R2-value of 0.394, a coefficient of 6.56ng/l/
year (SE = 1.15, p<0.001), and an intercept at 180 ng/l (p<0.001). One outlier case (circle filled with white)
was excluded from the calculation of the regression line and prediction interval regarding the regression between NFL and age. NFL = Neurofilament Light. GFAP = Glial Fibrillary Acidic Protein.
doi:10.1371/journal.pone.0135886.g001
Table 1. Mean values of NFL, GFAP and BPF.
Age (years)
NNFL(median age;
IQR)
Median NFL (IQR) NGFAP(median age;
IQR)
Median GFAP (IQR)
NBPF(median age;
IQR)
Median BPF (IQR)
<30 17 (22.8; 4.46) 187 (94.0) ng/l 17 (22.8; 4.46) 298 (173) ng/l 17 (22.8; 4.46) 0.887 (0.0357) 30 to<40 15 (33.0; 1.37) 274 (66.5) ng/l 15 (33.0; 1.37) 384 (172) ng/l 14 (33.0; 1.72) 0.867 (0.0230) 40 to<60 18 (47.6; 9.99) 466 (275) ng/l 18 (47.6; 9.99) 486 (155) ng/l 14 (46.5; 9.41) 0.866 (0.0511) 60+ 3 (64.2; 61.0–70.0*) 693 (568–1239*)
ng/l
2 (67.0; 64.2–70.0*) 626 (430–822*) ng/l
3 (64.2; 61.0–70.0*) 0.794 (0.770– 0.811)
The mean values of NFL, GFAP and BPF, stratified by age. *denotes that the numbers indicate range instead of IQR IQR = Interquartile range
NFL = Neurofilament Light
GFAP = Glial Fibrillary Acidic Protein BPF = Brain Parenchymal Fraction.
Discussion
This study presents age-stratified levels of NFL and GFAP, showing an increase in both bio-markers with increasing age. Both biobio-markers also correlated with each other and NFL, but not GFAP, correlated with BPF. When correlations were controlled for age using partial correla-tions, the correlation between NFL and GFAP decreased but retained statistical significance. This correlation may indicate an individual variation in axonal and glial cell turnover that is
Fig 2. Level of NFL plotted against BPF.The level of NFL plotted against BPF. The dashed lines represent 95% prediction intervals. The linear regression had an R2-value of 0.154, a coefficient of -210ng/l per 0.1
change in BPF (SE = 73, p = 0.006) and an intercept at 2150 ng/l (p = 0.002). One outlier case (circle filled with white) was excluded from the calculation of the regression line and prediction interval regarding the regression between NFL and BPF. NFL = Neurofilament Light. BPF = Brain Parenchymal Fraction.
doi:10.1371/journal.pone.0135886.g002
Table 2. Partial correlations while controlling for age.
Partial correlations while controlling for age
NFL GFAP BPF
NFL - 0.38 (p = 0.027)* -0.001 (p = 1.0)
GFAP - - -0.003 (p = 1.0)
Partial rank correlations between the values of NFL, GFAP and BPF while controlling for age. The p-values are adjusted using Bonferroni-Holm correction. One outlier case (specified inFig 1) was excluded from correlation testing involving NFL. This exclusion did not affect any statistical significances.
*denotes statistically significant correlation NFL = Neurofilament Light
GFAP = Glial Fibrillary Acidic Protein BPF = Brain Parenchymal Fraction.
separate from the effect of normal ageing. Future studies investigating longitudinal data from the same individuals could be helpful in clarifying this. The correlation between NFL and BPF was markedly reduced and did not retain statistical significance when controlled for age, indi-cating that the correlation between the variables in a cross-sectional setting entirely or to a great degree is based on their respective association to age. It is interesting to note that previous data on the correlation between NFL and age show that while it can be seen in the healthy con-trols it is absent in patients with the MS associated entity clinically isolated syndrome, perhaps indicating that the pathological neurodegeneration caused by the disease is of such a magnitude that it masks the NFL levels associated with the natural aging process [6,9]
Even if the three biomarkers ultimately would represent the same age-related degenerative process a lack of correlation could perhaps be explained by the biological difference in dynam-ics between them. A decrease in BPF is commonly interpreted as representing an accumulation of tissue damage over time with only a smaller component of dynamic variation due to physio-logical factors such as hydration status. The levels of NFL and GFAP, on the other hand, are more dynamic and quickly elevated following pathologic tissue damage [16]. The dynamics of the normal level of NFL and GFAP are not well known. It is furthermore possible that an indi-vidual’s current levels of NFL and GFAP could represent current tissue damage resulting in subsequent, but not concurrent, decrease in BPF. This hypothesis is strengthened by the fact that one previous study looking at correlation between NFL and normalised brain volume (NBV, a measurement similar to BPF) saw no correlation in cross-sectional testing but pre-sented a correlation between level of NFL and subsequent decrease in NBV [9]. Further longi-tudinal studies comparing levels of CSF biomarkers with subsequent change in BPF could increase our understanding of age-related neurodegeneration further.
The reason for age dependency is not thoroughly understood regarding any of the three bio-markers investigated in this study. The correlations with age suggest ongoing CNS tissue dam-age with normal dam-ageing but the biological cause of this is not well known. It could perhaps be hypothesised that subclinical cerebrovascular changes are a factor, since cerebrovascular pathology is common, increases with higher age and has previously been associated with both lower BPF [17] and higher levels of NFL and GFAP in CSF [16]. Further research is needed to elucidate this matter.
It is important to note that 53 individuals are not enough to unequivocally define the ranges of normal variation, especially for older age groups where the number of volunteers was low. However, given the difficulty in recruiting healthy volunteers to provide CSF samples due to many perceiving the procedure of lumbar puncture to be uncomfortable, this moderately sized sample set provides an important starting point for assessing the normal ranges of these biomarkers.
Acknowledgments
We would like to thank the staff at the Neurology and Radiology departments at Umeå Univer-sity hospital, at UmanDiagnostics AB and at the Sahlgrenska Academy at the UniverUniver-sity of Gothenburg for all their help and assistance. We would further like to thank Marcel Warntjes of SyntheticMR AB for technical support regarding the SyMap method and for comments on the method section of the manuscript. We would also like to thank Gabriel Granåsen for statis-tical advice and cristatis-tical reading of the manuscript.
Author Contributions
Conceived and designed the experiments: MV AS NN TL RB. Performed the experiments: MV TL RB NN AD HZ. Analyzed the data: MV AS NN. Contributed reagents/materials/analysis tools: NN AD HZ TL RB. Wrote the paper: MV NN AD TL RB HZ AS. Investigated MRI scans for signs of pathology: TL RB. Acquiring funding: MV AS.
References
1. Lee MK, Cleveland DW. Neuronal intermediate filaments. Annu Rev Neurosci. 1996; 19:187–217. Epub 1996/01/01. doi:10.1146/annurev.ne.19.030196.001155PMID:8833441.
2. Teunissen CE, Iacobaeus E, Khademi M, Brundin L, Norgren N, Koel-Simmelink MJ, et al. Combination of CSF N-acetylaspartate and neurofilaments in multiple sclerosis. Neurology. 2009; 72(15):1322–9. Epub 2009/04/15. [pii]. PMID:19365053.
3. Neselius S, Brisby H, Theodorsson A, Blennow K, Zetterberg H, Marcusson J. CSF-biomarkers in Olympic boxing: diagnosis and effects of repetitive head trauma. PLoS One. 2012; 7(4):e33606. Epub 2012/04/13. doi:10.1371/journal.pone.0033606PONE-D-11-24988 [pii]. PMID:22496755; PubMed Central PMCID: PMC3319096.
4. Guez M, Hildingsson C, Rosengren L, Karlsson K, Toolanen G. Nervous tissue damage markers in cerebrospinal fluid after cervical spine injuries and whiplash trauma. J Neurotrauma. 2003; 20(9):853– 8. Epub 2003/10/28. doi:10.1089/089771503322385782PMID:14577863.
5. Kuhle J, Leppert D, Petzold A, Regeniter A, Schindler C, Mehling M, et al. Neurofilament heavy chain in CSF correlates with relapses and disability in multiple sclerosis. Neurology. 2011; 76(14):1206–13. doi: 10.1212/WNL.0b013e31821432ffPMID:21346223.
6. Kuhle J, Plattner K, Bestwick JP, Lindberg RL, Ramagopalan SV, Norgren N, et al. A comparative study of CSF neurofilament light and heavy chain protein in MS. Mult Scler. 2013; 19(12):1597–603. Epub 2013/03/27. doi:10.1177/1352458513482374[pii]. PMID:23529999.
7. Skillback T, Farahmand B, Bartlett JW, Rosen C, Mattsson N, Nagga K, et al. CSF neurofilament light differs in neurodegenerative diseases and predicts severity and survival. Neurology. 2014; 83 (21):1945–53. Epub 2014/10/24. doi:10.1212/WNL.0000000000001015[pii]. PMID:25339208. 8. Skillback T, Zetterberg H, Blennow K, Mattsson N. Cerebrospinal fluid biomarkers for Alzheimer
dis-ease and subcortical axonal damage in 5,542 clinical samples. Alzheimers Res Ther. 2013; 5(5):47. Epub 2014/02/01. doi:10.1186/alzrt212[pii]. PMID:24479774; PubMed Central PMCID:
PMC3978733.
9. Khalil M, Enzinger C, Langkammer C, Ropele S, Mader A, Trentini A, et al. CSF neurofilament and N-acetylaspartate related brain changes in clinically isolated syndrome. Mult Scler. 2013; 19(4):436–42. doi:10.1177/1352458512458010PMID:22917689; PubMed Central PMCID: PMC3652709. 10. Norgren N, Sundstrom P, Svenningsson A, Rosengren L, Stigbrand T, Gunnarsson M. Neurofilament
and glial fibrillary acidic protein in multiple sclerosis. Neurology. 2004; 63(9):1586–90. Epub 2004/11/ 10. 63/9/1586 [pii]. PMID:15534240.
11. Fotenos AF, Snyder AZ, Girton LE, Morris JC, Buckner RL. Normative estimates of cross-sectional and longitudinal brain volume decline in aging and AD. Neurology. 2005; 64(6):1032–9. Epub 2005/03/23. doi:10.1212/01.WNL.0000154530.72969.11PMID:15781822.
12. Moscufo N, Guttmann CRG, Meier D, Csapo I, Hildenbrand PG, Healy BC, et al. Brain regional lesion burden and impaired mobility in the elderly. Neurobiology of Aging. 2011; 32(4):646–54. doi:10.1016/j. neurobiolaging.2009.04.010PMID:19428145
14. Knoops AJG, Van Der Graaf Y, Appelman APA, Gerritsen L, Mali WPTM, Geerlings MI. Visual rating of the hippocampus in non-demented elders: Does it measure hippocampal atrophy or other indices of brain atrophy? The SMART-MR study. Hippocampus. 2009; 19(11):1115–22. doi:10.1002/hipo.20575 PMID:19253411
15. Rosengren LE, Wikkelso C, Hagberg L. A sensitive ELISA for glial fibrillary acidic protein: application in CSF of adults. J Neurosci Methods. 1994; 51(2):197–204. Epub 1994/03/01. PMID:8051950. 16. Hjalmarsson C, Bjerke M, Andersson B, Blennow K, Zetterberg H, Aberg ND, et al. Neuronal and
glia-related biomarkers in cerebrospinal fluid of patients with acute ischemic stroke. J Cent Nerv Syst Dis. 2014; 6:51–8. Epub 2014/06/17. doi:10.4137/JCNSD.S13821[pii]. PMID:24932109; PubMed Central PMCID: PMC4039292.
17. Appelman AP, Vincken KL, van der Graaf Y, Vlek AL, Witkamp TD, Mali WP, et al. White matter lesions and lacunar infarcts are independently and differently associated with brain atrophy: the SMART-MR study. Cerebrovasc Dis. 2010; 29(1):28–35. Epub 2009/11/07. doi:10.1159/000255971[pii]. PMID: 19893309.