UDC: 3.33 ISSN: 0013-3264
* University of Niš – Faculty of Economics, Serbia, E-mail: danijela.stosic@eknfak.ni.ac.rs JEL CLASSIFICATION: L26, J16
ABSTRACT: The paper presents results of an empirical study of the importance of qualitative and quantitative dimensions of business success for female entrepreneurs in the Republic of Serbia. There is empirical evidence that qualitative components, such as customer and employee satisfaction, re-lations with stakeholders, and family-work balance are more important to Serbian female entrepreneurs. Quantitative
com-ponents (profit and employment growth, personal wealth, and other personal goals), although lower ranked, are also an im-portant aspect of business success. These results also confirm that female entrepre-neurs in Serbia have a diverse perception of business success.
KEY WORDS: women’s entrepreneurship, business success, Republic of Serbia
DOI:10.2298/EKA1608121S
Danijela Stošić*
ASPECTS OF THE BUSINESS SUCCESS
IMPORTANT TO FEMALE ENTREPRENEURS
IN URBAN AREAS OF THE REPUBLIC
1. INTRODUCTION
A gender gap in entrepreneurial performance has been verified in a number of empirical studies (Bardasi, Sabarwal, and Terrell 2011; Klapper and Parker 2010; Parker 2009; Watson 2003). A gender gap in favour of male entrepreneurs has been recorded in a wide range of performances measures. Businesses owned by women have less assets (Burke, FitzRoy, and Nolan 2002; Parker 2009) and fewer employees (Carter and Bennett 2006; Kamberidou 2013; Fairlie and Robb 2009). Female entrepreneurs generate less sales revenue (Bardasi et al. 2011; Vossenberg 2013), are less profitable (Lerner and Almor 2002; Parker 2009), and achieve a lower business growth rate (Manolova, Carter, Manev, and Gyoshev 2007; Rietz and Henrekson 2000). As the entrepreneurial gender-gap studies mainly use financial performance measures (Buttner and Moore 1997), the question of a possible gender perspective of business performance has been raised (Danes, Stafford, and Loy 2007). Namely, it has been argued that there is a difference in the perception of business success for female and male entrepreneurs. The dominance of the non-financial component of business success for female entrepreneurs can direct their business goals and achievements. Therefore, in order to get a complete picture of female entrepreneurial performance it may be useful to expand the set of performance measures (Brush 1992; Morris, Miyasaki, Watters, and Coombes 2006). With that in mind, the aim of the paper is to examine the self-reported perception of business success by female entrepreneurs in the Republic of Serbia. Based on the results presented by Buttner (2001), Jome, Donahaue, and Siegel (2006), and Robichaud, Zinger, and LeBrasseur (2007), the scale for measuring the importance of various aspects of business success will be enriched with non-pecuniary dimensions, such as customer and employee satisfaction, relationships with stakeholders, and balance between family and work obligations.
The rest of the paper is structured as follows: section 2 reviews the literature on the problem of female entrepreneurs’ perception of business success. The research hypothesis is then defined in the presented conceptual framework. The research methodology is explained in detail in the following section. The results are shown in the fourth section, and are discussed in the section 5. Finally, certain concluding remarks are presented.
2. LITERATURE REVIEW
as connectedness, supportiveness, kindness, and expressiveness, while men are taught to be independent, brave, and autonomous (Buttner 2001; Gupta, Turban, Wasti, and Sikdar 2009). In most cultures, instrumental traits such as ambition, power orientation, and self-reliance are attached to men, while expressive traits such as social concern and deference are reserved for women (Mueller and Dat-on 2013).
If the value systems of women and men are differently shaped through their socialization, they will produce differences in their later perceptions of business success (Greene, Brush, Hart, and Saparito 2001). If women are taught to take care of others and to build relationships, later in life they will mainly use social relationships and other qualitative measures of (business) success (Greene et al. 2001; Verheul and Thurik 2001). Men, on the other hand, are taught to be aggressive and independent and will probably use economic and other quantitative measures of success. Because differences are socially built in the value systems of women and men, women are taught to prioritize social values and qualitative relations, while men mostly care for economic values, quantity, power, and status (Cliff 1998). That is the reason why women use less objective measures of success. Women tend to value business performance through the prism of non-financial measures – customer and employee satisfaction and family-work balance – while economic goals are more important to men (Robichaud et al. 2007). Morris et al. (2006) argue that female entrepreneurs are less interested in business growth partly because they are taught not to be aggressive, competitive, and risk-taking – all of which are prerequisites for growth.
In line with the cited studies it is hypothesized that:
For female entrepreneurs in Serbia, the qualitative dimension of business success is more important than the quantitative dimension.
3. METHODOLOGY
3.1. Variables
An eight-item questionnaire was used to assess female entrepreneurs’ perception of the importance of different aspects of business success: profit growth (PfGr), employment growth (EpmlGr), personal wealth (PrsnlWlth), personal goals (PrsnlGoals), customer satisfaction and loyalty (SatLoyCust), employee satisfaction and development (SatDevEmpl), relationships with employees and customers (RelEmplCust), and family-work balance (FamWorkBal). Female entrepreneurs’ perception of business success was assessed on a five-point Likert scale (1 – completely insignificant; 2 – insignificant; 3 – neutral; 4 – important, 5 – particularly significant) designed to rank the importance of different dimensions of business success.
3.2. Sample and Data Collection
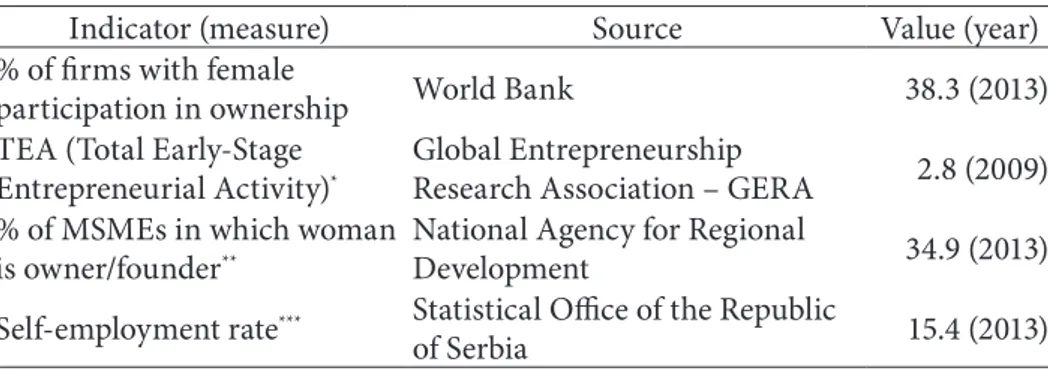
The research target population, i.e., sample units, were micro, small, and medium sized enterprises (MSMEs) and women registered as entrepreneurs (sole traders) with the Serbian Business Registers Agency. Survey units were female owners of MSMEs and entrepreneurs located in urban areas in the Republic of Serbia. Lack of uniform and publicly available data on female entrepreneurship impedes research of this phenomenon in Serbia, where, according to official documents, there is no gender-sensitive system of regular monitoring of entrepreneurship (Ministry of Finance and Economy, Ministry of Regional Development and Local Self-Government, and National Agency for Regional Development 2012, p. 81). Therefore it is difficult to determine the exact number of female entrepreneurs in Serbia (owners of MSMEs and female sole traders), that is, the actual size of the target population of the research. This can be illustrated by various data on the extent of the entrepreneurial activity of women in Serbia cited in different sources (Table 1).
The sample was then generated from several databases of female entrepreneurs1. Although such convenience sampling has disadvantages (Gravetter and Forzano 2015, pp. 147-148; Weathington, Cunningham, and Pittenger 2010, pp. 205-206), this approach was chosen as a cost-effective option of sample generating.
Table 1: The Scope of the Female Entrepreneurial Activity in Serbia
Indicator (measure) Source Value (year)
% of firms with female
participation in ownership World Bank 38.3 (2013)
TEA (Total Early-Stage Entrepreneurial Activity)*
Global Entrepreneurship
Research Association – GERA 2.8 (2009) % of MSMEs in which woman
is owner/founder**
National Agency for Regional
Development 34.9 (2013)
Self-employment rate*** Statistical Office of the Republic
of Serbia 15.4 (2013)
*Individuals starting a venture and those running a business less than 3.5 years old as a
percentage of the adult population (18-64 years old); **Given as an average of the individual relative participation of women owners/founders in micro, small, and medium-sized enterprises companies and entrepreneurs; ***Calculated as a relative share of the self-employed women in the structure of employed women aged 15 and over.
Source: GERA 2009; National Agency for Regional Development 2013; Statistical Office of the Republic of Serbia 2014; World Bank 2013.
The questionnaire used for data gathering was distributed either personally or by e-mail. The variables of interest were measured on a basis of sample units’ responses to closed-end questions. When databases were publicly available2, the female entrepreneurs were contacted directly by the researcher. Otherwise, the questionnaire along with the covering letter explaining the aim and the purpose of the study were sent to the associations and banks, asking them to forward the questionnaire to their members/clients. As the female entrepreneurs’ associations and especially the banks3 did not reveal the number of their members/clients, nor
1 Female Entrepreneur Databases of: Chamber of Commerce and Industry of Serbia; First Women’s Club; Institute for Gender Equality of Province of Vojvodina; Association of Business Women Nadežda Petrović, Čačak; Association of Business Women, Subotica; Female Entrepreneurship Network Fenomena, Kraljevo; Centre for female entrepreneurship Teodora, Niš; several commercial banks’ databases.
2 As was the case with the database of the Chamber of Commerce and Industry of Serbia; Association of Business Women Nadežda Petrović, Čačak; Centre for female entrepreneurship Teodora, Niš.
the number of female entrepreneurs that they had contacted, it was not possible to determine the initial sample size.
Forty completed questionnaires were received in the period July-October 2014. Unfortunately, the response rate, as suggested by the American Association for Public Opinion Research (2015), could not be determined. Although the size of the realised sample is known (n=40), the problem is the fact that the size of the initial (planned) sample is unknown.
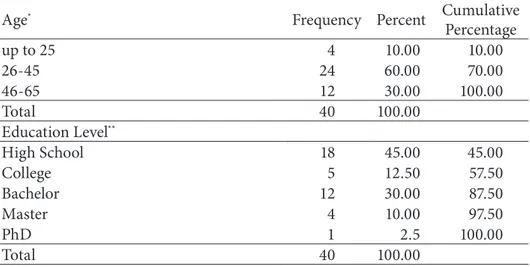
The demographic structure of the respondents was determined by educational level: without primary education; primary education; high school; college; bachelor; master; PhD; and by educational field: services; general programmes; education; social sciences, business and law; agriculture and veterinary; humanities and arts; science; health and welfare; engineering, manufacturing, and construction. Age groups were defined as follows: up to 25 years-old; 26-45; 46-65, and more than 66 years-old.
Most of the respondents were 26-45 years-old (Table 2). High school was the last completed educational level for most of the female entrepreneurs, followed by bachelor degree, college, and masters. Only one respondent had a PhD. Most of the entrepreneurs were educated in social sciences, while engineering, manufacturing, and construction were the least frequent fields.
Table 2: Demographic Characteristics of the Sample
Age* Frequency Percent Cumulative
Percentage
up to 25 4 10.00 10.00
26-45 24 60.00 70.00
46-65 12 30.00 100.00
Total 40 100.00
Education Level**
High School 18 45.00 45.00
College 5 12.50 57.50
Bachelor 12 30.00 87.50
Master 4 10.00 97.50
PhD 1 2.5 100.00
Age* Frequency Percent Cumulative Percentage Education Field
Services 8 20.00 20.00
General programmes 5 12.50 32.50
Education 8 20.00 52.50
Social sciences, business, and law 9 22.50 75.00
Agriculture and veterinary 2 5.00 80.00
Humanities and arts 1 2.50 82.50
Science 3 7.50 90.00
Health and welfare 3 7.50 97.50
Engineering, manufacturing, and
construction 1 2.50 100.00
Total 40 100.00
* There were no female entrepreneurs older than 66 years in the sample; ** High school was the
lowest educational level of the sample units. Source: Author’s calculation
3.3. Statistical methods
(critical value: Cronbach’s α≥0.60). As each item contributes to the scale in the same manner there was no need for reverse coding.
To test whether the mean difference between extracted components was statistically different from zero, a paired-samples t-test was performed on component-based scores. As suggested by Janssens, Wijnen, Pelsmacker, and Kenhove (2008, p. 59), the paired sample t-test was chosen because the same respondents have evaluated each aspect of business success. As a prerequisite, the existence of significant outliers in the difference between the two related groups was checked. Moreover, the Shapiro-Wilk test was used to determine whether the distribution of the differences in the dependent variable between the two related groups was normally distributed. Software package SPSS, ver. 22 (Statistical Package for Social Science) was used as technical support for performing the statistical analysis.
4. RESULTS
A PCA was run on the eight-item questionnaire measuring female entrepreneurs’ subjective perception of business success. The suitability of PCA was assessed prior to the analysis. The assumption about linear related variables was met and there were no outliers in the data, as assessed by visual inspection of a boxplot. All variables have at least one correlation coefficient greater than 0.3 (Table 3).
Table 3: Correlation Matrix
PfGr EmplGr PrsnlWlth PrsnlGoals SatLoyCust SatDevEmpl RelEmplCust FamWorkBal
PfGr 1.000 .619 .619 .809 .422 .416 .485 .461
EmplGr .619 1.000 .527 .540 .306 .691 .502 .445
PrsnlWlth .619 .527 1.000 .631 .389 .379 .266 .456
PrsnlGoals .809 .540 .631 1.000 .615 .451 .435 .603
SatLoyCust .422 .306 .389 .615 1.000 .633 .669 .656
SatDevEmpl .416 .691 .379 .451 .633 1.000 .796 .563
RelEmplCust .485 .502 .266 .435 .669 .796 1.000 .575
FamWorkBal .461 .445 .456 .603 .656 .563 .575 1.00
Source: Author’s calculation
Table 4: KMO and Bartlett’s Test
Kaiser-Meyer-Olkin Measure of Sampling Adequacy .767
Bartlett’s Test of Sphericity
Approx. Chi-Square 210.263
df 28
Sig. .000
Source: Author’s calculation
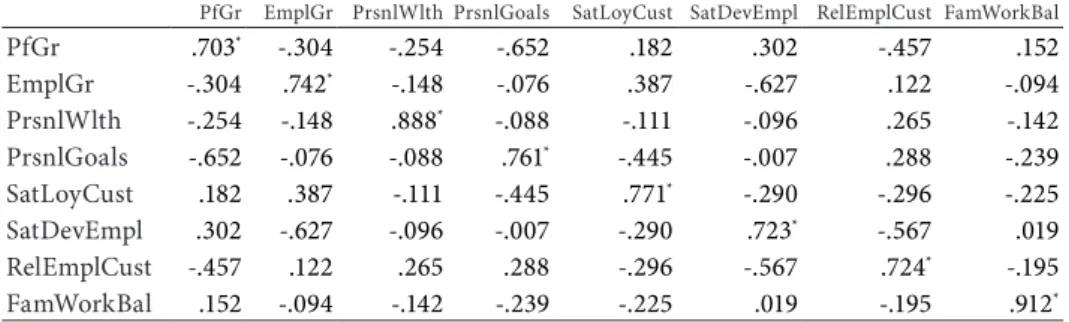
Individual KMO measures were all greater than 0.7 (Table 5).
Table 5: Anti-image Correlation
PfGr EmplGr PrsnlWlth PrsnlGoals SatLoyCust SatDevEmpl RelEmplCust FamWorkBal
PfGr .703* -.304 -.254 -.652 .182 .302 -.457 .152
EmplGr -.304 .742* -.148 -.076 .387 -.627 .122 -.094
PrsnlWlth -.254 -.148 .888* -.088 -.111 -.096 .265 -.142
PrsnlGoals -.652 -.076 -.088 .761* -.445 -.007 .288 -.239
SatLoyCust .182 .387 -.111 -.445 .771* -.290 -.296 -.225
SatDevEmpl .302 -.627 -.096 -.007 -.290 .723* -.567 .019
RelEmplCust -.457 .122 .265 .288 -.296 -.567 .724* -.195
FamWorkBal .152 -.094 -.142 -.239 -.225 .019 -.195 .912*
*Measures of Sampling Adequacy Source: Author’s calculation
PCA revealed two components that had eigenvalues greater than one and which explained 59.39% and 14.36% of the total variance, respectively (Table 6). In addition, with a two-component solution the interpretability criterion was met. Therefore two components were retained.
Table 6: Total Variance Explained
Initial Eigenvalues Extraction Sums of Squared Loadings Rotation Sums of Squared Loadings
Component Total Variance% of Cumulative % Total Variance% of Cumulative % Total Variance% of Cumulative %
1 4.751 59.389 59.389 4.751 59.389 59.389 3.030 37.869 37.869 2 1.149 14.364 73.753 1.149 14.364 73.753 2.871 35.884 73.753 3 .780 9.748 83.501
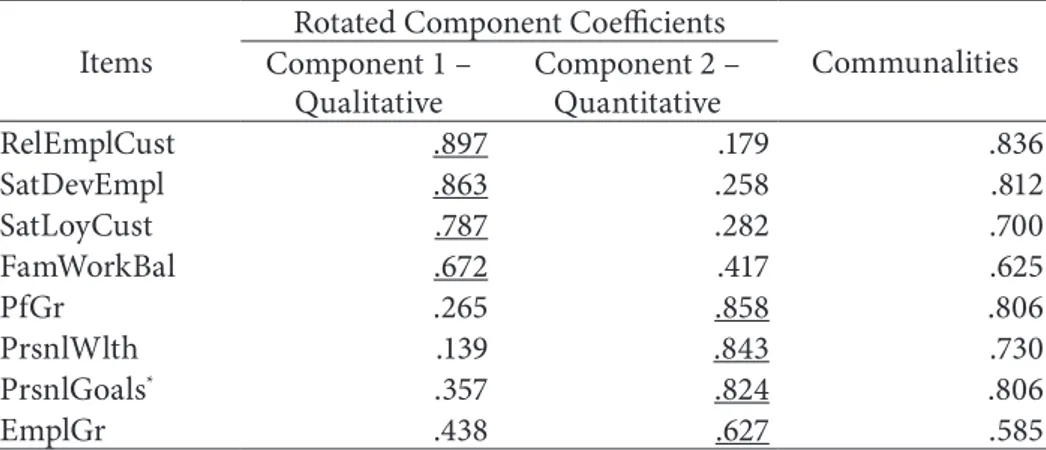
The two-component solution explains 73.75% of the total variance. The interpretation of the data is consistent with the business success aspects the questionnaire was designed to measure, with strong loadings of non-pecuniary items on Component 1 and of pecuniary items on Component 2. Hence Component 1 was labelled the qualitative dimensionof business success while Component 2 reflects the quantitative aspect of business success. Component loadings and communalities of the rotated solution are presented in Table 7.
Table 7: Rotated Structure Matrix for PCA with Varimax Rotation of a Two-Component Questionnaire
Items
Rotated Component Coefficients
Communalities Component 1 –
Qualitative
Component 2 – Quantitative
RelEmplCust .897 .179 .836
SatDevEmpl .863 .258 .812
SatLoyCust .787 .282 .700
FamWorkBal .672 .417 .625
PfGr .265 .858 .806
PrsnlWlth .139 .843 .730
PrsnlGoals* .357 .824 .806
EmplGr .438 .627 .585
* The item Personal Goals is strongly loaded on the Quantitative component, which suggests that personal goals are primarily associated with the financial/pecuniary aspect.
Extraction Method: Principal Component Analysis.
Rotation Method: Varimax with Kaiser Normalization. Rotation converged in 3 iterations.
Source: Author’s calculation
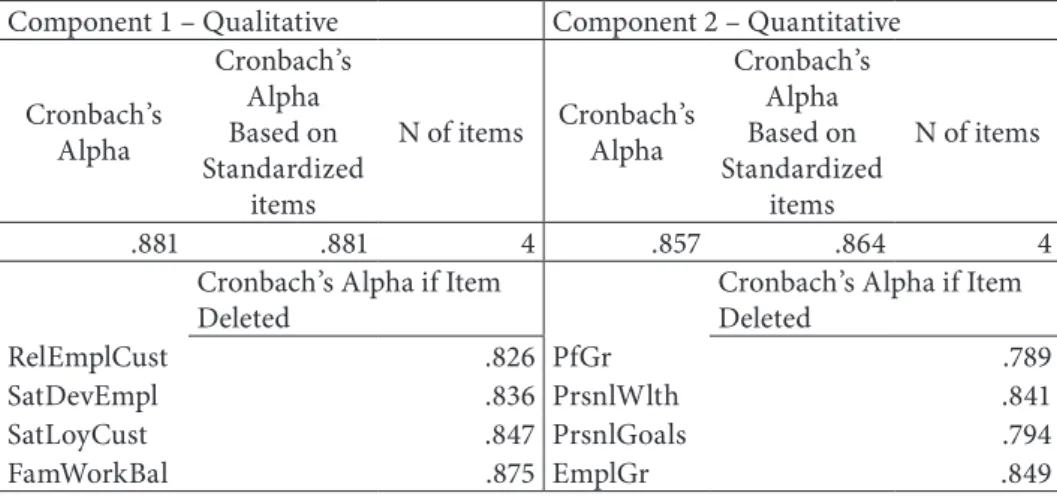
Table 8: Component Scales’ Internal Reliability
Component 1 – Qualitative Component 2 – Quantitative Cronbach’s
Alpha
Cronbach’s Alpha Based on Standardized
items
N of items Cronbach’s Alpha
Cronbach’s Alpha Based on Standardized
items
N of items
.881 .881 4 .857 .864 4
Cronbach’s Alpha if Item Deleted
Cronbach’s Alpha if Item Deleted
RelEmplCust .826 PfGr .789
SatDevEmpl .836 PrsnlWlth .841
SatLoyCust .847 PrsnlGoals .794
FamWorkBal .875 EmplGr .849
Source: Author’s calculation
A paired-samples t-test was run to determine whether there was a statistically significant mean difference between component-based scores for the qualitative and the quantitative dimensions of business success. The differences between the average values of the component-based scores were normally distributed, as assessed by Shapiro-Wilk’s test (p=0.530), and no outliers in the data were detected. Paired samples descriptive statistics are presented in Table 9.
Table 9: Paired Samples Statistics
Mean N Std. Deviation Std. Error Mean
Component 1 – Qualitative 4.3833 40 .73786 .11667
Component 2 – Quantitative 3.9500 40 .81492 .12885
Source: Author’s calculation
Table 10: Paired Samples Test
Mean
Std. Deviation
Std. Error Mean
95% Confidence Interval of the
Difference
Lower Upper t df
Sig. (2-tailed) Pair 1
Component 1 – Component 2
.43333 .67732 .10709 .21672 .64995 4.046 39 .000
Source: Author’s calculation
5. DISCUSSION
As expected, the qualitative dimension of business success was more valued than the quantitative dimension by female entrepreneurs in Serbia (t(39)=4.046, p<0.0005, d=0.64). However, these results do not indicate that the quantitative dimension of business success is unimportant to female entrepreneurs. Quite the opposite: the average value of importance for this dimension (3.95±0.81) suggests that profit and employment growth, personal wealth accumulation, and realization of other personal goals are important aspects of business success for Serbian female entrepreneurs. Nevertheless, in the complex structure of self-perceived business success, female entrepreneurs prioritize the qualitative dimension. In line with similar studies (Cliff 1998; Greene et al 2001; Verheul and Thurik 2001), Serbian female entrepreneurs attach more value to customer satisfaction and loyalty, employee satisfaction and development, relationships with employees and customers, and family-work balance as measures of business success.
finance management, female entrepreneurs may see themselves as insufficiently competent to achieve the financial aspect of the success. Because they may perceive themselves as more effective in the field of human relations, female entrepreneurs may be more confident it their ability to achieve this aspect of business goals, and therefore they could (consciously or unconsciously) care more for this dimension of business success. Additionally, revenue from female entrepreneurial activity is, in most cases, a secondary source of family income (Farlie and Robb 2009), and therefore it might be expected that female entrepreneurs are more likely to report the qualitative components of business success as more important.
6. CONCLUSION
Both qualitative and quantitative components of business success are important to Serbian female entrepreneurs. A high average score for the importance of the quantitative dimension of business success refutes statements that profits, employment growth, and personal wealth are not important to female entrepreneurs. However, although undoubtedly significant, for Serbian female entrepreneurs the quantitative dimension of business success is not as important as the qualitative dimension. Being more valued, the qualitative dimension can determine the goals that female entrepreneurs set for their businesses and the achieved performance. Therefore the set of business success measures in empirical studies should be expanded. This is of particular importance for studies that examine the gender aspect of entrepreneurial business success.
REFERENCES
American Association for Public Opinion Research (2015). Standard Definitions – Final Dispositions of Case Codes and Outcome Rates for Surveys. Retrieved from http://www.aapor.org/ AAPORKentico/AAPOR_Main/media/publications/Standard-Definitions2015_8theditionwithc hanges_April2015_logo.pdf
Babović, M. (2012). Ka kvalitetnom praćenju preduzetništvu žena u Srbiji – Skraćeni izveštaj na osnovu polazne studije o preduzetništvu žena u Srbiji. Beograd: Program Ujedinjenih Nacija za razvoj.
Bardasi, E., Sabarwal, S. & Terrell, K. (2011). How do female entrepreneurs perform? Evidence from three developing regions. Small Business Economics, 37 (4), pp. 417-441.
Brush, C. (1992). Research on Women Business Owners: Past Trends, a New Perspective and Future Directions. Entrepreneurship Theory and Practice, 16 (4), pp. 5-30.
Bryman, A. & Cramer, D. (2005). Quantitative Data Analysis with SPSS 12 and 13 – A Guide for Social Scientists. Hove, East Sussex: Routledge.
Burke, A., FitzRoy, F. & Nolan, M. (2002). Self-employment Wealth and Job Creation: The Roles of Gender, Non-pecuniary Motivation and Entrepreneurial Ability. Small Business Economics, 19 (3), pp. 255-270.
Buttner, H. (2001). Examining Female Entrepreneurs’ Management Style: An Application of Relational Frame. Journal of Business Ethics, 29 (3), pp. 253-269.
Buttner, H. & Moore, D. (1997). Women’s Organizational Exodus to Entrepreneurship: Self-Reported Motivations and Correlates with Success. Journal of Small Business Management, 35 (1), pp. 34-46.
Carter, S. & Bennett, D. (2006). Gender and Entrepreneurship. In S. Carter and D. Jones-Evans (Eds.), Enterprise and Small Business – Principles, Practice and Policies. Harlow: Prentice Hall.
Cliff, J. (1998). Does one size fit all? Exploring the relationship between attitudes towards growth, gender, and business size. Journal of Business Venturing, 13 (6), pp. 523-542.
Danes, S., Stafford, K. & Loy, J. (2007). Family business performance: The effects of gender and management. Journal of Business Research, 60 (10), pp. 1058-1069.
Díaz-García, M. & Jiménez-Moreno, J. (2010). Entrepreneurial intention: the role of gender. International Entrepreneurship and Management Journal, 6 (3), pp. 261-283.
Global Entrepreneurship Research Association – GERA (2009). Total early stage entrepreneurial Activity for Female Working Age Population. Retrieved from http://www.google.co.uk/publicdata/ explore?ds=k6n6dkler1898_#!ctype=l&strail=false&bcs=d&nselm=h&met_y=Teayyfem&scale_ y=lin&ind_y=false&rdim=country&idim=country:RS&ifdim=country&hl=en_US&dl=en_ US&ind=false
Gravetter, F. & Forzano, L-A. (2015). Research Methods for the Behavioral Sciences. Stamford: Cengage Learning.
Greene, P., Brush, C., Hart, M. & Saparito, P. (2001). Patterns of venture capital funding: is gender a factor? Venture Capital, 3 (1), pp. 63-83.
Gupta, V., Turban, D., Wasti, A. & Sikdar, A. (2009). The Role of Gender Stereotypes in Perceptions of Entrepreneurs and Intentions to Become an Entrepreneur. Entrepreneurship Theory and Practice, 33 (2), pp. 397-417.
Janssens, W., Wijnen, K., Pelsmacker, P. & Kenhove, P. (2008). Marketing Research with SPSS. Harlow, Essex: Prentice Hall.
Jome, L., Donahue, M. & Siegel, L. (2006). Working in the Uncharted Technology Frontier: Characteristics of Women Web Entrepreneurs. Journal of Business and Psychology, 21 (1), pp. 127-147.
Kamberidou, I. (2013). Women entrepreneurs: ‘We cannot have change unless we have men in the room’. Journal of Innovation and Entrepreneurship, 2 (6), pp. 1-17.
Klapper, L. & Parker, S. (2010). Gender and the Business Environment for New Firm Creation. World Bank Research Observer, 26 (2), pp. 237-257.
Lerner, M. & Almor, T. (2002). Relationships among Strategic Capabilities and the Performance of Women-Owned Small Ventures. Journal of Small Business Management, 40 (2), pp. 109-125.
Lituchy, T. & Reavley, M. (2004). Women Entrepreneurs: A Comparison of International Small Business Owners in Poland and the Czech Republic. Journal of International Entrepreneurship, 2 (1-2), pp. 61-87.
Manolova, T., Carter, N., Manev, I. & Gyoshev, B. (2007). The Differential Effect of Men and Women Entrepreneurs’ Human Capital and Networking on Growth Expectancies in Bulgaria. Entrepreneurship Theory and Practice, 31 (3), pp. 407-426.
Ministry of Finance and Economy, Ministry of Regional Development and Local Self-Government, National Agency for Regional Development (2012). Report on Small and Medium Sized Enterprises and Entrepreneurs 2011. Belgrade.
Mueller, S. & Dato-on, M. (2013). A cross-cultural study of gender-role orientation and entrepreneurial self-efficacy. International Entrepreneurship and Management Journal, 9 (1), pp. 1-20.
National Agency for Regional Development (2013). Conditions, Needs and Problems of Small and Medium Enterprises and Entrepreneurs in the Republic of Serbia. Belgrade. (Serbian original: Nacionalna agencija za regionalni razvoj (2013). Istraživanje o stanju, potrebama i problemima malih i srednjih preduzeća i preduzetnika u Srbiji).
National Assembly of the Republic of Serbia (2011). Law on Companies. Official Gazette of the Republic of Serbia, Nos. 36/2011 and 99/2011.
Parker, S. C. (2009). The Economics of Entrepreneurship. Cambridge: Cambridge University Press.
Rietz, A. & Henrekson, M. (2000). Testing the Female Underperforming Hypothesis. Small Business Economics, 14 (1), pp. 1-10.
Robichaud, Y., Zinger, T. & LeBrasseur, R. (2007). Gender differences within early stage and established small enterprises: An exploratory study. International Entrepreneurship and Management Journal, 3 (3), pp. 323-343.
Sarstedt, M. & Mooi, E. (2014). A Concise Guide to Market Research – The Process, Data, and Methods Using IBM SPSS Statistics. Berlin: Springer-Verlag.
Sena, V., Scott, J. & Roper, S. (2012). Gender, borrowing patterns and self-employment: some evidence for England. Small Business Economics, 38 (4), pp. 467-480.
Statistical Office of the Republic of Serbia (2014). Labour Force Survey, 2013. Belgrade.
Verheul, I. & Thurik, R. (2001). Start-Up Capital: ‘‘Does Gender Matter?’’ Small Business Economics, 16 (4), pp. 329-345.
Vossenberg, S. (2013). Women Entrepreneurship Promotion in Developing Countries: What explains the gender gap in entrepreneurship and how to close it? Maastricht School of Management: Working Paper No. 2013/08: 1-29.
Watson, J. (2003). Failure Rates for Female-Controlled Businesses: Are They Any Different? Journal of Small Business Management, 41 (3), pp. 262-277.
Weathington, B., Cunningham, C. & Pittenger, D. (2010). Research Methods for the Behavioral and Social Sciences. Hoboken, New Jersey: John Wiley & Sons.