ACPD
11, 26111–26141, 2011Sources and composition of urban
aerosol particles
M. Vogt et al.
Title Page
Abstract Introduction
Conclusions References
Tables Figures
◭ ◮
◭ ◮
Back Close
Full Screen / Esc
Printer-friendly Version Interactive Discussion
Discussion
P
a
per
|
Dis
cussion
P
a
per
|
Discussion
P
a
per
|
Discussio
n
P
a
per
|
Atmos. Chem. Phys. Discuss., 11, 26111–26141, 2011 www.atmos-chem-phys-discuss.net/11/26111/2011/ doi:10.5194/acpd-11-26111-2011
© Author(s) 2011. CC Attribution 3.0 License.
Atmospheric Chemistry and Physics Discussions
This discussion paper is/has been under review for the journal Atmospheric Chemistry and Physics (ACP). Please refer to the corresponding final paper in ACP if available.
Sources and composition of urban
aerosol particles
M. Vogt1, C. Johansson1,2, M. M ˚artensson1,3, H. Struthers1,4,5, L. Ahlm1, and D. Nilsson1
1
Department of Applied Environmental Science (ITM), Stockholm University, 106 91 Stockholm, Sweden
2
City of Stockholm Environment and Health Administration, Box 8136, 10420 Stockholm, Sweden
3
Department of Earth Sciences, Uppsala University, 752 36 Uppsala, Sweden
4
Department of Meteorology, Stockholm University, 10691 Stockholm, Sweden
5
Bert Bolin Centre for Climate Research, Stockholm University, Stockholm, Sweden
Received: 4 August 2011 – Accepted: 13 September 2011 – Published: 20 September 2011
Correspondence to: M. Vogt (matthias.vogt@itm.su.se)
ACPD
11, 26111–26141, 2011Sources and composition of urban
aerosol particles
M. Vogt et al.
Title Page
Abstract Introduction
Conclusions References
Tables Figures
◭ ◮
◭ ◮
Back Close
Full Screen / Esc
Printer-friendly Version Interactive Discussion
Discussion
P
a
per
|
Dis
cussion
P
a
per
|
Discussion
P
a
per
|
Discussio
n
P
a
per
|
Abstract
From May 2008 to March 2009 aerosol emissions were measured using the eddy co-variance method covering the size range 0.25 to 2.5 µm diameter (Dp) from a 105 m tower, in central Stockholm, Sweden. Supporting chemical aerosol data were collected at roof and street level. Results show that the inorganic fraction of sulfate, nitrate,
5
ammonium and sea salt accounts for approximately 15 % of the total aerosol mass
<1µ mDp(PM1) with water soluble soil contributing 11 % and water insoluble soil 47 %. Carbonaceous compounds were at the most 27 % of PM1mass. It was found that heat-ing the air from the tower to 200 °C resulted in the loss of approximately 60 % of the aerosol volume at 0.25 µmDpwhereas only 40 % of the aerosol volume was removed at
10
0.6 µmDp. Further heating to 300 °C caused very little additional losses<0.6 µmDp. The chemical analysis did not include carbonaceous compounds, but based on the difference between the total mass concentration and the sum of the analyzed non-carbonaceous materials, it can be assumed that the non-volatile particulate material (heated to 300 °C) consists mainly of carbonaceous compounds, including elemental
15
carbon. Furthermore, it was found that the non-volatile particle fraction <0.6 µmDp
correlated (r2=0.4) with the BC concentration at roof level in the city, supporting the assumption that the non-volatile material consists of carbonaceous compounds. The average diurnal cycles of the BC emissions from road traffic (as inferred from the ra-tio of the incremental concentrara-tions of nitrogen oxides (NOx) and BC measured on
20
a densely trafficked street) and the fluxes of non-volatile material at tower level are in close agreement, suggesting a traffic source of BC. We have estimated the emission factors (EFs) for non-volatile particles<0.6 µmDpto be 2.4±1.4 mg veh−1km−1based on either CO2 fluxes or traffic activity data. Light (LDV) and heavy duty vehicle (HDV) EFs were estimated using multiple linear regression and reveal that for non-volatile
25
ACPD
11, 26111–26141, 2011Sources and composition of urban
aerosol particles
M. Vogt et al.
Title Page
Abstract Introduction
Conclusions References
Tables Figures
◭ ◮
◭ ◮
Back Close
Full Screen / Esc
Printer-friendly Version Interactive Discussion
Discussion
P
a
per
|
Dis
cussion
P
a
per
|
Discussion
P
a
per
|
Discussio
n
P
a
per
|
1 Introduction
Aerosols affect both climate and human health and are therefore a focus of research in environmental science. In particular, aerosols affect the Earth’s temperature and climate by changing the radiative properties of the atmosphere. The current best es-timate of the total anthropogenic direct aerosol radiative forcing derived from models
5
and observations is −0.5±W m−2 (IPCC 2007). One of the most important compo-nents of anthropogenic aerosols is BC, which is a primary aerosol emitted from fossil fuel combustion and biomass burning. It efficiently absorbs visible sunlight and there-fore heats the Earth’s atmosphere. The direct radiative forcing from fossil fuel BC is estimated to be+0.2±0.15 W m−2 (IPCC, 2007). In addition, soot deposited on snow
10
and ice can change the surface albedo and cause a change in the surface radiation balance (Hansen and Nazarenko, 2004). Beside its radiative forcing on climate, at-mospheric PM, particularly of anthropogenic origin, has been associated with adverse health effects in humans (e.g., Chow et al., 2006). When considering plausible mech-anisms of toxicity, the prevailing opinion is that the observed health effects are more
15
strongly linked to the physical or chemical properties of PM rather than the PM mass (NRC, 2004). Several studies have attempted to link particle toxicity with aerosol phys-ical and/or chemphys-ical characteristics such as particle size, number concentration and chemical composition. One chemical constituent being studied closely in this regard is BC (e.g., Mar et al., 2000; Peel et al., 2007), particularly given that high
concen-20
trations of BC have been measured in urban areas (Suglia et al., 2008; Krecl et al., 2011). Chemical analysis of measurements taken in urban areas suggests that BC contributes 5–10 % to PM2.5 (Putaud et al., 2004). The reason for this is that in an urban environment, vehicular emissions (fossil fuel combustion) are one of the major sources of PM (Gidhagen et al., 2003). A significant amount of the particles are
emit-25
ACPD
11, 26111–26141, 2011Sources and composition of urban
aerosol particles
M. Vogt et al.
Title Page
Abstract Introduction
Conclusions References
Tables Figures
◭ ◮
◭ ◮
Back Close
Full Screen / Esc
Printer-friendly Version Interactive Discussion
Discussion
P
a
per
|
Dis
cussion
P
a
per
|
Discussion
P
a
per
|
Discussio
n
P
a
per
|
to particle condensation upon cooling in or near the tailpipe, and a non-volatile frac-tion created within the engine in particle form (Sakurai et al., 2003). An open quesfrac-tion remains as whether the non-volatile or semi-volatile material is more toxic. Identifica-tion and quantificaIdentifica-tion of the non-volatile and semi-volatile aerosol load would allow for better targeting of abatement strategies beneficial for public health. One method that
5
can be used to help distinguish sub-fractions of the aerosol is the so called ”volatility method”. In this method, the aerosol is heated in different temperature stages and the number concentration and size of the particles is detected by an Optical Particle Counter (OPC) (O’Dowd and Smith, 1993; Hoppel et al., 1990; Clarke et al., 2004) or other particle sizing instruments like Tandem Differential Mobility Analyzers (TDMA)
10
(e.g., Kuhn et al., 2005; Sakurai et al., 2003; Orsini et al., 1999) or Aerosol Time-Of-Flight Mass Spectrometers (ATOFMS) (Pratt and Prather, 2009). This technique can be used to gain an indirect insight into the main characteristics of aerosol composition. In this paper, we combine volatility measurements with the eddy covariance method not only to gain an insight on aerosol chemistry but also of particle sources and sinks. This
15
paper is the fourth contribution based on a data set measured between 2008 and 2009 in Stockholm, Sweden. Earlier publications characterized the seasonal and diurnal variations of particle fluxes (Vogt et al., 2011a), the relationship between aerosol and CO2 emissions and quantification of emission factors (Vogt et al., 2011b), and emis-sion velocities (Vogt et al., 2011c). This paper addresses the volatile and refractory
20
(non-volatile) fractions of the observed urban aerosol emissions.
2 Measurement description
2.1 Sampling sites
We make use of data measured at three sites in central Stockholm, in a street canyon (Hornsgatan), on a roof top representing the urban background/roof top (Torkel
25
ACPD
11, 26111–26141, 2011Sources and composition of urban
aerosol particles
M. Vogt et al.
Title Page
Abstract Introduction
Conclusions References
Tables Figures
◭ ◮
◭ ◮
Back Close
Full Screen / Esc
Printer-friendly Version Interactive Discussion
Discussion
P
a
per
|
Dis
cussion
P
a
per
|
Discussion
P
a
per
|
Discussio
n
P
a
per
|
is a four-lane 24 m wide street-canyon with 24 m high buildings on both sides, and an average traffic volume of 35,000 vehicles per day. The site at Hornsgatan has been described in several earlier papers (Gidhagen et al., 2003; Johansson, 2009; Omstedt et al., 2005; Ketzel et al., 2007; Olivares et al., 2008; Krecl et al., 2011). The instru-ments at Torkel Knutssonsgatan are located on a rooftop platform (25 m above street
5
level) and therefore represents urban background concentrations for the Stockholm region (described previously by Johansson, 2009). The measurements made at Kalm-gatan were from the top of a telecommunications tower in the southern central part of the city. The tower is of concrete construction, 90 m tall and located 28 m above the sea level. Based on an elevated platform, the measurements were made 105 m above the
10
surrounding ground. The tower is located just south of Hammarby Fabriksv ¨ag, a local road supporting around 9,700 vehicles per day. This road connects to S ¨odra L ¨anken, a heavily trafficked underground freeway tunnel, supporting around 50 000 vehicles per day, with one exit located to the Northeast of the tower (Figure 1). The site has been previously described by M ˚artensson et al. (2006) and Vogt et al. (2011a,b,c).
15
2.2 Instruments and measurement setup
2.2.1 Chemical PM1sampling and BC analysis at the street canyon and roof-top sites
Identical aethalometers series 8100 (Magee Scientific, USA) were used to obtain BC concentrations on Hornsgatan (3.5 m above ground in the street canyon) and Torkel
20
Knutssonsgatan (roof top). These instruments were operated with PM2.5sample inlets and a sample flow rate of 2 L min−1. 15-min average values were logged by the ac-quisition system. Aethalometer concentrations were computed using the mass specific attenuation cross section provided by the manufacturer (16.6 m2g−1). More details can
be found in Krecl et al. (2007, 2011). At the same sites concentrations of NOx were
25
ACPD
11, 26111–26141, 2011Sources and composition of urban
aerosol particles
M. Vogt et al.
Title Page
Abstract Introduction
Conclusions References
Tables Figures
◭ ◮
◭ ◮
Back Close
Full Screen / Esc
Printer-friendly Version Interactive Discussion
Discussion
P
a
per
|
Dis
cussion
P
a
per
|
Discussion
P
a
per
|
Discussio
n
P
a
per
|
was made on a 24 h basis changing at midnight. Six auto-changers were used at each site with each auto-changer being connected to eight sampling heads with a flow rate of 18 L min−1. Sampling heads for particles <1 µmDp (PM1) were made of poly-oximethylene and had a greased impactor to remove particles larger than 1 µmDp. The aerosol filter samples were analyzed for 39 elements using Mass Spectrometry
(ICP-5
MS) (Perkin-Elmer Sciex Elan 6000) and water soluble compounds (Ca2+, Mg2+, K+, Na+, Cl−, NH+4, SO24−, NO3−) using ion chromatography (IC). More details about filter preparation, extraction, chemical analysis and the setup can be found in S ¨odin et al. (2009).
2.2.2 Aerosol concentration, volatility and fluxes of refractory particles and CO2
10
at the tower site
The instrumentation in the tower (Kalmgatan) consists of a Gill R3 ultrasonic anemome-ter, an open path infrared CO2/ H2O analyzer LI-COR 7500 (LI-COR, Inc., Lincoln, Ne-braska 68504, USA), and two identical OPCs (Model, 1.109, Grimm Ainring, Bayern, Germany). All instruments were placed inside a housing with the sampling point 105 m
15
above the ground. In order to sample data from the 1.109 OPC at the maximum rate of 1 Hz we could only sample either the 15 smallest (0.25–2.5 µmDp) or 15 largest (2.5 to 32 µmDp) size channels of the OPC. In this study we have operated both OPCs at (for 0.25 to 2.5 µmDp). The OPCs were equipped with a system to heat the inlet air (Grimm Model 265, special version up to 300 °C). The sampled air was dried by 1:1 dilution with
20
close to 0 % humidity particle free air (detailed information can be found in Vogt et al. (2011a). Figure 2 illustrates the setup of the instrumentation. The heater efficiency of the commercial Grimm Model 265 was tested with Ammonium sulfate particles where it was found that the heater effectively removed all particles at temperatures of 300 °C, even for particle number concentrations as high as approximately 10 000 particles cm3.
25
ACPD
11, 26111–26141, 2011Sources and composition of urban
aerosol particles
M. Vogt et al.
Title Page
Abstract Introduction
Conclusions References
Tables Figures
◭ ◮
◭ ◮
Back Close
Full Screen / Esc
Printer-friendly Version Interactive Discussion
Discussion
P
a
per
|
Dis
cussion
P
a
per
|
Discussion
P
a
per
|
Discussio
n
P
a
per
|
in parallel with the heated lines. The aerosol in air heated to 200 °C was measured in May and July 2008, and the 300 °C data originates from May 2008 to February 2009 (with the exception of August 2008).
2.3 Eddy covariance fluxes, corrections and errors
The turbulent vertical aerosol number flux at the Kalmgatan tower was calculated
us-5
ing the eddy covariance technique. The eddy covariance (EC) technique allows us to obtain integral measurements of the amount of particles emitted from a footprint cover-ing a relatively large urban area (approximately one square kilometer). For this study, the fluxw′c′ was calculated over periods of 30 min. The fluctuationsw′ and c′ were separated from the mean by linear de-trending, which also removes the influence of
10
low frequency trends. The validity of the EC technique at the Kalmgatan measurement location has been confirmed in earlier studies M ˚artensson et al. (2006); Vogt et al. (2011a,b), where it was also shown, using turbulent spectra, that the measurements are within the surface boundary layer during daytime. The fluxes have been corrected for the limited time response of the sensor and attenuation of turbulent fluctuations in
15
the sampling line. The response time constantτ for the OPC instrument in combina-tion with the lag of air in the and sampling line was estimated to be 1.0 s using transfer equations for damping of particle fluctuations in laminar flow (Lenschow and Raupach, 1991) and in a sensor (Horst, 1997). The typical magnitude of these corrections varied, with the uncorrected aerosol fluxes being between 12 to 32 % less for the unheated
20
cases and between 17 to 35 % less for periods when the aerosol was heated. The variations can be attributed to differences in wind speed and stability conditions. The aerosol fluxes and concentrations were also corrected for particle losses to the walls in the sampling line, which resulted in particle losses of 5 % for the largest size class in the OPC (2 to 2.5 µmDp), and much less in the smaller sizes. Counting errors are
25
ACPD
11, 26111–26141, 2011Sources and composition of urban
aerosol particles
M. Vogt et al.
Title Page
Abstract Introduction
Conclusions References
Tables Figures
◭ ◮
◭ ◮
Back Close
Full Screen / Esc
Printer-friendly Version Interactive Discussion
Discussion
P
a
per
|
Dis
cussion
P
a
per
|
Discussion
P
a
per
|
Discussio
n
P
a
per
|
smallest and largest OPC sizes with a peak of 35 % for 0.7 µmDp(Vogt et al., 2011a). In this study, the relative counting error for the integrated airborne particulate number flux less than 0.6 µmDp (PM0.6) was estimated to be 5 % for the unheated case, 12 %
when the aerosol was heated to 200 °C and 9.5 % when the aerosol was heated to 300 °C. The measured CO2 flux was corrected for variations in air density due to
fluc-5
tuations in water vapor and heat fluxes in accordance with Webb et al. (1980). This resulted in a maximum correction around noon for CO2flux of 37 %. For more details see Vogt et al. (2011a).
2.4 Emission factors based on the NOxscaling method
As described previously, BC and NOx concentrations were measured simultaneously
10
in the street canyon and at roof-top. The ratio of the concentration difference between street and roof-top can be used as a measure of the emissions due to the road traffic on the street (e.g., Ketzel et al., 2003). If the emission factor for NOxis known, the emis-sion factor of BC can be estimated by multiplying the NOxemission factor with the ratio of the BC / NOx concentration increment. This method assumes that the dispersion of
15
the emitted particles is similar to NOx dispersion. This is justified by the fact that the timescale for deposition of particles is several hours, much longer than the timescale for mixing and dilution, which makes it reasonable to assume that differences in depo-sition of NOxand particles have a minor influence. This method has been successfully used in several earlier studies in Stockholm and elsewhere (e.g., Ketzel et al., 2003;
20
Gidhagen et al., 2004a,b; Omstedt et al., 2005).
2.5 Traffic statistics
The traffic statistics were obtained using a grid resolved database of hourly traffic activ-ity expressed as vehicle-kilometers per time unit. This database is part of a regional air quality management system operated by the local environmental authority in the city of
25
ACPD
11, 26111–26141, 2011Sources and composition of urban
aerosol particles
M. Vogt et al.
Title Page
Abstract Introduction
Conclusions References
Tables Figures
◭ ◮
◭ ◮
Back Close
Full Screen / Esc
Printer-friendly Version Interactive Discussion
Discussion
P
a
per
|
Dis
cussion
P
a
per
|
Discussion
P
a
per
|
Discussio
n
P
a
per
|
and Uppsala.
3 Results and discussion
3.1 OPC instrument inter-comparison and data coverage
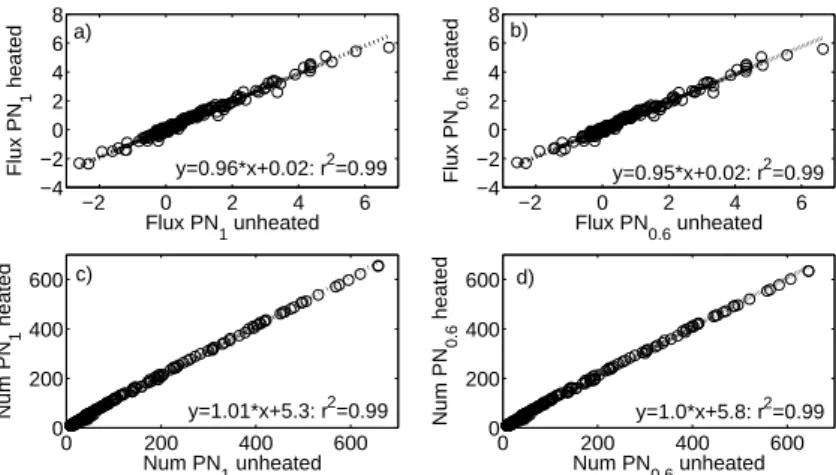
For the period between 4 and 8 April 2009, we compared measurements from the two OPC instruments when both were sampling unheated air. Figure 3 shows the
inter-5
comparison of the number fluxes and concentrations for airborne particulate matter less than 0.6 and 1 µmDp, which corresponds to the smallest 7 and 11 size channels of the OPCs, respectively.
The comparison of the individual instrument size classes show good correlations up to size channel 13 (1.6 µmDp) which gives us confidence in applying the volatility
10
method in the subsequent analysis of the heated data.
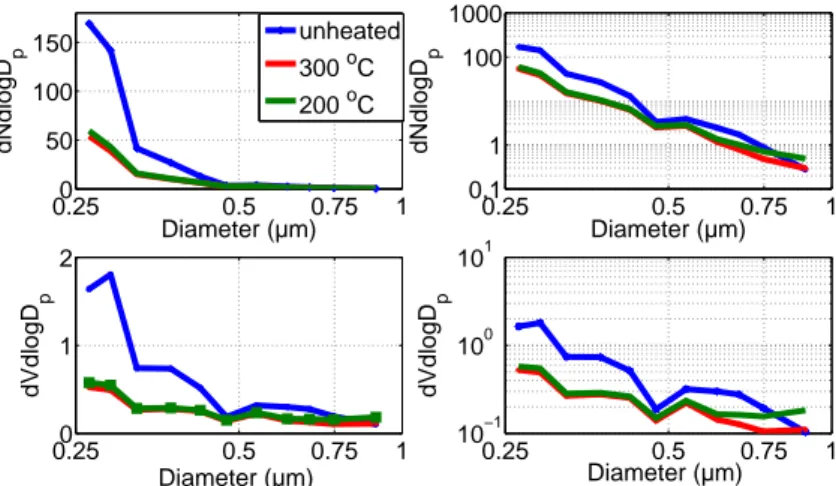
3.2 Median concentration size distributions
The median aerosol number and volume distributions for the 3 different temperatures (unheated, 200 and 300 °C) are shown in Fig. 4.
The data were selected for the Northern sector (from 270 ° to 90 °) which is
domi-15
nated by urban traffic sources (Vogt et al., 2011a,b). The median number concentration (upper and lower quartile) within the OPC size range used in this study (from 0.25 to 1 µmDp) was 43 cm3 (24.4, 60.3) for the unheated OPC, 15.4 cm3 (12.9, 21.5) when the incoming air was heated to 200 °C, and 14.3 cm3 (11.9, 19.6) when the incoming air was heated to 300 °C. A rapid decrease in number concentration with increasing
20
ACPD
11, 26111–26141, 2011Sources and composition of urban
aerosol particles
M. Vogt et al.
Title Page
Abstract Introduction
Conclusions References
Tables Figures
◭ ◮
◭ ◮
Back Close
Full Screen / Esc
Printer-friendly Version Interactive Discussion
Discussion
P
a
per
|
Dis
cussion
P
a
per
|
Discussion
P
a
per
|
Discussio
n
P
a
per
|
in air heated to 200 °C and 300 °C were not simultaneous (see Table 1), so one should be careful regarding conclusions based on the difference between the aerosol distri-butions at these two temperatures. The largest differences in the aerosol size spectra seen in Fig. 4a, b are not between the 200 and 300 °C spectra, but between these and the unheated size spectra. In addition, a comparison of the unheated aerosol size
5
distributions for the two time periods when the 200 and 300 °C measurements were made showed no significant difference in the shape or concentration. Nonetheless, the fact that the sampling with heated air at 200 and 300 °C were not made at the same time may have had an impact on the chemical composition of the particles. The 300 °C measurements include periods from the autumn and winter, when the fraction of
10
non-volatile material may have been different compared to May and July (air heated to 200 °C). This effect was not considered in this study and so conclusions based on the difference between 200 °C and 300 °C measurements must be treated with some cau-tion. Iin Fig. 5 the ratios of the volume concentration distributions for different tempera-tures are plotted, which highlights in which size channels shrinking and/or evaporation
15
of particles takes place and emphasizes the differences seen in Fig. 4.
The ratio of the aerosol remaining after heating to 200 °C, ranges from 0.37 for par-ticles sizes of 0.25 µmDpto 0.8 for particles sizes of 0.75 µmDpwith a local maximum near 0.5 µmDp. For particles larger than 0.75 µmDp, the ratio is above 1 which means that larger particle volumes are present in this size bin after heating. It appears that
20
for a temperature step of 200 °C, up to 60 % of the aerosol volume disappears for the smallest sizes (<0.25 µmDp), which means that either the particles shrank to a smaller size, below the lower size cut of the OPC, or were completely volatilized, or a combi-nation of both effects (the first case corresponding to an internally mixed aerosol, the latter to an aerosol that is mainly externally mixed). For an incremental change in our
25
ACPD
11, 26111–26141, 2011Sources and composition of urban
aerosol particles
M. Vogt et al.
Title Page
Abstract Introduction
Conclusions References
Tables Figures
◭ ◮
◭ ◮
Back Close
Full Screen / Esc
Printer-friendly Version Interactive Discussion
Discussion
P
a
per
|
Dis
cussion
P
a
per
|
Discussion
P
a
per
|
Discussio
n
P
a
per
|
lost at temperatures below 200 °C. Several volatility studies have determined specific evaporation temperature ranges for organic matter and inorganic matter (Pinnick et al., 1987; O’Dowd et al., 1997). Critical temperatures for important semi-volatile chemical compounds (H2SO4 and the more volatile organic compounds) lie between 80 °C and 120 °C. Semi-volatile organics and ammonium sulfate and bisulfate have critical
tem-5
perature ranges around 180–240 °C. Above 300 °C the refractory part of the aerosol consists of elemental carbon, dust, metals, and sea salt. For urban aerosols, many studies have shown that particles smaller than 0.1 µmDpare typically externally-mixed (Sakurai et al., 2003; Kittelson et al., 2004). The larger diameter (>0.2 µm) particles are usually more aged and therefore internal mixtures of organic and inorganic
com-10
pounds are more common (e.g., Alfarra et al., 2004; Zhang et al., 2004, 2007; Bein et al., 2005)
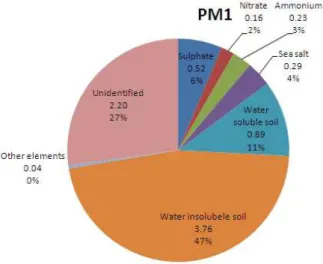
3.3 Chemical composition
The chemical composition of PM1samples was investigated in order to assist in the in-terpretation of the observed heated aerosol population from the tower measurements.
15
The PM1concentration measured at the roof-top site (Torkel Knutssonsgatan) was on average 8.1 µgm−3. The largest contribution to the total PM1 mass was attributed to 46.5 % water insoluble soil elements (mainly oxides of Fe, Al, Ca, Si and K), see Fig. 6. Water soluble soil elements (Mg, Ca, Fe, Al) account for 11 % of the total PM1mass, sulfate for 6.4 %, sea salt 3.6 %, ammonium 2.8 %, nitrate 1.9 %, and the remaining
20
0.4 % comprised of other analysed elements. The carbonaceous compounds (EC, OC) were not explicitly measured, but are expected to constitute a large fraction of unidentified particulate material (27 %). Zhang et al. (2007) showed that inorganic components (mostly sulfate, nitrate and ammonium) and a large variety of organic species dominated the mass of fine particulate material measured in cities (e.g
Edin-25
ACPD
11, 26111–26141, 2011Sources and composition of urban
aerosol particles
M. Vogt et al.
Title Page
Abstract Introduction
Conclusions References
Tables Figures
◭ ◮
◭ ◮
Back Close
Full Screen / Esc
Printer-friendly Version Interactive Discussion
Discussion
P
a
per
|
Dis
cussion
P
a
per
|
Discussion
P
a
per
|
Discussio
n
P
a
per
|
period were 0.67 µgm−3 (0.53, 0.89 µgm−3) for the rooftop site. Most of this BC
con-centration is due to elemental carbon (EC) as shown by comparison with EC analysis based on thermo-optical carbon analysis (for details see Krecl et al. (2011)). This BC corresponds to 30 % of the missing mass, the remaining 1.5 µgm−3 being attributed
to organic carbon. In order to better understand in which particle size range the BC
5
mass was most frequently observed, we correlated the BC mass against particle num-ber concentrations in different size classes as measured by the OPC at Hornsgatan. Figure 7 shows the correlation coefficients for BC mass against number concentra-tions for individual size bins between 0.25 and 1 µmDp. With increasing diameter the correlation coefficient decreases. A clear drop in the correlation coefficient can be
10
seen for size classes larger than 0.6 µmDp. A similar correlation was seen in Augs-burg, Germany where the refractive core (heated to 300 °C) of the aerosol in the size range of <0.80 µmDp was compared to BC mass (Birmili et al., 2010). Krecl et al. (2011) showed that the BC concentration at sites dominated by traffic emissions (in-cluding Hornsgatan) is highly correlated with NOx, which can be considered a tracer
15
of traffic exhaust. These results suggest that the BC and refractive particles in the size range<0.6 µmDpmainly originate from traffic exhaust. We have also studied the correlation coefficients between the heated, number size distributions from the tower measurements and the black carbon mass from the roof measurements. The correla-tion coefficients obtained are less to those obtained when comparing BC and number
20
concentrations at the street site (r2=0.27, r2=0.43 for tower and street respectively). This suggests that the association between BC and the number concentration in the size range<0.6 µmDpfound at roof level survives the vertical transport and applies to the tower level as well.
3.4 Emission factors
25
ACPD
11, 26111–26141, 2011Sources and composition of urban
aerosol particles
M. Vogt et al.
Title Page
Abstract Introduction
Conclusions References
Tables Figures
◭ ◮
◭ ◮
Back Close
Full Screen / Esc
Printer-friendly Version Interactive Discussion
Discussion
P
a
per
|
Dis
cussion
P
a
per
|
Discussion
P
a
per
|
Discussio
n
P
a
per
|
Mass emission factors (EF) for the heated aerosol (heated to 300 °C) in the size range of 0.25 to 0.6 µmDp (hereafter referred to as RPM0.6) were derived using the same approach as Vogt et al. (2011b), i.e. using the CO2flux as a tracer of road traffic fossil fuel combustion. A linear fit between particle number flux and CO2flux was used to determine an emission factor (simply the slope of the linear fit) in units of particles
5
mmol−1CO2. Only the most traffic intense Northeastern sector (0–90 °) was included in the analysis to minimize the effect of other (non-traffic) sources of both CO2 and particles (see Vogt et al. (2011b)). By assuming a particle density of 1600 kg m−3 Pitz et al. (2003) and using the particle sizes from the OPC, mass related emission factors can be calculated. The density of 1600 kg m−3was retained in this study so the
10
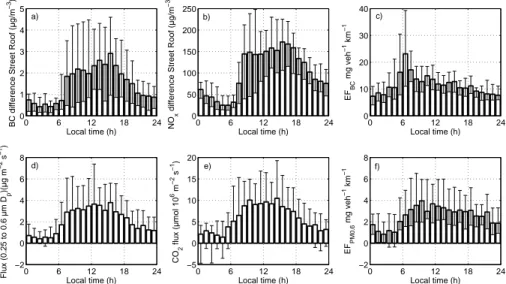
emission factors for RPM0.6are consistent with the EFs from Vogt et al. (2011b). BC emission factors (EFBC) at Hornsgatan have also been calculated using the NOx scaling method (as described in the methods section above). Figures 8a–c show the diurnal variations of the concentration of BC, NOx, and the derived EFBC based on the NOx scaling method. Figure 8d–f show the fluxes of particle mass, CO2 and the
15
mass emission factor for RPM0.6(EF0.6from the tower (based on the eddy correlation technique). The diurnal cycle of BC concentration spans from 0.5 µgm−3during night to around 3 µgm−3in the late afternoon. The diurnal pattern is similar for NO
x, with low
values of about 35 µgm−3 found in the early morning and high values in the late after-noon of around 170 µgm−3. These diurnal patterns are consistent with traffic activity
20
pattern observed at Hornsgatan by Krecl et al. (2011), who found a correlation coeffi -cient of 0.78 between BC and NOx. The heated particle number flux (0.25 to 0.6 µmDp) shows a broad peak between 07:00 LT to 19:00 LT. The source strength varies be-tween 2×10⁴particles m−2s−1at night to about 12
×105particles m−2s−1around noon. The diurnal cycle of CO2 flux is similar to particle flux with the highest emission of
25
11 µmol m−2s−1 in early afternoon and lowest emission during night (2 µmolm−2s−1) (Fig. 8d, e).
The calculated emission factors for BC at Hornsgatan range from 8 mg veh−1km−1
ACPD
11, 26111–26141, 2011Sources and composition of urban
aerosol particles
M. Vogt et al.
Title Page
Abstract Introduction
Conclusions References
Tables Figures
◭ ◮
◭ ◮
Back Close
Full Screen / Esc
Printer-friendly Version Interactive Discussion
Discussion
P
a
per
|
Dis
cussion
P
a
per
|
Discussion
P
a
per
|
Discussio
n
P
a
per
|
tower measurements range from 1 mg veh−1km−1 to approximately 4 mg veh−1km−1.
Interestingly, no clear morning rush hour peak is observed from the tower measure-ments. This diurnal EF pattern is consistent with the diurnal pattern of heavy duty traffic, which has been seen before in the earlier analysis of the continuous measure-ments with unheated air (Vogt et al., 2011b). The average mass emission factors for
5
the RPM0.6 were found to be 2.4±1.4 mg veh−1km−1 based on CO2 emissions and
2.5±1.4 mg veh−1km−1(see Table 2) based on traffic counts. For comparison, the me-dian BC emission factor for Hornsgatan is 11.1 mg veh−1km−1(4.3, 19.7). The higher emission factor for BC compared to RPM0.6 is likely due to the fact that Hornsgatan is representative for very high emissions at a single location, whilst the EF obtained
10
by the flux measurements represents the average of a larger area with more modest emissions. The BC emission factor is within the range of the values reported in the literature (Olivares et al., 2008; Imhof et al., 2005). There are no previously reported emission factors for RPM0.6.
In previous studies combining aerosol fluxes with traffic statistics (M ˚artensson et al.,
15
2006; Vogt et al., 2011b) we have been able to derive separate emission factors for heavy and light duty traffic. For the total particle numberDp>10 nm, M ˚artensson et al. (2006) found that the heavy duty traffic dominate the emissions. Vogt et al. (2011b) found for particles in the range 0.8 to 2.5 µmDp that mass EFs for HDV are 30 times larger than for LDV, indicating that trucks and buses more efficiently resuspending
su-20
permicron road dust.
However, for the RPM0.6 in the 0.25 to 0.6 µmDp size range, the HDV EF is only about twice as high as the LDV EF, and the uncertainties are so large that the dif-ference is not significant. The LDV EF derived from the multiple linear regression is approximately the same as the overall EF from ordinary linear regression. This
indi-25
ACPD
11, 26111–26141, 2011Sources and composition of urban
aerosol particles
M. Vogt et al.
Title Page
Abstract Introduction
Conclusions References
Tables Figures
◭ ◮
◭ ◮
Back Close
Full Screen / Esc
Printer-friendly Version Interactive Discussion
Discussion
P
a
per
|
Dis
cussion
P
a
per
|
Discussion
P
a
per
|
Discussio
n
P
a
per
|
4 Conclusions
Size-resolved, vertical aerosol number fluxes of particles betwenn 0.25 and 1.0 µmDp
were measured with the eddy covariance method from a 105 meter high tower over an urban site in central Stockholm, Sweden. The OPCs, which were used to determine the particle fluxes, were equipped with a system to heat the sampled air. When the air was
5
heated to 200 or 300 °C, a considerable fraction of the aerosol concentration was lost. Up to 200 °C, approximately 60 % of the aerosol volume was lost for the smallest OPC size classes (0.25 µmDp) whilst only 20 % of the particle volume is lost for particles sizes of 0.75 µmDp. Further heating from 200 to 300 °C appears to have caused very little additional losses up to 0.6 µmDp. For larger sizes between 0.6 and 1 µmDp the
10
volume ratios start to decrease indicating losses of less semi-volatile compounds. Chemical analysis showed that the inorganic fraction of sulfate, nitrate, ammonium and sea salt only accounts for approximately 15 % of the PM1total mass, water soluble soil 11 % whilst the largest mass fraction was attributed to water insoluble soil (46.5 %). Carbonaceous compounds were at the most about one quarter of the mass. Of the
15
missing mass, BC could explain about 30 % the rest likely being organic compounds. The BC concentration at roof level and the refractory aerosol number at tower level (at 300 °C) for the size range below 0.6 µmDp was observed to be correlated (r2=0.27). In addition, the average diurnal cycles of the BC emission at a street in central Stock-holm and the refractory (RPM0.6) aerosol fluxes at tower level show distinct and similar
20
diurnal variations, indicating a traffic origin. We have estimated the emission factors for the refractory aerosol below 0.6 µmDp using the aerosol fluxes, both via the CO2 flux method and using traffic statistics. Both methods result in an EF of approximately 2.4±1.4 mg veh−1km−1.
It is clear from this study that the combination of eddy covariance and volatility
mea-25
ACPD
11, 26111–26141, 2011Sources and composition of urban
aerosol particles
M. Vogt et al.
Title Page
Abstract Introduction
Conclusions References
Tables Figures
◭ ◮
◭ ◮
Back Close
Full Screen / Esc
Printer-friendly Version Interactive Discussion
Discussion
P
a
per
|
Dis
cussion
P
a
per
|
Discussion
P
a
per
|
Discussio
n
P
a
per
|
scale using the relaxed eddy accumulation method. Information on the emissions of different chemical compounds would yield valuable information on the contribution of different sources. Furthermore, it would also be of great value if size resolved aerosol flux measurements could be made in the size range below 0.25 µmDp, where the ma-jority of the aerosol number is emitted (M ˚artensson et al., 2006). While it is evident
5
that continuous measurements for a full annual cycle has provided very valuable infor-mation on changes in emissions over different seasons, these type of measurements must be maintained for several years if we are to be able to follow changes in emissions due to changes in vehicle population, fuel usage, engine technology, mitigation of air quality by restrictions on traffic such as restrictions against studded tires or traffic tolls,
10
changes in economy or climate changes.
Acknowledgements. We would like to thank the Swedish Research Council for Environment,
Agricultural Science and Spatial Planning (FORMAS) (the TEA project, Traffic Emissions of
Aerosols) and the Swedish Research Council (VR) for supporting this project. We also ac-knowledge Leif B ¨acklin and Kai Rosman for technical assistance and Peter Tunved for helpful
15
discussions. We also like to thank Telia Sonera for use of the communication tower.
References
Alfarra, M. R., Coe, H., Allan, J. D., Bower, K. N., Boudries, H., Canagaratna, M. R., Jimenez, J. L., Jayne, J. T., Garforth, A. A., Li, S.-M., and Worsnop, D. R.: Char-acterization of urban and rural organic particulate in the Lower Fraser Valley using
20
two Aerodyne Aerosol Mass Spectrometers, Atmospheric Environment, 38, 5745–5758, doi:10.1016/j.atmosenv.2004.01.054, 2004. 26121
Bein, K., Zhao, Y., Wexler, A., and Johnston, M.: Speciation of size-resolved individual ultrafine particles in Pittsburgh, Pennsylvania, J. Geophys. Res.-Atmos., 110, D07S05, doi:10.1029/2004JD004708, 2005. 26121
25
ACPD
11, 26111–26141, 2011Sources and composition of urban
aerosol particles
M. Vogt et al.
Title Page
Abstract Introduction
Conclusions References
Tables Figures
◭ ◮
◭ ◮
Back Close
Full Screen / Esc
Printer-friendly Version Interactive Discussion
Discussion
P
a
per
|
Dis
cussion
P
a
per
|
Discussion
P
a
per
|
Discussio
n
P
a
per
|
Chow, J. C., Watson, J. G., Mauderly, J. L., Costa, D. L., Wyzga, R. E., Vedal, S., Hidy, G. M.,
Altshuler, S. L., Marrack, D., Heuss, J. M., Wolff, G. T., Pope, III, C. A., and Dockery, D. W.:
Health effects of fine particulate air pollution: Lines that connect, J. Air Waste Manage.
Assoc., 56, 1368–1380, 2006. 26113
Clarke, A., Shinozuka, Y., Kapustin, V., Howell, S., Huebert, B., Doherty, S., Anderson, T.,
5
Covert, D., Anderson, J., Hua, X., Moore, K., McNaughton, C., Carmichael, G., and We-ber, R.: Size distributions and mixtures of dust and black carbon aerosol in Asian out-flow: Physiochemistry and optical properties, J. Geophys. Res.-Atmos., 109, D15S09, doi:10.1029/2003JD004378, 2004. 26114
Gidhagen, L., Johansson, C., Str ¨om, J., Kristensson, A., Swietlicki, E., Pirjola, L., and Hansson,
10
H. C.: Model simulation of ultrafine particles inside a road tunnel, Atmos. Environ., 37, 2023– 2036, doi:10.1016/S1352-2310(03)00124-9, 2003. 26113, 26115
Gidhagen, L., Johansson, C., Langner, J., and Olivares, G.: Simulation of NOx and
ultra-fine particles in a street canyon in Stockholm, Sweden, Atmos. Environ., 38, 2029–2044, doi:10.1016/j.atmosenv.2004.02.014, 2004a. 26115, 26118
15
Gidhagen, L., Johansson, C., Omstedt, G., Langner, J., and Olivares, G.: Model simulations of NOx and ultrafine particles close to a Swedish highway, Environ. Sci. Technol., 38, 6730– 6740, doi:10.1021/es0498134, 2004b. 26118
Hansen, J. and Nazarenko, L.: Soot climate forcing via snow and ice albedos, Proc. Natl. Acad. Sci. USA, 101, 423–428, doi:10.1073/pnas.2237157100, 2004. 26113
20
Hoppel, W., Fitzgerald, J., Frick, G., Larson, R., and Mack, E.: Aerosol Size Distributions And Optical-Properties Found In The Marine Boundary-Layer Over The Atlantic-Ocean, J. Geophys. Res.-Atmos., 95, 3659–3686, doi:10.1029/JD095iD04p03659, 1990. 26114 Horst, T.: A simple formula for attenuation of eddy fluxes measured with first-order-response
scalar sensors, Bound.-Lay. Meteorol., 82, 219–233, doi:10.1023/A:1000229130034, 1997.
25
26117
Imhof, D., Weingartner, E., Ordonez, C., Gehrigt, R., Hill, N., Buchmann, B., and Baltensperger,
U.: Real-world emission factors of fine and ultrafine aerosol particles for different traffic
situ-ations in Switzerland, Environ. Sci. Technol., 39, 8341–8350, doi:10.1021/es048925s, 2005. 26124
30
Johansson, C., Burman, L., and Forsberg, B.: The effects of congestions tax on air quality and
health, Atmos. Environ., 43, 4843–4854, 2009. 26115
ACPD
11, 26111–26141, 2011Sources and composition of urban
aerosol particles
M. Vogt et al.
Title Page
Abstract Introduction
Conclusions References
Tables Figures
◭ ◮
◭ ◮
Back Close
Full Screen / Esc
Printer-friendly Version Interactive Discussion
Discussion
P
a
per
|
Dis
cussion
P
a
per
|
Discussion
P
a
per
|
Discussio
n
P
a
per
|
under urban driving conditions in Copenhagen based on street and roof-level observations, Atmos. Environ., 37, 2735–2749, doi:10.1016/S1352-2310(03)00245-0, 2003. 26118 Ketzel, M., Omstedt, G., Johansson, C., Duering, I., Pohjolar, M., Oettl, D., Gidhagen, L.,
Wahlin, P., Lohmeyer, A., Haakana, M., and Berkowicz, R.: Estimation and validation of
PM2.5/PM10exhaust and non-exhaust emission factors for practical street pollution modelling,
5
Atmos. Environ., 41, 9370–9385, doi:10.1016/j.atmosenv.2007.09.005, 2007. 26115 Kittelson, D. B., Watts, W. F., Johnson, J. P., Remerowki, M. L., Ische, E. E., Oberdrster, G.,
Gelein, R. M., Elder, A., Hopke, P. K., Kim, E., and et al.: On-road exposure to highway aerosols. 1. Aerosol and gas measurements., Inhalation Toxicology, 16 Suppl. 1, 31–39, 2004. 26121
10
Krecl, P., Targino, A. C., and Johansson, C.: Spatiotemporal distribution of light-absorbing carbon and its relationship to other atmospheric pollutants in Stockholm, Atmos. Chem. Phys. Discuss., 11, 13279–13316, doi:10.5194/acpd-11-13279-2011, 2011. 26113, 26115, 26122, 26123
Krecl, P., Stroem, J., and Johansson, C.: Carbon content of atmospheric aerosols in a
residen-15
tial area during the wood combustion season in Sweden, Atmos. Environ., 41, 6974–6985, doi:10.1016/j.atmosenv.2007.06.025, 2007. 26115
Kuhn, T., Biswas, S., and Sioutas, C.: Diurnal and seasonal characteristics of particle volatility and chemical composition in the vicinity of a light-duty vehicle freeway, Atmos. Environ., 39, 7154–7166, doi:10.1016/j.atmosenv.2005.08.025, 2005. 26114
20
Lenschow, D. and Raupach, M.: The attenuation of fluctuations in scalar concentrations through sampling tubes , J. Geophys. Res.-Atmos., 96, 15259–15268, doi:10.1029/91JD01437, 1991. 26117
Mar, T. F., Norris, G. A., Koenig, J. Q., and Larson, T. V.: Associations between Air Pol-lution and Mortality in Phoenix, 1995-1997, Environ. Health Perspect., 108, 347–353,
25
doi:10.1289/ehp.00108347, 2000. 26113
M ˚artensson, E. M., Nilsson, E. D., Buzorius, G., and Johansson, C.: Eddy covariance
measure-ments and parameterisation of traffic related particle emissions in an urban environment,
At-mos. Chem. Phys., 6, 769–785, doi:10.5194/acp-6-769-2006, 2006. 26115, 26117, 26124, 26126
30
ACPD
11, 26111–26141, 2011Sources and composition of urban
aerosol particles
M. Vogt et al.
Title Page
Abstract Introduction
Conclusions References
Tables Figures
◭ ◮
◭ ◮
Back Close
Full Screen / Esc
Printer-friendly Version Interactive Discussion
Discussion
P
a
per
|
Dis
cussion
P
a
per
|
Discussion
P
a
per
|
Discussio
n
P
a
per
|
O’Dowd, C. and Smith, M.: Physicochemical Properties Of Aerosols Over The Northeast At-lantic – Evidence For Wind-Speed-Related Submicron Sea-Salt Aerosol Production, J. Geo-phys. Res.-Atmos., 98, 1137–1149, doi:10.1029/92JD02302, 1993. 26114
O’Dowd, C. D., Smith, M. H., Consterdine, I. E., and Lowe, J. A.: Marine aerosol, sea-salt, and the marine sulphur cycle: a short review, Atmos. Environ., 31, 73–80,
doi:10.1016/S1352-5
2310(96)00106-9, 1997. 26121
Olivares, G., Strom, J., Johansson, C., and Gidhagen, L.: Estimates of black carbon and size-resolved particle number emission factors from residential wood burning based on ambient monitoring and model simulations, J. Air Waste Manage. Assoc., 58, 838–848, doi:10.3155/1047-3289.58.6.838, 2008. 26115, 26124
10
Omstedt, G., Bringfelt, B., and Johansson, C.: A model for vehicle-induced
non-tailpipe emissions of particles along Swedish roads, Atmos. Environ., 39, 6088–6097, doi:10.1016/j.atmosenv.2005.06.037, 2005. 26115, 26118
Orsini, D. A., Wiedensohler, A., and Stratmann, F.: A New Volatility Tandem Differential Mobility
Analyzer to Measure the Volatile Sulfuric Acid Aerosol Fraction, Journal of Atmospheric and
15
Oceanic Technology, 16, 1999. 26114
Peel, J. L., Metzger, K. B., Klein, M., Flanders, W. D., Mulholland, J. A., and Tolbert, P. E.: Am-bient Air Pollution and Cardiovascular Emergency Department Visits in Potentially Sensitive Groups, Am. J. Epidemiol., 165, 625–633, doi:10.1093/aje/kwk051, 2007. 26113
Pinnick, R., Jennings, S., and Fernandez, G.: Volatility of Aerosols in the
20
Arid Southwestern United-States, J. Atmos. Sci., 44, 562–576, doi:10.1175/1520-0469(1987)044¡0562:VOAITA¿2.0.CO;2, 1987. 26121
Pitz, M., Cyrys, J., Karg, E., Wiedensohler, A., Wichmann, H., and Heinrich, J.: Variability of apparent particle density of an urban aerosol, Environ. Sci. Technol., 37, 4336–4342, doi:10.1021/es034322p, 2003. 26123
25
Pratt, K. A. and Prather, K. A.: Real-Time, Single-Particle Volatility, Size, and Chemical Com-position Measurements of Aged Urban Aerosols, Environ. Sci. & Technol., 43, 8276–8282, doi:10.1021/es902002t, pMID: 19924956, 2009. 26114
Putaud, J., Raes, F., Van Dingenen, R., Bruggemann, E., Facchini, M., Decesari, S., Fuzzi, S., Gehrig, R., Huglin, C., Laj, P., Lorbeer, G., Maenhaut, W., Mihalopoulos, N., Mulller,
30
ACPD
11, 26111–26141, 2011Sources and composition of urban
aerosol particles
M. Vogt et al.
Title Page
Abstract Introduction
Conclusions References
Tables Figures
◭ ◮
◭ ◮
Back Close
Full Screen / Esc
Printer-friendly Version Interactive Discussion
Discussion
P
a
per
|
Dis
cussion
P
a
per
|
Discussion
P
a
per
|
Discussio
n
P
a
per
|
2579–2595, doi:10.1016/j.atmosenv.2004.01.041, 2004. 26113
Sakurai, H., Park, K., McMurry, P., Zarling, D., Kittelson, D., and Ziemann, P.: Size-dependent mixing characteristics of volatile and nonvolatile components in diesel exhaust aerosols, En-viron. Sci. Technol., 37, 5487–5495, doi:10.1021/es034362t, 2003. 26114, 26121
S ¨odin, A., Ferm, M., Bj ¨ork, A., Rahmberg, M., Gudmundsson, A., Swietlicki, E., Johansson,
5
C., Gustafsson, M., and Blomqvist, G.: WEAREM Wear particles from road traffic – a field,
laboratory and modeling study, Tech. rep., IVL Swedish Environmental Research Institute, 2009. 26113, 26116
Sternbeck, J., Sjodin, A., and Andreasson, K.: Metal emissions from road traffic and the
in-fluence of resuspension – results from two tunnel studies, Atmos. Environ., 36, 4735–4744,
10
doi:10.1016/S1352-2310(02)00561-7, 2002. 26113
Suglia, S. F., Gryparis, A., Schwartz, J., and Wright, R. J.: Association between traffic-related
black carbon exposure and lung function among urban women, Environmental Health Per-spectives, 116, 1333–1337, doi:10.1289/ehp.11223, 2008. 26113
Vogt, M., Nilsson, E. D., Ahlm, L., M ˚artensson, E. M., and Johansson, C.: Seasonal and
15
diurnal cycles of 0.25–2.5 µm aerosol fluxes over urban Stockholm, Sweden, Tellus B, in press, 2011a. 26114, 26115, 26116, 26117, 26118, 26119
Vogt, M., Nilsson, E. D., Ahlm, L., M ˚artensson, E. M., and Johansson, C.: The relationship
between 0.25 to 2.5µm aerosol and CO2 emissions over a city, Atmos. Chem. Phys., 11,
4851–4859, doi:10.5194/acp-11-4851-2011, 2011b. 26114, 26115, 26117, 26119, 26123,
20
26124
Vogt, M., Nilsson, E. D., Ahlm, L., M ˚artensson, E. M., Struthers, H., and Johansson, C.: Traf-fic aerosol emission velocity derived from direct flux measurements over urban Stockholm, Sweden, Atmos. Environ., in press, 2011c. 26114, 26115
Webb, E., Pearman, G., and Leuning, R.: Correction of Flux Measurements for Density
Ef-25
fects due to Heat and Water-Vapor Transfer, Quarterly Journal of the Royal Meteorological Society, 106, 85–100, doi:10.1256/smsqj.44706, 1980. 26118
Zhang, Q., Stanier, C., Canagaratna, M., Jayne, J., Worsnop, D., Pandis, S., and Jimenez, J.: Insights into the chemistry of new particle formation and growth events in Pittsburgh based on aerosol mass spectrometry, Environ. Sci. Technol., 38, 4797–4809, doi:10.1021/es035417u,
30
2004. 26121
De-ACPD
11, 26111–26141, 2011Sources and composition of urban
aerosol particles
M. Vogt et al.
Title Page
Abstract Introduction
Conclusions References
Tables Figures
◭ ◮
◭ ◮
Back Close
Full Screen / Esc
Printer-friendly Version Interactive Discussion
Discussion
P
a
per
|
Dis
cussion
P
a
per
|
Discussion
P
a
per
|
Discussio
n
P
a
per
|
Carlo, P. F., Salcedo, D., Onasch, T., Jayne, J. T., Miyoshi, T., Shimono, A., Hatakeyama, S., Takegawa, N., Kondo, Y., Schneider, J., Drewnick, F., Borrmann, S., Weimer, S., Demerjian,
K., Williams, P., Bower, K., Bahreini, R., Cottrell, L., Griffin, R. J., Rautiainen, J., Sun, J. Y.,
Zhang, Y. M., and Worsnop, D. R.: Ubiquity and dominance of oxygenated species in organic aerosols in anthropogenically-influenced Northern Hemisphere midlatitudes, Geophys. Res.
5
ACPD
11, 26111–26141, 2011Sources and composition of urban
aerosol particles
M. Vogt et al.
Title Page
Abstract Introduction
Conclusions References
Tables Figures
◭ ◮
◭ ◮
Back Close
Full Screen / Esc
Printer-friendly Version Interactive Discussion
Discussion
P
a
per
|
Dis
cussion
P
a
per
|
Discussion
P
a
per
|
Discussio
n
P
a
per
|
Table 1. Overview of individual half hour measurements made during the campaign. The unheated sampling line was running at all times in parallel to the heated. The following
abbrevi-ations are usedT: Temperature (°C) of heated air;N: Total number of half hours;NN: Number
of half hours of which are in Northern sector (270–90 °);NM: Months with data.
T N NN NM
200 1800 1003 May 2008, Jul 2008
ACPD
11, 26111–26141, 2011Sources and composition of urban
aerosol particles
M. Vogt et al.
Title Page
Abstract Introduction
Conclusions References
Tables Figures
◭ ◮
◭ ◮
Back Close
Full Screen / Esc
Printer-friendly Version Interactive Discussion
Discussion
P
a
per
|
Dis
cussion
P
a
per
|
Discussion
P
a
per
|
Discussio
n
P
a
per
|
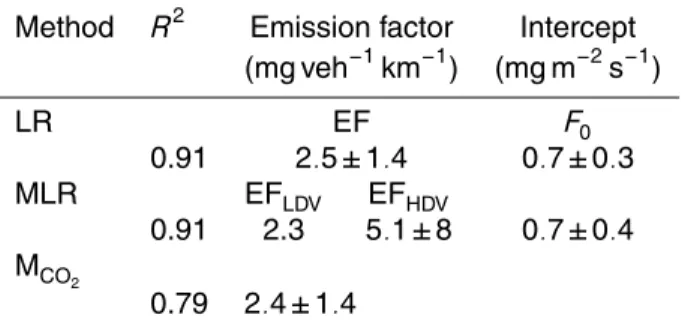
Table 2. Comparison between the different attempts to find a source parameterization (F) for
refractory aerosol particles smaller than 0.6 µmDp. The traffic activity used is the mean daily
traffic activity from (Monday-Friday, 24 values) in the NE sector over an area of 1 km×1 km, (TA,
traffic activity,light duty vehicles (LDV) and heavy-duty vehicles(HDV)). The following
abbrevi-ations are used (LR: Linear regression (Equation F=EFFleetmixTA+F0); MLR: Multiple linear
regression (EquationF=EFLDV TALDV+EFHDVTAHDV+F0)); MCO2: EF based on CO2emission
fluxes (EquationF =EFFleetmixTA).
Method R2 Emission factor Intercept
(mg veh−1km−1) (mg m−2s−1)
LR EF F0
0.91 2.5±1.4 0.7±0.3
MLR EFLDV EFHDV
0.91 2.3 5.1±8 0.7±0.4
MCO2
ACPD
11, 26111–26141, 2011Sources and composition of urban
aerosol particles
M. Vogt et al.
Title Page
Abstract Introduction
Conclusions References
Tables Figures
◭ ◮
◭ ◮
Back Close
Full Screen / Esc
Printer-friendly Version Interactive Discussion
Discussion
P
a
per
|
Dis
cussion
P
a
per
|
Discussion
P
a
per
|
Discussio
n
P
a
per
|
Fig. 1. Location of the monitoring stations in Stockholm: Hornsgatan (A), Torkel
Knutsson-sgatan (B)and Kalmgatan (C) Blue indicates water surfaces, green forest/park areas, grey
ACPD
11, 26111–26141, 2011Sources and composition of urban
aerosol particles
M. Vogt et al.
Title Page
Abstract Introduction
Conclusions References
Tables Figures
◭ ◮
◭ ◮
Back Close
Full Screen / Esc
Printer-friendly Version Interactive Discussion
Discussion
P
a
per
|
Dis
cussion
P
a
per
|
Discussion
P
a
per
|
Discussio
n
P
a
per
|
−2 0 2 4 6 −4
−2 0 2 4 6 8
Flux PN
1
heated
Flux PN 1 unheated y=0.96*x+0.02: r2=0.99
−2 0 2 4 6 −4
−2 0 2 4 6 8
Flux PN
0
.6
heated
Flux PN
0.6 unheated y=0.95*x+0.02: r2=0.99
0 200 400 600 0
200 400 600
Num PN
1
heated
Num PN
1 unheated y=1.01*x+5.3: r2=0.99
0 200 400 600 0
200 400 600
Num PN
0
.6
heated
Num PN
0.6 unheated y=1.0*x+5.8: r2=0.99 a)
d) c)
b)
Fig. 3. Correlation between the two OPCs for ambient temperatures(a) particle number flux
PN1 (b)particle number flux PN0.6 (c)particle number concentration PN1(d)particle number
ACPD
11, 26111–26141, 2011Sources and composition of urban
aerosol particles
M. Vogt et al.
Title Page
Abstract Introduction
Conclusions References
Tables Figures
◭ ◮
◭ ◮
Back Close
Full Screen / Esc
Printer-friendly Version Interactive Discussion
Discussion
P
a
per
|
Dis
cussion
P
a
per
|
Discussion
P
a
per
|
Discussio
n
P
a
per
|
0.250 0.5 0.75 1
50 100 150
Diameter (µm)
dNdlogD
p
0.25 0.5 0.75 1
0,1 1 100 1000
Diameter (µm)
dNdlogD
p
0.250 0.5 0.75 1
1 2
Diameter (µm)
dVdlogD
p
0.25 0.5 0.75 1
10−1
100
101
Diameter (µm)
dVdlogD
p
unheated
300 oC
200 oC
Fig. 4.Median size distributions for different OPC temperatures(a)particle number
concentra-tion(b)particle number concentration with logarithmic axes(c)particle volume concentration
ACPD
11, 26111–26141, 2011Sources and composition of urban
aerosol particles
M. Vogt et al.
Title Page
Abstract Introduction
Conclusions References
Tables Figures
◭ ◮
◭ ◮
Back Close
Full Screen / Esc
Printer-friendly Version Interactive Discussion
Discussion
P
a
per
|
Dis
cussion
P
a
per
|
Discussion
P
a
per
|
Discussio
n
P
a
per
|
0.25 0.5 0.75 1
0.2 0.4 0.6 0.8 1 1.2 1.4 1.6 1.8
Particle diameter (µm)
Volumne ratio
200 oC/ unheated
300 oC/ unheated
300 oC/ 200 oC
ACPD
11, 26111–26141, 2011Sources and composition of urban
aerosol particles
M. Vogt et al.
Title Page
Abstract Introduction
Conclusions References
Tables Figures
◭ ◮
◭ ◮
Back Close
Full Screen / Esc
Printer-friendly Version Interactive Discussion
Discussion
P
a
per
|
Dis
cussion
P
a
per
|
Discussion
P
a
per
|
Discussio
n
P
a
per
|
0.25 0.5 0.75 1
0 0.1 0.2 0.3 0.4
Particle diameter (µm)
r
2
BC
roof vs Ntower
BC
roof vs Nroof
ACPD
11, 26111–26141, 2011Sources and composition of urban
aerosol particles
M. Vogt et al.
Title Page Abstract Introduction Conclusions References Tables Figures ◭ ◮ ◭ ◮ Back Close
Full Screen / Esc
Printer-friendly Version Interactive Discussion Discussion P a per | Dis cussion P a per | Discussion P a per | Discussio n P a per |
0 6 12 18 24
0 1 2 3 4 5
BC difference Street Roof (µg/m
−
3)
Local time (h)
0 6 12 18 24
0 50 100 150 200 250 NO x
difference Street Roof (µg/m
−
3)
Local time (h)
0 6 12 18 24
0 10 20 30 40 EF B C mg veh −
1 km
−
1
Local time (h)
0 6 12 18 24
−2 0 2 4 6 8
Flux (0.25 to 0.6 µm D
p
)(µg m
−2
s
−1)
Local time (h)
0 6 12 18 24
−5 0 5 10 15 20 CO 2
flux (µmol 10
6 m
−2
s
−1
)
Local time (h)
0 6 12 18 24
−2 0 2 4 6 8 EF P M 0 .6 mg veh −
1 km
−
1
Local time (h)
e) f)
d)
a) b) c)
Fig. 8. Median diurnal cycles of(a)BC concentration(b)NOxconcentrations(c)BC emission
factor(d)particle number flux,(e)CO2flux, (f)mass emission factor EFRPM0.6. The vertical