www.atmos-chem-phys.net/12/3985/2012/ doi:10.5194/acp-12-3985-2012
© Author(s) 2012. CC Attribution 3.0 License.
Chemistry
and Physics
Black carbon from ships: a review of the effects of ship speed, fuel
quality and exhaust gas scrubbing
D. A. Lack1,2and J. J. Corbett3
1Chemical Sciences Division, Earth System Research Laboratory, NOAA, Boulder, Colorado, USA
2Cooperative Institute for Research in Environmental Sciences, University of Colorado, Boulder, Colorado, USA 3College of Marine and Earth Studies, University of Delaware, Newark, Delaware, USA
Correspondence to:D. A. Lack (daniel.lack@noaa.gov)
Received: 28 December 2011 – Published in Atmos. Chem. Phys. Discuss.: 31 January 2012 Revised: 10 April 2012 – Accepted: 13 April 2012 – Published: 4 May 2012
Abstract. The International Maritime Organization (IMO) has moved to address the health and climate impact of the emissions from the combustion of low-quality residual fuels within the commercial shipping industry. Fuel sulfur content (FS) limits and an efficiency design index for future ships are
examples of such IMO actions. The impacts of black carbon (BC) emissions from shipping are now under review by the IMO, with a particular focus on the potential impacts of fu-ture Arctic shipping.
Recognizing that associating impacts with BC emissions requires both ambient and onboard observations, we provide recommendations for the measurement of BC. We also evalu-ate current insights regarding the effect of ship speed (engine load), fuel quality and exhaust gas scrubbing on BC sions from ships. Observations demonstrate that BC emis-sion factors (EFBC) increases 3 to 6 times at very low engine
loads (<25 % compared to EFBC at 85–100 % load);
abso-lute BC emissions (per nautical mile of travel) also increase up to 100 % depending on engine load, even with reduced load fuel savings. If fleets were required to operate at lower maximum engine loads, presumably associated with reduced speeds, then engines could be re-tuned, which would reduce BC emissions.
Ships operating in the Arctic are likely running at highly variable engine loads (25–100 %) depending on ice condi-tions and ice breaking requirements. The ships operating at low load may be emitting up to 50 % more BC than they would at their rated load. Such variable load conditions make it difficult to assess the likely emissions rate of BC.
Current fuel sulfur regulations have the effect of reduc-ing EFBCby an average of 30 % and potentially up to 80 %
regardless of engine load; a removal rate similar to that of scrubbers.
Uncertainties among current observations demonstrate there is a need for more information on a) the impact of fuel quality on EFBC using robust measurement methods and b)
the efficacy of scrubbers for the removal of particulate matter by size and composition.
1 Introduction
The commercial shipping industry, through the United Na-tions International Maritime Organization (IMO), is subject to regulation on the quality of fuel that can be consumed within specially designated emission control areas (ECAs), in particularly sensitive regions like the Antarctic, and glob-ally (IMO, 2008, 2009). These fuel quality requirements are motivated both by safety concerns about engine operation and vessel navigation (ISO, 1987), and to achieve human health and environmental protections from engine exhaust products. The IMO has also specified an efficiency design index that will reduce ship fuel consumption for energy sav-ings and greenhouse gas emission reductions (IMO, 2011c) for an industry that emits 3.3 % of global CO2 emissions
(Buhaug et al., 2009). Current IMO environmental regula-tions are directed at limiting the emissions of sulfur diox-ide (SO2) which forms acid rain (harmful to ecosystems) and
air quality-degrading primary and secondary particles. Ships contribute between 5 and 8 % of global anthropogenic SO2
Shipping emissions of concern for health include sec-ondary ozone (formed from NOxemissions), secondary
par-ticulate sulfate (formed from gaseous sulfur dioxide emis-sions) and directly emitted particulate sulfate, organic matter and black carbon (BC). Evidence is emerging that BC has a distinct health effect compared to other particulates despite being only a small fraction of PM mass emitted by many sources (Smith et al., 2009). Corbett et al. (2007) and Wine-brake et al. (2009) identified the magnitude of current health impacts from shipping and those reductions in health impacts that would be brought about by the IMO regulations.
Shipping emissions also alter the radiative balance of the atmosphere via warming by CO2, ozone and BC emissions,
and cooling by particulate sulfate formation and subsequent formation and alteration of clouds (Eyring et al., 2010; Lauer et al., 2009). Cooling can also result from ship NOx
emis-sions reducing methane lifetime (Myhre et al., 2011). The cooling effect of particulate sulfate and the warming of CO2
dominate the radiative impacts of shipping, however BC can have significant localized warming both in the atmosphere and on snow and ice surfaces (Flanner et al., 2007; Hansen and Nazarenko, 2004; Ramanathan and Carmichael, 2008). Of particular concern for climate is the likelihood that re-treating sea ice in the Arctic will allow for a significant increase in shipping activity and related emissions (IMO, 2010a). Shipping contributes about 2 % to global BC emis-sions (Lack et al., 2008b), and currently very little in the tic (Corbett et al., 2010a). The vast majority of current Arc-tic BC is sourced from outside of the ArcArc-tic region (Quinn et al., 2011), and future ship traffic in the Arctic will be one of the few direct emissions of BC into the Arctic (Quinn et al., 2011). In addition, these added direct emissions will likely add to the climate impacts in that region (Corbett et al., 2010a; IMO, 2010a).
There are a number of alternatives for reducing emissions from shipping, some of which have already been assessed for their efficacy and cost effectiveness (e.g. speed reductions, fuel quality, engine slide valves, water-in-fuel emulsions, fuel emulsions, particulate filters, exhaust scrubbers) (Cor-bett et al., 2009; Cor(Cor-bett et al., 2010b). There are three path-ways that hold particular promise for emissions reductions; the effect of ship speed reductions (or ‘slow steaming’); fuel quality improvements; and exhaust scrubbers. These poten-tial emissions mitigation options have not been rigorously assessed for their impact on BC emissions.
The recent downturn in the global economy led to a glob-ally averaged reduction in ship speed of 15 % (PWC, 2011), influenced by the reduced demand for voyages and financial savings through reductions in fuel consumption. Maintain-ing some form of ship speed reductions as industry practice or regulation has been discussed within industry and reg-ulatory circles as an emissions reduction strategy. In addi-tion, some coastal regions have mandatory or voluntary ship speed reduction programs, mostly motivated by minimizing ship whale strikes and improving air quality (CARB, 2009b;
NOAA, 2008; Port-of-San-Diego, 2009). For ships operat-ing in optimal cruisoperat-ing conditions (open and calm waters), decreases in ship speed lead to decreases in absolute fuel consumption (as a cubic function) due to the reduced fluid resistance on the ship hull (Harvald, 1977), and so there can be significant CO2and other emissions reductions for a small
reduction in speed. However, as engines are usually tuned for maximum speed (c.f. load), operation at lower loads creates a less efficient combustion process that could lead to increases in emissions such as CO and BC.
Regulations on the quality of fuel used by ships are al-ready in force in specific regions (IMO, 2008, 2009), where fuel sulfur content (FS), one aspect of fuel quality, is reduced
so that emission of SO2and primary and secondary
partic-ulate sulfate are also reduced. Significant improvements to air quality are expected from such regulation (IMO, 2009; Winebrake et al., 2009). However sparse data exist on how BC emissions from ship engines are affected by FS or other
aspects of fuel quality. Fuel quality is a general term describ-ing the relative level of impurities, as well as the combustion ability of the hydrocarbons within the fuel. Residual fuels, the fraction of crude oil remaining after the refining process, can contain high levels of sulfur, heavy metals (e.g. vana-dium, nickel), ash (non-combustible inorganic material) and high molecular weight aromatic hydrocarbons. Each of these impurities (except perhaps for heavy metals) is known to cre-ate slower and delayed combustion, potentially leading to BC formation (American-Bureau-of-Shipping, 2001). It is there-fore somewhat expected that better combustion and lower emissions per unit of fuel consumed result from combustion of more refined fuels, as compared to residual fuels. It is also known that heavy metals create localized hot-spots within the flame and catalyze combustion of BC (e.g. Maricq, 2007; Ristimaki et al., 2010).
An alternative to complying with low FSregulations is to
employ exhaust gas scrubbers while still burning high sul-fur (and the least expensive) fuel. Scrubbers can reduce gas and particle phase emissions from the exhaust stream before release to the atmosphere. Commercial organizations are de-veloping scrubbers that are reported to provide SO2
emis-sions reductions equivalent to the use of low FSfuel required
by regulation. Very little data exists on the efficacy of these scrubbers for BC emissions.
IMO Marine Environment Protection Committee (MEPC) and investigation was then tasked to the Bulk Liquids and Gases (BLG) subcommittee of the MEPC (IMO, 2011a). We limit this review to the data available for marine diesel en-gines, and data available in peer-reviewed literature, industry reports and presentations that are in the public domain, or in-dustry data where permission has been granted to publish the data.
2 Definition and measurement of black carbon
We can define black carbon as a set of species of strongly light absorbing carbon particles emitted by combustion of or-ganic compounds. Various terms used to describe this species are defined by the measurement techniques used. Andreae and Gelencser (2006) provide a comprehensive review of this topic. Briefly, elemental carbon (EC) is “the fraction of carbon that is oxidized in combustion analysis above a certain temperature threshold, and only in the presence of an oxygen-containing atmosphere” (Andreae and Gelencser, 2006). The technique to make this measurement is referred to as thermal-optical-analysis (TOA). Black carbon (BC) is the common term used for the mass of strongly light absorb-ing carbon derived from the absorption of a specific wave-length of light by the particles and where a wavewave-length spe-cific mass-to-absorption coefficient (MAC) is used to convert from absorption to mass. The MAC for particles containing mostly fractal carbon freshly emitted from efficient combus-tion of fossil fuels is reasonably well defined (7.5 m2g−1)
for 550 nm radiation (Bond and Bergstrom, 2006; Cross et al., 2010). Refractory BC (rBC) is the terminology applied to the mass of material that incandesces (emits visible light) when heated with a laser (Schwarz et al., 2006).
There are multiple techniques and methods for measur-ing EC, BC and rBC. Each technique has potential advan-tages and drawbacks. TOA analysis (measuring ECTOA)
ex-hibit substantial potential biases and requires data corrections due to interference of organic particulates and selection of thermal profiles (Boparai et al., 2008). Filter based light ab-sorption requires significant calibration and corrections and may also suffer from organic particulate and particle size bi-ases (Arnott et al., 2005; Bond et al., 1999; Kondo et al., 2009; Lack et al., 2008a; Nakayama et al., 2010). A com-mon technique for measuring the opacity created by engine exhaust smoke, the filter smoke number (FSN), is a filter-based absorption method that requires substantial empirical corrections to derive BC mass (Northrop et al., 2011). Uncer-tainties on mass derived from FSN measurements are there-fore dependent on the fit to empirical data. Photo-acoustic absorption spectroscopy (PAS) is a more accurate, precise and sensitive measure of absorption compared to the filter-based techniques (Arnott et al., 2006; Lack et al., 2006; Lack et al., 2008b). Laser induced incandescence (LII) is probably the most fundamental measurement of the strongly light
absorbing carbon material, although this technique requires very careful calibration and operation (Cross et al., 2010; Moteki and Kondo, 2010). Most of these techniques have been applied to the measurement of EC or BC from diesel engine emissions (Burtscher, 2005). However, most of the techniques mentioned here show variable levels of agreement to one another when measuring ship engine exhaust despite the fact that they can show excellent agreement with each other under controlled laboratory conditions with controlled samples (Cross et al., 2010; Kondo et al., 2011; Sheridan et al., 2005). Moosmuller et al. (2009) provides additional de-tails in their comprehensive review of the measurement tech-niques for particle light absorption. A single measurement technique for the target species would be the ideal to ensure consistent measurement and analysis. However, the varying degrees of expense, ease of use, and data accuracy of the instrumentation explain why different organizations may fa-vor a specific technique for measuring ship, or engine emis-sions. Using consistent measurement methods (e.g. calibra-tions, correccalibra-tions, temperature profiles, dilution etc.) is also essential. For example, one of the most important parameters in measuring combustion engine exhaust emissions is sample dilution. Burtscher (2005) highlight the inaccuracies in mea-surement of emissions from diesel engines when different ex-haust dilution ratios are used. Ristimaki et al. (2010) found that accuracy of particulate mass measurement improved as dilution increased; dilution factors beyond the ISO-8178-1 standard were required for reproducible measurement. Note that the ISO 8178 standard specifies the test load cycles for emissions measurements from non-road vehicles. In addition it specifies a minimum dilution of the emitted exhaust prior to sampling. In this review we focus only on measurements made on the emissions of marine diesel engines. Sects. 2.1 through 2.5 compare EC, BC and rBC measurements for emissions from marine diesel engines. We use the follow-ing terminology: photo-acoustic derived BC is BCPAS,
filter-based absorption-derived BC is BCFilter, LII BC is rBC,
fil-ter smoke number derived BC is BCFSNand thermal optical
analysis EC is ECTOA. 2.1 PAS BC – filter BC
Lack et al. (2008b) measured light absorption and converted this to BC mass emission factors (BCPAS) from almost 100
ships. In a follow-up study Lack et al. (2009) compared these emission factors where both PAS and a filter-based absorp-tion instrument (particle soot absorpabsorp-tion photometer, PSAP) measured the same plume. Cappa et al. (2012) also measured EFBC−PASand EFBC−Filter(using the PSAP) for a ship
run-ning a medium speed diesel (MSD) engine. The conversion from absorption to mass used a literature MAC value that can be applied to absorption measurements at the wavelength of 532 nm (7.75 m2g−1). Figure 1a shows the comparison
Fig. 1.Comparison of emission factors from marine diesel engines.
(a)EFBC-PASand EFBC-Filterfrom Lack et al. (2009) (circles) and Cappa et al. (2012) (triangles),(b)EFBC-Filterand EFEC-TOAfrom
Petzold et al. (2011a),(c)EFBC-rBC and EFBC-PAS from Cappa et al. (2012) and(d)EFEC-TOAand EFBC-FSNfrom Ristimaki et
al. (2010). Linear regression fit shown by dashed line in(a),(c)and
(d). 1:1 line shown by dashed line in(b).
two independent studies. These data are for emissions from marine diesel engines under real world operating conditions where thermal equilibration and large dilution with the atmo-sphere has occurred, eliminating dilution issues discussed in Sect. 2.
2.2 Filter BC – TOA EC
Petzold et al. (2011a) measured both ECTOAand BCFilterfor
emissions using a variety of fuels used in a marine diesel en-gine. Those results (Fig. 1b) show a strong deviation from the expected correlation of 1. Measured ECTOAis over twice
that of measured BCFilter (using a multi angle absorption
photometer, MAAP), with some significant scatter. Measure-ments were performed using the ISO-8178 standard. In a study on gas turbine engines, Petzold et al. (2011b) showed that a similar discrepancy between BCFilterand ECTOAwas
anti correlated to the amount of particulate organic mat-ter (POM) present, and suggested that pyrolysis of POM to ECTOAcould occur. This interpretation was supported by the
broader inter-comparison study of Schmid et al. (2001).
2.3 PAS BC– LII rBC
Cappa et al. (2012) were able to measure BCPAS and rBC
emission factors for a ship running a MSD engine off the coast of California in 2010. A comparison of data from four plume intercepts using LII and two independent PAS mea-surements (Fig. 1c) show a slope of 1.14 and R2 of 0.94 for the 8 measurements. This excellent correlation close to
a slope of 1 indicates that the mass absorption coefficient used, 7.75 m2g−1, is generally valid for this dataset, which
is an important consideration for the translation of light ab-sorption and mass measurements (IMO, 2011b).
2.4 TOA EC – FSN BC
Ristimaki et al. (2010) measured ECTOAand FSN for three
types of fuels (two low quality and one high quality) at vari-ous load conditions. This study compared emissions between high and low fuel quality used in the same engine at varying loads. The FSN is a unitless number derived from filter based light absorption. The measurement technique has known bi-ases (Northrop et al., 2011) that can, in principle, be cor-rected (Christian et al., 1993) and then translated into BC concentrations. We apply the Christian et al. (1993) correc-tion to all the FSN data in this review to produce a BCFSN
mass emission factor. The FSN requires a factor of 10 or more correction to derive BC mass concentrations (g m−3). Despite these corrections being somewhat uncertain, Fig. 1d generally shows good agreement between the FSN and TOA methods, although the scatter in the data appears to increase at low EF values. The ISO-8179 standard was altered in this study to reduce dilution biases.
2.5 LII rBC – TOA EC
There are no published studies where the same BC emissions from marine diesel engines have been measured using LII (rBC) and TOA (ECTOA).
2.6 Measurement methods summary
This assessment of limited available data sets show that BCPAS, BCFilter and rBC are consistent measurement
tech-niques for BC emissions from ships. There is a poor correla-tion for ECTOA and BCFilter for the one study where both
were used for the measurement of BC from a marine en-gine. Under controlled laboratory conditions there is consis-tency between BCFilter, ECTOA and rBC, however there
ap-pears to be some inconsistency between ECTOAand BCFilter
in field measurements of ship exhaust, very likely due to the POM content of the exhaust causing biases in the measure-ment (Petzold et al., 2011b; Schmid et al., 2001). ECTOA
and BCFSN show good agreement in one study,
suggest-ing that biases were not significant in that study. This sug-gests that the ECTOAmethod is not nearly as reliable a tool
for measurement of BC. In addition, the TOA method does not have the requisite time resolution to do plume analysis. We therefore conclude that BCPAS, BCFilterand rBC can be
used for absolute emissions measurements, both in engine test bed studies and atmospheric sampling. Although BCFSN
and ECTOA showed good agreement, obtaining BC mass
the ISO 8178 standard for measuring engine exhaust emis-sions show the best comparison among instruments. Dilu-tion is a significant factor in the measurement of diesel ex-haust emissions, in particular the measured mass of particu-late organic matter (POM) (Burtscher, 2005; Ristimaki et al., 2010). POM can impact the artifacts within the TOA method (Boparai et al., 2008). The use of the TOA method will be further discussed in Sect. 4. From this point forward, all data are presented in relative terms normalized to 85–100 % load or as a ratio between ‘before’ and ‘after’ measurements (e.g. low to high fuel quality). We rely upon the equivalency be-tween BC, rBC and EC under this method of presentation. In general discussion we will refer to EC, BC and rBC as simply BC.
3 Effect of engine load
We investigate how the load of a marine diesel engine affects BC emissions using original and metadata from published studies. Under ideal conditions, main engine load is corre-lated with vessel speed. How would mandatory or incentive-based ship speed limits affect BC emissions? What insights for potential future ship speed regulation can be found within the data currently available?
3.1 Literature review
Marine diesel engines can be tuned for maximum en-ergy output at minimum fuel consumption during opera-tion at the most common engine load condiopera-tions expected (American-Bureau-of-Shipping, 2001). Maximum efficiency results from the highest ratio between the maximum pressure at the top of the piston stroke (PMAX) to the average
pres-sure across the cylinder cycle (PAvg); in the case of marine
diesel engines the brake mean effective pressure (PBMEP) is
an often used version ofPAvg that considers engine torque
(Wettstein and Brown, 2008). Under such tuning conditions these engines consume the least amount of fuel for each unit of work, and likewise produce the least amount of BC parti-cles. When engines operate outside of the tuned engine load without retuning, fuel efficiency often decreases and emis-sions (including BC) increase due to variations in condi-tions away from ideal combustion. Engines can be re-tuned for different loads in a process where the PMax/PBMEP is
maximized (Wettstein and Brown, 2008); some advanced en-gines with electronically controlled fuel meters may be able to modify combustion settings, per cylinder, essentially tun-ing durtun-ing operational changes to better approximate best-performance conditions. De-rating would likely be carried out if the engine were to operate at that new load on a some-what permanent basis. Fuel efficiency can be improved by a few percent when de-rating is performed for loads lower than the maximum design load (Wettstein and Brown, 2008)
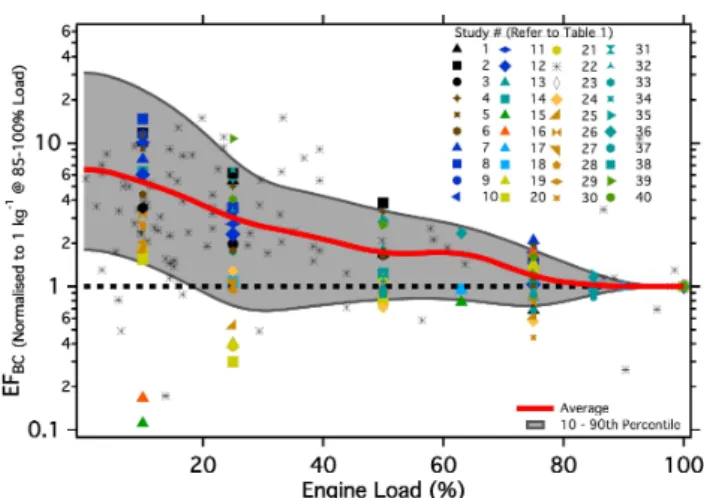
Fig. 2.The relationship between EFBCand ship engine load. Aver-age = red, 10th and 90th percentile = grey.
(note: this study showed data for de-rating down to approxi-mately 70 % of original engine power rating).
For MSD and slow speed diesel (SSD) engines most data within literature appear to be collected from engines tuned for their maximum rated load for continuous service. There is an inverse relationship between engine load and BC emis-sions (Kasper et al., 2007; MAN-Diesel-SE, 2007; Petzold et al., 2011a; Petzold et al., 2010; Ristimaki et al., 2010). A reanalysis of the BC data from Lack et al. (2008b) (using the cubic function between engine load and speed to calcu-late engine loads, (speedαengine load3)) also show this
in-verse relationship for 101 vessels. In contrast, some studies that show a direct relationship between engine load and BC emissions (Cappa et al., 2012; Jayaram et al., 2011). Figure 2 (and Table 1) show all data of BC emissions and engine load available (we note that some data may exist that is not ac-cessible to us), all of which are normalized to a BC emission factor (EFBC) of 1 kg−1at 85–100 % engine load – typical
of in-service maximum engine loads at unrestricted cruise speeds. (Note: Normalization to typical unrestricted cruise speeds allows all data to be compared). The average and 10 and 90 percentiles1for all data (SSD and MSD marine en-gines) are also shown and forms the basis of further analysis (red lines Fig. 3).
To better illustrate the BC emissions changes in an envi-ronmental context under varying engine conditions we cal-culate the absolute emissions of BC for a nautical mile of travel. Fuel consumption (FCons; kilograms of fuel per
nauti-cal mile of travel) is nauti-calculated (Eq. 1) based on the specific fuel consumption relationship to load (Eq. 2) presented by the US EPA (2000) and is estimated for an engine with a rated power (PMW) of 70 MW and a rated speed of 25 knots 1For calculation of average and 10th–90th percentile, data were
Table 1.Studies on the effect of engine load on BC emissions found in literature.
Study (#) Engine Type Fuel Type Measurement Reference
1–6 MSD HFO, LFO EC – TOA, BC-FSN Ristimaki et al. (2010) 7–12, 22–27 MSD HFO, MGO, Biodiesels BC – Filter, EC – TOA Petzold et al. (2011a) 13 MSD HFO EC – TOA Petzold et al. (2004) 14 MSD HFO EC – TOA, BC – Filter Petzold et al. (2010) 15 MSD MDO BC – PAS Cappa et al. (2012) 16 SSD HFO, MDO EC – TOA Kasper et al. (2007) 17 SSD HFO EC – TOA Agrawal et al. (2010) 18 SSD HFO EC – TOA Agrawal et al. (2008) 19–21 MSD Biodiesel EC – TOA Jayaram et al. (2011) 22 SSD, MSD HFO, MDO, MGO BC – PAS Lack et al. (2008b) 23, 24 MSD HFO, MGO EC – TOA MAN-Diesel-SE (2007) 31–38 MSD HFO BC – FSN Sarvi et al. (2008a, b) 39, 40 MSD MDO BC – FSN Sarvi et al. (2008b)
Fig. 3. (a)Average EFBCchange with ship speed and engine load (with 10th and 90th percentiles) and (b) the potential absolute changes in BC emissions with ship speed and engine load (with 10th and 90th percentiles). EFBCdata from(a)combined with fuel
consumption data from(b)(circle points) to produce data in(b). All but FConsare normalized to 1 at 100 % load.
(example taken from Lack et al., 2011). FConsis shown as the
black dashed line in Fig. 3. FCons(kg NM−1)=
(FCons-kWhr×1000PMW)×fLoad
vvessel
(1)
FCons-kWhr(kg(kW·hr)−1)=0.0142×
1
fLoad
+0.195
(2) Using the average EFBC with fractional engine load (fLoad)
and the FCons, the net per-nautical-mile BC mass emissions
is presented in Fig. 3 which shows that, on average absolute emissions of BC per mile do not change significantly at loads between 50 to 100 %. Above∼50 % main engine load the reduced fuel consumption offsets potential increases in the EFBC. Below 25 % load absolute BC emissions may increase
by 50–100 %. The exact behavior results from a balancing between the increase in EFBCand decrease in FConswith
de-creasing ship speed. This assessment is critically dependent on the EFBCused and thus highlights the uncertainty
associ-ated with relationship between BC emissions and ship speed, and the need for more measurements. Importantly, these es-timates do not adjust for potential de-rating conditions; in other words, the EFBCfrom these studies and the calculated
average are from measurements on engines that were tuned for operation at maximum loads.
3.2 Example of effect of engine load
In 2007 the AP Moller-Maersk2 shipping company imple-mented a systematic management system for reducing ship speed in an effort to reduce fuel consumption, vessel idle time and emissions. Based on changes in main engine load across the fleet average main engine load has decreased from 60 % to 35 % of maximum engine rating realizing mea-surable reductions in fuel consumption and CO2emissions
(deKat, 2011) (Fig. 4). To assess potential BC changes we define two scenarios. The first scenario is where no engines were re-tuned across the time period. Using the average BC
2Data were obtained from certain commercial organizations
Fig. 4.Average main engine load change for the Maersk fleet (black line). Reproduced with permission from AP Moller-Maersk (deKat, 2011). The potential range of BC mass changes due to the Maersk speed reduction program is also shown as the shaded region.
mass change from Sect. 3.1, Fig. 3b, BC emissions could have increased by up to 7 % for the load changes reported. This is shown in Fig. 4 as the high range of the shaded area. The alternative scenario is where all engines are re-tuned to the lower load. Under this scenario BC emissions are linearly correlated to fuel consumption and could have decreased by over 20 % (low range of the shaded are in Fig. 4). This exam-ple highlights the importance of ensuring engines are tuned for the dominant load characteristics to minimize BC emis-sions. In actuality, the “vessels comprising that figure (Fig. 4) present a mix of de-rated [re-tuned] and non-de-rated en-gines” (J. deKat, personal communication, 2011). It is there-fore difficult to assess the actual change in BC emissions without direct measurements. However, if the operators re-tuned even some of the engines, then Fig. 4 suggests that BC emissions likely declined as a result of the Maersk speed re-duction program.
3.3 Regional effect of engine load – arctic fleet
The Arctic environment is particularly sensitive to BC both in the atmosphere and when deposited on snow and ice (Quinn et al., 2008). As sea ice extent declines the possi-bility of more Arctic shipping traffic increases as resource exploration/extraction and full Arctic ship transits become possible. Ships, therefore, may represent an increasing local source of Arctic pollution (Corbett et al., 2010a). In addition to emissions from local ship traffic, BC emissions from ships as far South as 40◦N may impact the Arctic climate (IMO, 2010a). To understand how shipping activities in the Arctic may contribute to BC emissions and how this may change with ice conditions we must have some sense for the current and potential future operating conditions (i.e. engine load at different ice conditions) of ships in that region.
Based on review of literature there are three possible en-gine load conditions under which a ship may operate in Arc-tic waters; (i) where up to 100 % of engine load may be
re-Fig. 5. (a)Ice Decision Numeral relationship to safe ship speeds in the Arctic. Reproduced from the data from Table 6 of McCal-lum (1996). Shaded area is standard deviation of data from multiple ships and different ship classes.(b)The estimated engine load char-acteristics of all ship types currently operating in the Arctic, as a function of IDN. Average speed/IDN and high speed/IDN relation-ship presented.
quired to break ice and maintain a minimum forward motion (IMO, 2012c): (ii) where ship hull resistance is dictated by water only and speedαengine load3(MAN, 2004), although the vessel may be required to slow in response to various conditions (no ice breaking or moving) and (iii) an interme-diate condition between (i) and (ii) where ships may invest energy into breaking or moving ice but faster than minimum speeds are possible. For this intermediate condition we ap-ply a speedαload relationship. We investigate these three conditions further below.
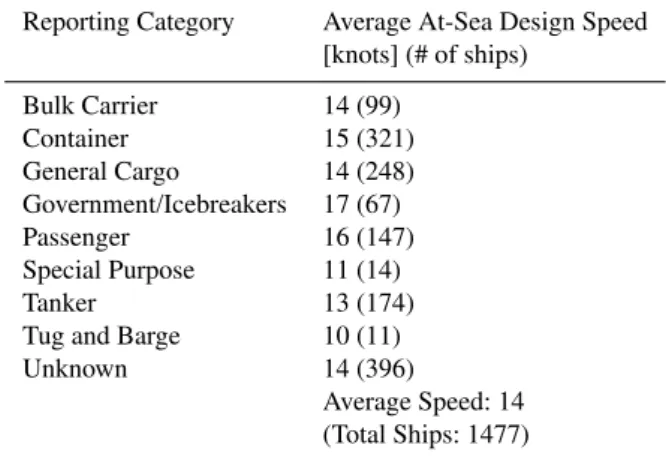
Table 2.Average Design Speed of Ships Operating in the Arctic (AMSA, 2009).
Reporting Category Average At-Sea Design Speed [knots] (# of ships)
Bulk Carrier 14 (99) Container 15 (321) General Cargo 14 (248) Government/Icebreakers 17 (67) Passenger 16 (147) Special Purpose 11 (14) Tanker 13 (174) Tug and Barge 10 (11) Unknown 14 (396)
Average Speed: 14 (Total Ships: 1477)
∗Note: Fishing vessels are not included here due to the difference in operation
compared to merchant ships.
rated speeds for ships currently operating in the Arctic (Ta-ble 2).
In Fig. 5b we show estimated engine loads under the three different scenarios mentioned above. Ice breaking and min-imal forward motion (scenario (i) would occur with IDNs around 0±5. Under these conditions ships may operate en-gines at very high engine loads (85–100 %) despite travelling at a minimal speed (IMO, 2012a, b, c) (see Fig. 5b, black shaded region). If this high load is maintained then BC emis-sions are optimized low. However if ice conditions vary then these high loads may be part of a duty cycle between ice breaking activity and lower load operation, resulting in in-creases in BC emissions (based on Fig. 3b).
By combining the safe speed/IDN data (Fig. 5a) and the rated speed data (Table 2) we can offer some insights into the operating load of non-ice breaking ships operating in the Arctic with varying sea ice conditions. Here we convert the safe speed/IDN data (Fig. 5a) and the rated speed data (Table 2) (using the speed – load relationships discussed in scenarios (ii) and (iii) above) to engine load. For scenario (ii) ship speed and engine load follow a cubic function as would be expected for ideal cruising conditions. For sce-nario (iii) we assign a linear relationship between engine load and speed, suggesting that at low speeds Arctic vessels are investing engine energy into breaking and moving ice as well as forward movement. This serves to construct a bound-ing range of expected relationships between speed and load, pending additional empirical data for Arctic ship operations. Figure 5b shows that, based on historical average speeds, ships operating in the Arctic are running at loads between 10 % (speed α load3, light grey) and 40 % (speed α load,
dark grey) for IDN up to approximately 16. Although a spe-cific IDN is difficult to represent visually (depending on ship class, ice type and ice surface coverage), waters with thinner and fragmented ice with more than 70 % open water would
have an IDN of ∼11 for class B ship and an IDN of ∼17 for class A ships (Timco and Johnson, 2003). For conditions of IDN<= 16 the average BC emissions are 30–100 % larger (using data from Fig. 3b) than they would be under maximum load assuming the engines are not re-tuned for the lower en-gine loads.
We point out that this analysis is based on the limited his-torical data and that as ice conditions change, future Arc-tic ships may not have the same speed, engine or design configurations as the current Arctic fleet. For example, So-manathan et al. (2009) predicted, for an Arctic-class cargo vessel, an average operating load of 75 % using the IDN sys-tem for 1999–2003 North West Passage ice conditions. Eide et al. (2010) predicted the range of speeds across the Arc-tic in 2030 for an ArcArc-tic-class cargo vessel and estimated that high speeds (approx. 75–100 % load) would be possible for almost all of an Arctic transit through the Northern Sea Route. Polar and North West Passage transits for the same vessel would span loads from approximately 10–100 % with the lower load range required for approximately 20–50 % of the distance of the transit.
It is apparent from the available data that ships currently operating in the Arctic will have highly variable engine load profiles, due to ice conditions and ship activity. If engine load profiles are indeed so variable, predicting how de-rating or speed limits may affect BC emissions is difficult for Arctic operations. It is apparent that for ships operating in the Arctic that are not involved in ice-breaking activities, engine loads are≤40 % and as such BC emissions are larger than they oth-erwise would be for a re-tuned engine or an engine operating at higher loads.
4 Fuel quality
The effect of fuel quality or speed on BC emissions is more complex than fuel-emissions relationships for other shipping emissions. In this section we investigate the effect of fuel quality on BC emission factors. Given that all regulations on fuel quality are currently motivated by reductions in SO2and
particulate sulfate, is there a co-benefit reduction in BC, or an unintended increase?
4.1 Literature review
The relationship between sulfur emissions and fuel quality is explicitly understood. SO2 emissions are directly related to
FS(e.g. Williams et al., 2009) and primary particulate sulfate
is linked to FSand engine load (Lack et al., 2009; Petzold et
Table 3.Studies on the effect of fuel quality found in literature.
Study (#) Low Quality Fuel High Quality Fuel Measurement Type Reference Type, FS(%), Ash (%) Type, FS( %), Ash (%)
1 HFO 2.2 0.03 MGO <0.01 <0.01 EC – TOA MAN-Diesel-SE (2010) 2 HFO 0.9 0.02 LFO <0.05 <0.01 EC – TOA Ristimaki et al. (2010) 3 HFO 0.9 0.02 LFO <0.05 <0.01 BC – FSN Ristimaki et al. (2010) 4 HFO 2.4 0.07 LFO <0.05 <0.01 EC – TOA Ristimaki et al. (2010) 5 HFO 2.4 0.07 LFO <0.05 <0.01 BC – FSN Ristimaki et al. (2010) 6 HFO 2.2 0.02 MDO 0.1 0.001 BC – Filter Petzold et al. (2011a) 7 HFO 2.2 0.02 Biodiesel – Palm Oil <0.01 0.002 BC – Filter Petzold et al. (2011a) 8 HFO 2.2 0.02 Biodiesel – Animal Fat <0.01 0.002 BC – Filter Petzold et al. (2011a) 9 HFO 2.2 0.02 Biodiesel – Soya Bean <0.1 <0.001 BC – Filter Petzold et al. (2011a) 10 HFO 2.2 0.02 Biodiesel – Sunflower Oil <0.01 <0.001 BC – Filter Petzold et al. (2011a) 11 HFO 2.2 0.02 MDO 0.1 0.001 EC – TOA Petzold et al. 92011a) 12 HFO 2.2 0.02 Biodiesel – Palm Oil <0.01 0.002 EC – TOA Petzold et al. (2011a) 13 HFO 2.2 0.02 Biodiesel – Animal Fat <0.01 0.002 EC – TOA Petzold et al. (2011a) 14 HFO 2.2 0.02 Biodiesel – Soya Bean <0.1 <0.001 EC – TOA Petzold et al. (2011a) 15 HFO 2.2 0.02 Biodiesel – Sunflower Oil <0.1 <0.001 EC – TOA Petzold et al. (2011a) 16,17a HFO 3.15 0.07 MDO 0.07 <0.01 rBC Lack et al. (2011) 18,19 HFO 0.83 0.04 MGO 0.1 <0.01 BC – FSN Sarvi et al. (2008b)
aIncludes effects of engine load changes.
These organic particles contain large molecular weight aro-matic hydrocarbons and may cause significant health effects (Marin-Morales et al., 2009). Lack et al. (2011) also suggest that BC emissions decline as fuel quality improves.
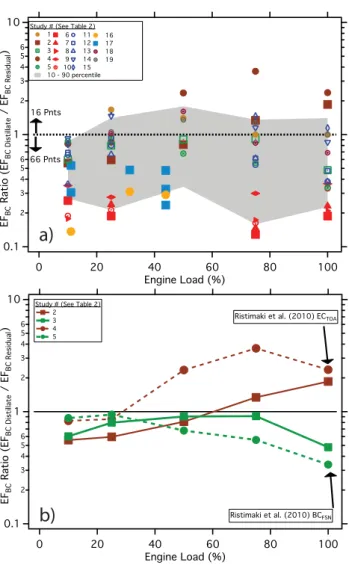
A review of literature reporting on the effect of fuel quality on EFBCis shown in Table 3 and Fig. 6. These studies include
EFBCmeasurements from in-use marine engines, full, and
re-duced size test bed engines and provide converging evidence that improved fuel quality is linked to reductions in EFBC
for marine diesel engines. This is consistent with the well-understood relationship between fuel quality and EFBC for
on-road diesel engines (Maricq, 2007). Figure 6a shows the ratio between EFBCfor distillate fuels (EFBC−Distillate) and
the EFBC for residual fuels (EFBC−Residual) as the same
engines switched fuels. A ratio<1 indicates a decrease in EFBC, while a ratio>1 indicates an increase in EFBCas fuel
quality improves. At 100 % engine load the EFBCdecreases
by an average of 30 % between residual and distillate fuels. EFBCreduction is at most 80 % for the data presented.
There are some irregularities within the data presented that highlight the importance of careful measurement protocols. Figure 6 includes a study by an engine manufacturer (Risti-maki et al., 2010) where EFEC-TOAwas measured and shows
a dramatic EFEC-TOA increase as fuel quality improved,
op-posite to the majority of the trends observed in Fig. 6a. Ris-timaki et al. (2010) cite heavy metal oxidation of BC as the reason for reduced BC emissions from residual fuel. In what is a problematic inconsistency, that study also reported filter smoke number (FSN) trends opposite to their ECTOAtrends.
We find that all derived EFBC−FSNof Ristimaki et al. (2010)
actually decrease for distillate fuel, in contrast to their
mea-sured EFEC-TOA(Fig. 6b). Given the acceptable correlation in
absolute EFBC−FSNand EFEC-TOAfrom Fig. 1c, it is difficult
to assess which of the trends is in error. When we remove the Ristimaki et al. (2010) data from the statistical analysis the average EFBC decreases 45 % (at 100 % load). The 10th
and 90th percentile ranges do not change significantly, ex-cept for the 90th percentile range at high loads (Fig. 6b). The study of Petzold et al. (2011a) measured both EFBC−Filterand
EFEC-TOA. EFBC−Filterdata show a consistent 80 % decrease
when shifting from residual to distillate and bio fuels. How-ever the EFEC-TOAdata show 20–60 % decreases for MGO,
palm oil and animal fat bio-diesel whereas the soya bean and sunflower oil biodiesel show increases in EFEC-TOA of
20–50 % for intermediate loads. These data suggest some in-consistency between BCFilterand ECTOAmeasurements. We
suggest that ECTOAmeasurements are not as reliable
mea-surement tool as the others reviewed here. This is possibly due to organic particle biases discussed in Sect. 2.
a)
b)
Fig. 6. (a)The change in EFBCas fuel quality improves (as a
ra-tio between EFBC-Distillateand EFBC-Residual). 10th–90th percentile range of data shown as shaded region,(b)Illustration of measure-ment inconsistency.
We also note that the effect of speed on EFBC emissions
was removed from the Lack et al. (2011) data (see Ap-pendix Fig. A1 and text for details). The EFBC before and
after this correction is included in Fig. 6.
4.2 Evidence from field measurements
A link between fuel quality (using FS as a proxy) and
EFBC is evident within the data of Lack et al. (2008b) and
Buffaloe et al. (2012). In the waters off California, FS is
regulated to <0.5 % for marine distillate oil (MDO) and
<1.5 % for marine gas oil (MGO) (CARB, 2009a). Buf-faloe et al. (2012) measured EFBCfor 41 ships in compliance
with the Californian FS regulations (FS= 0.4±0.3 %,
aver-age load = 10±5 %). These EFBC data are 57 % lower than
the EFBC measured by Lack et al. (2008b) in the Gulf of
Mexico and Houston where no FSregulations exist (40 ships,
Fig. 7.EFBC(for SSD ships) in the California and the Gulf of Mex-ico/Houston coastal areas (Buffaloe et al., 2012).
FS= 1.6±0.7 %, load = 44±28 %) (Fig. 7). If we consider the
trend of increased EFBC with engine load from Sect. 3, we
might expect, ignoring any competing factors, that BC emis-sions from California would be higher than for Texas. That EFBCare lower for California is suggestive of a link between
EFBCand fuel quality. We suspect that the variability in
ves-sel and engine type and operating conditions in the field study of Lack et al. (2009) swamped the ability to observe a link between EFBCand FS.
5 Efficacy of scrubbers for BC removal
Exhaust scrubbing technology can be applied to marine diesel engines to reduce emissions, particularly gas phase emissions of SOx, NOx. With a scrubber onboard, a ship can
continue to consume high FS (i.e. lower cost) fuel and yet
comply with FSregulations (e.g. Hamworthy, 2011).
Scrub-bers can use wet or dry physical scrubbing or chemical ad-sorption to remove combustion products. Removal of parti-cles is possible however the removal rates by species are un-certain. What is the scrubbing efficacy of BC particles? How do BC removal rates compare to the effect of shifting from residual to distillate fuels?
5.1 Literature review
Current studies show scrubbers to be efficient at reducing the mass of PM emissions from anywhere from 25 to 98 % (Kircher, 2008; Marine-Exhaust-Solutions, 2006; Ritchie et al., 2005; Andersson and de Vries, 2009). These estimates are based on different particle mass diameter cut offs (<= 1, 2.5 or 10 µm [PM1, PM2.5, PM10]). Despite the potential to
Fig. 8.Comparison of the range of EFBCchanges due to fuel quality
improvement (grey) and exhaust scrubbing (black).
particles having mass median diameters of≤0.2 µm (Lack et al., 2011; Lack et al., 2009; Petzold et al., 2011a); and (iii) The wet scrubbing efficiency for BC is uncertain because BC particles in engine exhaust can be hydrophobic or hy-drophilic, depending on the mixing state and water uptake ability of co-emitted species.
In a review of sea water scrubbing efficacy Corbett et al. (2010b) concluded that PM2.5 removal was likely
75±15 % and inferred from this review (mostly from the measurements from Ritchie et al., 2005) that BC removal was likely 40 (+10,−15) %. The study of Ritchie et al. (2005) showed that the PM reductions for the scrubber used were 98 % for PM2, 74 % for PM1.5, 59 % for PM1 and 45 %
for PM0.05. Given the common mass median diameter range
for BC (0.2 µm), a likely BC scrubbing efficiency of around 45–50 % is inferred from these results. Andersson and de Vries (2009)3showed ECTOAreductions of 55 % for low
sul-fur diesel and 70 % for 1.5 % FSdiesel, indicating a potential
increase in scrubbing efficiency when the higher FS fuel is
used. This can be explained by the formation of hygroscopic particulate sulfates that are internally mixed with the BC. It must be noted that Andersson and de Vries (2009) used a light duty diesel engine and fuel doped with an organic sulfur compound to produce the high sulfur fuel. Based on current studies, scrubbers can remove BC from the exhaust of marine diesel engines between 25–70 %, dependent on FSand
scrub-ber design (shown in Fig. 8 as dark shaded bar in comparison to the effects of fuel quality changes on EFBC). There is no
data showing scrubber BC removal rates as a function of en-gine load and so we assume constant removal for illustrative purposes. This removal rate is within the ranges presented for fuel switching from residual to distillate fuels, and BC control may be more consistently effective across transient engine loads.
3Report and data used with permission from Sustainable
Mar-itime Solutions
6 Implications for regulation
Evaluation of literature data on the emissions of BC from marine diesel engines (Swects. 3, 4, and 5) allows us to as-sess the effects of current or potential regulation on ships. For example, ship speed reductions can reduce fuel consump-tion and some emissions significantly. Many shipping com-panies are using ship speed reductions to reduce fuel con-sumption and costs. Will a ship speed regulation provide any benefit by locking in the voluntary speed reductions already taking place? Fuel sulfur limits are regulated in certain re-gions of the word to reduce the negative air quality impacts of ship emissions. Stricter global regulations will come into force within a few years. Will these regulations effectively reduce BC emissions, without other measures like re-tuning engines? The concern of the sensitivity of the Arctic envi-ronment to a potential increase in shipping has triggered dis-cussions on possible regulatory action for that region. What might the best regulatory actions be for reducing, or mini-mizing the emission of BC in the Arctic?
6.1 Ship engine load and black carbon
Regulations of ship speed for reductions in fuel consumption may be accompanied by increases in BC unless automatic tuning or engine de-rating are employed. When ships reduce load from 100 % to 25 % without retuning the engine, an in-crease in EFBCof a factor of 3 occurs. At loads<25 % EFBC
increase significantly (up to 6.5 times). This EFBCincrease
is a result of when engines are operated at a loading condi-tion outside of the tuned load. When the EFBCincreases are
combined with the reduced fuel consumption associated with lower loads, absolute emissions of BC increase by 15–40 % down to 25 % load. Below 25 % load, absolute emissions of BC increase by 100–150 %.
Technology is emerging on newer ships where electroni-cally controlled engines can be optimally tuned in real time for the current load (between 30 and 100 % load, Brown, 2009). In addition, engines can be re-tuned for operation at specific loads (Wettstein and Brown, 2008). Under these optimal tuning conditions fuel efficiency is maximized and it is likely that EFBC would remain approximately constant
across a wide load range. Assuming an optimum EFBCacross
all loads (i.e. EFBCof unity: using the convention of EFBCat
100 % load = 1) absolute BC reductions equivalent of the fuel savings are achievable.
6.2 Fuel quality and black carbon
The balance of evidence suggests that shifting from high sul-fur, high ash residual fuels to low sulsul-fur, low ash distillate fuels will decrease BC emissions. Up to 80 % reductions in EFBChave been observed for such fuel quality shifts within
several studies. From the data presented, an average EFBC
re-duction of 30 % at 100 % engine load is observed. It is there-fore likely that FSregulations, such as those implemented in
the Baltic and North Seas (IMO, 2005, 2007) and California (CARB, 2009a), and those to be introduced for North Amer-ica (IMO, 2009) and globally (IMO, 2010b), will reduce BC emissions. In addition, the call by the European Parliament for the IMO to ban HFO in the Arctic (to eliminate effects of spilled fuel) is strengthened as this will likely reduce and/or minimize BC emissions in the Arctic (EU, 2011). Current regulation on fuel quality addresses FS only. From the
re-viewed literature, it was not possible to determine whether FS, or another component of fuel quality, such as ash,
aro-matic hydrocarbon or heavy metal content, was responsible for the changes in EFBC. From the data presented, we are
un-able to conclude if heavy metals catalyze the combustion of BC.
6.3 Scrubbers and black carbon
Scrubbers that reduce emissions of SO2to levels equivalent
to consuming regulatory-compliant low sulfur fuel offer an alternative to using distillate fuels. In addition to reductions in SO2emissions, it is apparent, from the very limited data
available, that BC removal by scrubbers is between 40–70 %, dependent on FS. While more work is needed to characterize
scrubber BC control efficacy across varying loads, scrubbing residual high FSfuel appears to provide similar BC reduction
rates to switching from residual to distillate fuels.
6.4 Regional regulatory combination: arctic shipping
Given the sensitive eco-systems of the Arctic, careful con-sideration is being given to minimizing the impact of Arctic shipping. Emissions of BC from ships have been identified as one of a number of priority BC mitigation opportunities for the Arctic (Arctic-Council, 2010; Rosenthal and Watson, 2011). Distillate fuels already required in the Antarctic could become required in the Arctic for reasons unrelated to BC and climate forcing (e.g. elimination of residual oil spills). It is apparent, however that the use of distillate fuel may also reduce BC emissions, therefore providing a co-benefit for the Arctic. If Arctic shipping routes evolve into commonly used alternatives to the traditional Panama and Suez canal routes for transits from Europe to Asia and North America to Asia (e.g. Somanathan et al., 2009), activity of ships con-suming residual fuels is likely to increase in the Arctic. The use of distillate fuels by these ships in the Arctic (similar to the Antarctic) would reduce BC emissions that would
re-sult from using residual fuel. Policies requiring scrubbing of residual or distillate fuel exhaust would provide alternate or additional options for BC reductions.
Arctic ship speed limits might serve to reduce the proba-bility of whale strikes, reduce navigation hazards, and will reduce some emissions (e.g. CO2). Ship speed-engine load
relationships may be atypical under ice-safe operations com-pared to ice-free voyages and so it is difficult to assess the characteristics of current or future engine loads. Under ice breaking conditions engine load is likely near a maximum while ships moving slowly through loose ice flows are likely running at low engine loads and may be emitting up to twice as much BC per nautical mile of travel that is estimated using current methodologies (Corbett et al., 2010a) (assuming en-gines are tuned for maximum load ratings). For the next few decades it is likely that the transit paths of ships in the Arc-tic would encounter a variety of ice conditions (and require a range of engine load). De-rating may not be a viable op-tion for the variability in lower loads possible. BC emission reduction strategies may require an automatic tuning technol-ogy or assessment of each ship’s load distribution history to ensure the engine can be optimally tuned. If there is so much variability in the engine load distribution as to make a spe-cific tuning below maximum-load rating unviable, exhaust scrubbing or consumption of higher quality fuel would be effective options for controlling BC under speed-restriction policies.
7 Summary
Emissions of BC are of concern from both an air quality and climate (particularly Arctic climate) perspective. The Inter-national Maritime Organization (IMO) has begun to investi-gate the impacts of BC emitted from shipping activity and tasked an IMO subcommittee with providing more details on the definition of BC, measurement methods and possible strategies for BC mitigation. This review addressed the defi-nition, measurement methods and effects of speed, fuel qual-ity and exhaust gas scrubbing on BC emissions from ships.
We find that BC emission factors measured by photo-acoustic, filter-based absorption (PSAP and MAAP) and laser-induced incandescence are consistent with one an-other on an absolute level. Corrected filter smoke number (FSN) BC also show good correlation with thermal optical reflectance-measured EC, however the TOA method shows inconsistent results to both BCFSNand BCFilterfor two
stud-ies.
BC emission factors increase as engine load decreases and absolute emissions of BC increase up to 100 % at low loads when the average EFBC is combined with the reduced fuel
consumption that results from reduced ship speeds.
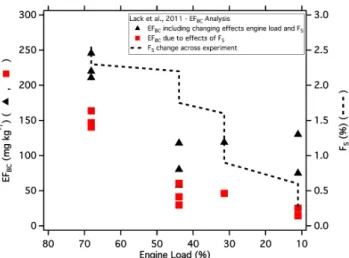
Fig. A1.EFBCchanges with engine load (and FS) from the study of
Lack et al. (2011). Red data has the effects of engine load removed, using the average EFBCengine load relationship from Sect. 3 (grey
line).
for engine de-rating the most effective measures for reduc-ing BC from Arctic shippreduc-ing would be through the use of exhaust scrubbing or a switch to higher quality fuel.
Based on available literature, improvements to fuel quality (from residual to distillate fuels) can reduce BC emissions by an average of 30 % and potentially up to 80 %. More research is required to determine how each component of fuel qual-ity affects BC emissions. Although data are very limited, ex-haust scrubbing systems likely remove BC with an efficiency of 25–70 %, dependent on fuel sulfur content. More research is needed by scrubbing manufacturers to understand the re-moval of particulate matter by size and composition.
Appendix A
The study of Lack et al. (2011) measured EFBC changes as
a large container ship switched from low to high quality fuel and slowed. Using the average EFBC with engine load
rela-tionship (EFBC−Load) derived from literature data in Sect. 3,
the effect of speed on EFBCemissions was removed from this
data. To do this we divide the Lack et al. (2011) data at 70, 45, 30 and 10 % load by the normalized average EFBC−Load
value for that load. The results of which are presented as the red data in Appendix Fig. 1. We then divide the average of the corrected EFBCat lower sulfur by the average EFBCat high
sulfur to determine the EFBCreduction due to the change in
FS.
Acknowledgements. Funded by NOAAs climate program. Thanks to Christopher Cappa and Gina Buffaloe (University of California, Davis), Donald Gregory (Sustainable Maritime Solutions2), Jean deKat (AP Moller-Maersk2), and Daniel Murphy, A. R. Ravis-hankara and Eric Williams (NOAA) for contributing data and/or discussions.
Edited by: W. Birmili
References
Agrawal, H., Malloy, Q. G. J., Welch, W. A., Wayne Miller, J., and CockerIII, D. R.: In-use Gaseous and Particulate Matter Emis-sions from a Modern Ocean Going Container Vessel, Atmos. Environ., 42, 5504–5510, doi:10.1016/j.atmosenv.2008.02.053, 2008.
Agrawal, H., Welch, W. A., Henningsen, S., Miller, J. W., and Cocker III, D. R.: Emissions from Main Propulsion Engine on a Container Ship at Sea, J. Geophys. Res., 115, D23205, doi:10.1029/2009jd013346, 2010.
American-Bureau-of-Shipping: Notes on Heavy Fuel Oil: http://www.eagle.org/eagleExternalPortalWEB/ ShowProperty/BEARepository/News&Events/Publications/ ABSInternationalDirectory, 2001.
AMSA: Arctic Marine Shipping Assessment 2009 Re-port: http://www.pame.is/images/stories/PDF Files/ AMSA 2009 Report 2nd print.pdf, 2009.
Andersson, J. and de Vries, S.: Results of the Evaluation of an Ex-haust Scrubber: A Screening Report for Sustainable Maritime Solutions, Ricardo, UK, 33, 2009.
Andreae, M. O. and Gelencs´er, A.: Black carbon or brown car-bon? The nature of light-absorbing carbonaceous aerosols, At-mos. Chem. Phys., 6, 3131–3148, doi:10.5194/acp-6-3131-2006, 2006.
Arctic-Council: Final Report: Meeting of Deputy Minis-ters (27 May 2010): http://arctic-council.org/filearchive/ DMM27May2010FinalReport.pdf, 2010.
Arnott, W. P., Hamasha, K., Moosmuller, H., Sheridan, P. J., and Ogren, J. A.: Towards Aerosol Light-Absorption Measurements with a 7-Wavelength Aethalometer: Evaluation with a Photoa-coustic Instrument and 3-Wavelength Nephelometer, Aerosol Sci. Tech., 39, 17–29, 2005.
Arnott, W. P., Walker, J. W., Moosm¸ller, H., Elleman, R. A., Jons-son, H. H., Buzorius, G., Conant, W. C., Flagan, R. C., and Se-infeld, J. H.: Photoacoustic insight for Aerosol Light Absorption Aloft from Meteorological Aircraft and Comparison with Parti-cle Soot Absorption Photometer Measurements: DOE Southern Great Plains Climate Research Facility and the Coastal Stratocu-mulus Imposed Perturbation Experiments, J. Geophys. Res., 111, D05S02, doi:10.1029/2005jd005964, 2006.
Bond, T. C., Anderson, T. L., and Campbell, D.: Calibration and Intercomparison of Filter-Based Measurements of Visible Light Absorption by Aerosols, Aerosol Sci. Tech., 30, 582–600, 1999. Bond, T. C., and Bergstrom, R. W.: Light Absorption by Carbona-ceous Particles: An Investigative Review, Aerosol Sci. Tech., 40, 27-67, 2006.
Physical Model, Aerosol Sci. Technol., 42, 930–948, doi:10.1080/02786820802360690, 2008.
Brown, D.: Helping Shipowners Cut Fuel Bills with Wartsila Low-Speed Engines, Wartsila Techn. J. 01, 34–37, 2009.
Buffaloe, G., Cappa, C., Williams, E., Coffman, D. J., Hayden, K., Lack, D. A., Lerner, B., Li, S.-M., Massoli, P., Nuaanman, I., Onasch, T. B., and Quinn, P. K.: Particulate Emissions from Commercial Shipping in the Califronia Fuel Quality Regulated Zone, J. Geophys. Res., in preparation, 2012.
Buhaug, Ø., Corbett, J. J., Endresen, Ø., Eyring, V., Faber, J., Hanayama, S., Lee, D. S., Lee, D., Lindstad, H., Mjelde, A., P˚alsson, C., Wanquing, W., Winebrake, J. J., and Yoshida, K.: Second IMO GHG study 2009, International Maritime Organi-zation, London, UK, 129, 2009.
Burtscher, H.: Physical Characterization of Particulate Emissions from Diesel Engines: A Review, J. Aero. Sci, 36, 896–932, doi:10.1016/j.jaerosci.2004.12.001, 2005.
Cappa, C. D., Williams, E., Buffaloe, G., Coffman, D. J., Hayden, K., Lack, D. A., Lerner, B., Li, S.-M., Massoli, P., Nuaanman, I., Onasch, T. B., and Quinn, P. K.: The Influence of Operating Speed on Gas and Particle-Phase Emissions from the R/V Miller Freeman, Environ. Sci. Technol., under review, 2012.
CARB: Final Regulation Order. Fuel Sulfur and Other Operational Requirments for Ocean-Going Vessels Within California Waters and 24 Nautical Miles of the California Baseline, California Air Resources Board, 2009a.
CARB: Vessel Speed Reduction for Ocean-going Vessels: http: //www.arb.ca.gov/ports/marinevess/vsr/vsr.htm, 2009b. Christian, V. R., Knopf, F., Jaschek, A., and Schindler, W.:
Mess-methodik der Bosch-Zahl mit erhohter Empfindlichkeit, Mo-tortech. Z., 54, 16–22, 1993.
Corbett, J. J., Winebrake, J. J., Green, E. H., Kasibhatla, P., Eyring, V., and Lauer, A.: Mortality from Ship Emissions: A Global Assessment, Environ. Sci. Technol., 41, 8512–8518, doi:10.1021/es071686z, 2007.
Corbett, J. J., Wang, H., and Winebrake, J. J.: The Effectiveness and Costs of Speed Reductions on Emissions from Interna-tional Shipping, Trans. Res. D: Trans. Environ., 14, 593–598, doi:10.1016/j.trd.2009.08.005, 2009.
Corbett, J. J., Lack, D. A., Winebrake, J. J., Harder, S., Silber-man, J. A., and Gold, M.: Arctic Shipping Emissions Invento-ries and Future Scenarios, Atmos. Chem. Phys., 10, 9689–9704, doi:10.5194/acp-10-9689-2010, 2010a.
Corbett, J. J., Winebrake, J. J., and Green, E. H.: An Assessment of Technologies for Treducing Regional Short-Lived Climate Forcers Emitted by Ships with Implications for Arctic Shipping, Carb. Manage., 1, 207–225, doi:10.4155/cmt.10.27, 2010b. Cross, E. S., Onasch, T., Ahern, A. T., Wrobel, W., Slowik, J.,
Olfert, J., Lack, D. A., Massoli, P., Cappa, C. D., Schwarz, J. P., et al.: Soot Particle Studies – Instrument Inter-Comparison – Project Overview, Aerosol Sci. Tech., 44, 592–611, 2010. deKat, J.: (Super) Slow Steaming: The Maersk
Expe-rience: http://www.transportenvironment.org/events/ seminar-slow-steaming-and-speed-limits-shipping, 2011. Eide, L. I., Eide, M. S., and Endresen, Ø.: Shipping Across the
Arctic Ocean: A Feasible Option in 2030–2050 as a Result of Global Warming?: http://www.dnv.com/resources/position papers/shipping arctic.asp, 2010.
EU: A sustainable EU policy for the High North, European Par-liament, 2009/2214(INI), 2011.
Eyring, V., Kohler, H. W., van Aardenne, J., and Lauer, A.: Emis-sions from International Shipping: 1. The Last 50 Years, J. Geo-phys. Res., 110, D17305, doi:10.1029/2004JD005619, 2005. Eyring, V., Isaksen, I. S. A., Berntsen, T., Collins, W. J., Corbett,
J. J., Endresen, O., Grainger, R. G., Moldanova, J., Schlager, H., and Stevenson, D. S.: Transport Impacts on Atmosphere and Cli-mate: Shipping, Atmos. Environ., 44, 4735–4771, 2010. Flanner, M. G., Zender, C. S., Randerson, J. T., and Rasch,
P. J.: Present-day Climate Forcing and Response from Black Carbon in Snow, J. Geophys. Res., 112, D11202, doi:10.1029/2006JD008003, 2007.
Hamworthy: Exhaust Gas Cleaning Systems, http://www. hamworthy.com/PageFiles/1774/ExhaustGasCleaningSystems. pdf, 2011.
Hansen, J. and Nazarenko, L.: Soot Climate Forcing Via Snow and Ice Albedos, Proc. Natl. Acad. Sci., 101, 423–428 doi:10.1073/pnas.2237157100, 2004.
Harvald, S.: Prediction of Power of Ships, Department of Ocean En-gineering, Technical University of Denmark, Lyngby, Denmark, 1977.
IMO: New Rules to Reduce Emissions from Ships Enter Into Force: http://www.imo.org/blast/mainframe.asp?topic id=1018\
&doc id=4884, 2005.
IMO: North Sea SECA in effect from 22 November 2007: http://www.imo.org/inforesource/mainframe.asp?topic id= 1472\&doc id=8719, 2007.
IMO: Amendments to MARPOL Annex VI, Amendments to the NOx Technical Code, IMO MEPC 58, London, UK, 2008. IMO: Proposal to Designate an Emission Control Area for Nitrogen
Oxides, Sulphur Oxides and Particulate Matter. Submitted by the United States and Canada., IMO MEPC 59, 2009.
IMO: Emissions Inventory and Analysis of Impacts of Short-Lived Climate Forcing Aerosols from International Shipping Activity in the Arctic, 15th Session of the Bulk Liquids and Gases Sub-Committee of the International Maritime Organisation, London, UK, 2010a.
IMO: Air Pollution from Ships Cut with Entry Into Force of MAR-POL Amendments: http://www.imo.org/newsroom/mainframe. asp?topic id=1859\&doc id=13309, 2010b.
IMO: Report of the Marine Environement Protection Committee on its Sixty-Second Session, IMO MEPC 62, London, UK, 2011a. IMO: Definition and Measurement of Black Carbon in
Interna-tional Shipping, 16th Session of the Bulk Liquids and Gases Sub-Committee of the International Maritime Organisation, London, UK, 2011b.
IMO: Resolution MEPC 203 (62). 2011 Amendments to MAR-POL Annex VI: Energy Efficiency, IMO MEPC 62, London, UK, 2011c.
IMO: Development of a Mandatory Code for Ships Operating in Polar Waters: Report of the correspondence group, Interna-tional Maritime Organisation: Sub-Committee on Ship Design and Equipment, 56th Session, London, UK, 2012a.
IMO: Development of a Mandatory Code for Ships Operating in Po-lar Waters: Information on Compression in a Sea Ice Field, Inter-national Maritime Organisation: Sub-Committee on Ship Design and Equipment, 56th Session, London, UK, 2012c.
ISO: Petroleum Products – Fuels (class F) – Specifications of Ma-rine Fuels; ISO 8217: 1987(E), Geneva, Switzerland, 15 April, 1987.
Jayaram, V., Agrawal, H., Welch, W. A., Miller, J. W., and Cocker, D. R.: Real-Time Gaseous, PM and Ultrafine Particle Emissions from a Modern Marine Engine Operating on Biodiesel, Environ. Sci. Technol., 45, 2286–2292, doi:10.1021/es1026954, 2011. Kasper, A., Aufdenblatten, S., Forss, A., Mohr, M., and Burtscher,
H.: Particulate Emissions from a Low-Speed Marine Diesel En-gine, Aerosol Sci. Tech., 41, 24–32, 2007.
Kircher, D.: Holland America Line Sea Water Scrubber Demonstra-tion Project. Presented at: Faster Freight, Cleaner Air Northwest Conference, Seattle, WA, USA, 2008.
Kondo, Y., Sahu, L., Kuwata, M., Miyazaki, Y., Takegawa, N., Moteki, N., Imaru, J., Han, N. S., Nakayama, T., Kim-Oanh, N. T., et al.: Stabilization of the Mass Absorption Cross Sec-tion of Black Carbon for Filter-Based AbsorpSec-tion Photome-try by the Use of a Heated Inlet, Aerosol Sci. Tech., 43, doi:10.1080/02786820902889879, 2009.
Kondo, Y., Sahu, L., Moteki, N., Khan, F., Takegawa, N., Liu, X., Koike, M., and Miyakawa, T.: Consistency and Traceabil-ity of Black Carbon Measurements Made by Laser-Induced In-candescence, Thermal-Optical Transmittance, and Filter-Based Photo-Absorption Techniques, Aerosol Sci. Tech., 45, 295–312, doi:10.1080/02786826.2010.533215, 2011.
Lack, D., Lovejoy, E., Baynard, T., Pettersson, A., and Ravis-hankara, A.: Aerosol Absorption Measurement Using Photoa-coustic Spectroscopy: Sensitivity, Calibration, and Uncertainty Developments, Aerosol Sci. Tech., 40, 697–708, 2006.
Lack, D. A., Cappa, C. D., Covert, D. S., Baynard, T., Massoli, P., Sierau, B., Bates, T. S., Quinn, P. K., Lovejoy, E. R., and Ravishankara, A. R.: Bias in Filter-Based Aerosol Light Absorp-tion Measurements Due to Organic Aerosol Loading: Evidence from Ambient Measurements, Aerosol Sci. Tech., 42, 1033– 1041, 2008a.
Lack, D. A., Lerner, B., Granier, C., Baynard, T., Lovejoy, E. R., Massoli, P., Ravishankara, A. R., and Williams, E.: Light Ab-sorbing Carbon Emissions from Commercial Shipping, Geophys. Res. Lett., 35, L13815, doi:10.1029/2008GL033906, 2008b. Lack, D. A., Corbett, J. J., Onasch, T. B., Lerner, B., Massoli, P.,
Quinn, P. K., Bates, T. S., Covert, D., Coffman, D. J., Sierau, B., et al.: Particulate Emissions from Commercial Shipping. Chemical, Physical and Optical Proprties, J. Geophys. Res., 114, D00F04, doi:10.1029/2008/JD011300, 2009.
Lack, D. A., Cappa, C. D., Langridge, J., Bahreini, R., Buffaloe, G., Brock, C., Cerully, K., Coffman, D., Hayden, K., Holloway, J., et al.: Impact of Fuel Quality Regulation and Speed Reductions on Shipping Emissions: Implications for Climate and Air Quality, Environ. Sci. Technol., 45, 9052–9060, doi:10.1021/es2013424, 2011.
Lauer, A., Eyring, V., Corbett, J. J., Wang, C., and Winebrake, J. J.: Assessment of Near-Future Policy Instruments for Ocean-going Shipping: Impact on Atmospheric Aerosol Burdens and the Earth’s Radiation Budget, Environ. Sci. Technol., 43, 5592– 5598, doi:10.1021/es900922h, 2009.
MAN: Basic Principles of Ship Propulsion, 2004.
MAN-Diesel-SE: Operation on Low-Sulphur Fuels. MAN B&W Two-Stroke Engines, MAN B&W, Copenhagen, 1–24, 2010. Maricq, M. M.: Chemical Characterization of Particulate Emissions
from Diesel Engines: A Review, J. Aero. Sci, 38, 1079–1118, doi:10.1016/j.jaerosci.2007.08.001, 2007.
Marin-Morales, M. A., Leme, D. M., and Mazzeo, D. E. C.: Poly-cyclic Aromatic Hydrocarbons: Pollution, Health Effects and Chemistry, edited by: Haines, P. A. and Hendrickson, M. D., Nova Science Publishers, 361 pp., New York, USA, 2009. Marine-Exhaust-Solutions: Scrubber Development Beats
Regulations in Environmental Stakes: http://www. marineexhaustsolutions.com/mediacentre det.asp?id=61, 2006. McCallum, J.: Safe Speed in Ice – An analysis of Transit Speed and
Ice decision Numerals, Transport Canada, 1996.
Moosmuller, H., Chakrabarty, R. K., and Arnott, W. P.: Aerosol Light Absorption and its Measurement: A Re-view, J. Quant. Spectrosc. Rad. T., 110, 844–878, doi:10.1016/j.jqsrt.2009.02.035, 2009.
Moteki, N. and Kondo, Y.: Dependence of Laser-Induced Incandes-cence on Physical Properties of Black Carbon Aerosols: Mea-surements and Theoretical Interpretation, Aerosol Sci. Tech., 44, 663–675, doi:10.1080/02786826.2010.484450, 2010.
Myhre, G., Shine, K. P., Radel, G., Gauss, M., Isaksen, I. S. A., Tang, Q., Prather, M. J., Williams, J. E., van Velthoven, P., Dessens, O., Koffi, B., Szopa, S., Hoor, P., Grewe, V., Borken-Kleefeld, J., Berntsen, T. K., and Fuglestvedt, J. S.: Radiative Forcing Due to Changes in Ozone and Methane Caused by the Transport Sector, Atmos. Environ., 45, 387–394, doi:10.1016/j.atmosenv.2010.10.001, 2011.
Nakayama, T., Kondo, Y., Moteki, N., Sahu, L. K., Kinase, T., Kita, K., and Matsumi, Y.: Size-Dependent Correction Factors for Ab-sorption Measurements using Filter-based Photometers: PSAP and COSMOS, J. Aerosol. Sci., 41, 333–343, 2010.
NOAA: Compliance Guide for Right Whale Ship Strike Reduction Rule, National Marine Fisheries Service, 2008.
Northrop, W. F., Bohac, S. V., Chin, J.-Y., and Assanis, D. N.: Comparison of Filter Smoke Number and Elemental Car-bon Mass From Partially Premixed Low Temperature Com-bustion in a Direct-Injection Diesel Engine, Journal of En-gineering for Gas Turbines and Power, 133, 102804–102806, doi:10.1115/1.4002918, 2011.
Petzold, A., Feldpausch, P., Fritzsche, L., Minikin, A., Lauer, A., and Bauer, H.: Particle Emissions from Ship Engines, Eu-ropean Aerosol Conference, Budapest, Hungary, http://www. scientificcommons.org/17769664, 2004.
Petzold, A., Weingartner, E., Hasselbach, J., Lauer, A., Kurok, C., and Fleischer, F.: Physical Properties, Chemical Composition, and Cloud Forming Potential of Particulate Emissions from a Marine Diesel Engine at Various Load Conditions, Environ. Sci. Technol., 44, 3800–3805, 2010.
Petzold, A., Lauer, P., Fritsche, U., Hasselbach, J., Lichtenstern, M., Schlager, H., and Fleischer, F.: Operation of Marine Diesel En-gines on Biogenic Fuels: Modification of Emissions and Result-ing Climate Effects, Environ. Sci. Technol., 45, 10394–10400, doi:10.1021/es2021439, 2011a.