PRINT ISSN 2284-7995, E-ISSN 2285-3952
EFFECT OF WATER AND FERTILIZATION LEVELS ON BARLEY
USING DIFFERENT IRRIGATION SYSTEMS
Asaad DERBALA1, Abdelmonem HASHAD2
1
Dept. of Agric. Engineering, Faculty of Agriculture, Tanta University, Egypt
Phone: 002-040-3455584, Fax: 002-040-3455570, Email: [email protected]
2
Dept. of soil and water,Minister of Agriculture, Egypt, Phone: 002-040-3305951
Corresponding author: [email protected]
Abstract
The experimental work was carried out at El-Gemmeiza Agricultural Research Station, Gharbia Governorate, Egypt during 2009/2010 winter growing season to study the effect of using sprinkler irrigation in clay soil condition and barley production. The sprinklers layouts were square and triangular. Also, two irrigation levels and two fertilizers levels were used. The results showed that the amounts of applied water were 5077, 4201 and 3068 m3 ha-1 for flood and sprinkler 100% ETc and 50% ETc, respectively. The highest values of coefficient of uniformity, distribution uniformity and application efficiency of low quarter were achieved by the square layout. Grain yield increased from 4.55 Mg ha-1 with flood to 5.70 Mg ha-1 under sprinkler irrigation with square layout at 100% ETc and 100% fertilizer. Straw yield increased from 5.36 Mg ha-1 with flood to 9.65 Mg ha-1 under sprinkler irrigation with square layout at 100% ETc and 100% fertilizer. Water use efficiency increased from 0.90 kg m-3 with flood to 1.64 kg m-3 under sprinkling method with triangular layout at 50% ETc and 100% fertilizer. Energy use efficiency increased from 13.66 kg kW-1 h-1 with flood to 18.20 kg kW-1 h-1 under sprinkler irrigation with triangular layout at 50% ETc and 100% fertilizer.In conclusion, square layout at 100% ETc with 100% fertilizer gave the best results.
Key words: vegetable, price volatility, commercialization, supply chain
INTRODUCTION
Sprinkler irrigation system has been used
worldwide due to its flexibility and
adaptability for various soils, crops and topographical conditions. Barley rank is the fourth after wheat, maize and rice. It is consumed as a staple food for animals as well as for human consumption.
El-Adl (2001) studied the effects of irrigation intervals (daily every, two days and every three days), quantities of irrigation water (100% ETc and 120% ETc) and fertilization methods (traditional or broadcasting and fertigation) on peanut production. The results summarized that, maximum seed yield and water use efficiency was obtained with treatment of (irrigation every day with 100% ETc and traditional fertilization method).
El-Gindy et al. (2001) selected sprinkler and
surface drip irrigation system to irrigate maize. They used two irrigation intervals (daily and every second day), two applied water based on 100% and 80% ETc and two soil conditioners (polymer and manure) were
selected as studied treatment. They showed that the 100% ETc irrigation treatment increased grain and ear yield by 28% and 35%, respectively compared 80% ETc irrigation treatment. Kassem et al. (2002) investigated the effect of different seasonal amounts of applied water on the growth and water use efficiency of ten barley varieties under sprinkler irrigation. They showed that barley grain yield increased by increasing the seasonal amounts of the applied water. Kassem and AL-Moshileh (2005) investigated the effect of sprinkler irrigation, surface trickle and subsurface trickle irrigation with different water regimes on both potato yield and water use efficiency. They showed that the potato yield increased by decreasing the value of soil moisture depletion. Also, the field water use efficiency increased as the value of soil moisture depletion decreased.
Aboamera (2010) studied response of cowpea
1514.02 and 1135.51 m3 fed-1 for 100%, 80% and 60% of soil moisture content at field capacity, respectively. The highest seed yield was observed with 100% ETc, while the lowest yield was recorded with 60% of soil moisture content at field capacity. The highest water use efficiency was 0.68 kg m-3 at 80% soil moisture content at field capacity. While the lowest one was 0.59 kg m-3 at 100% and 60% soil moisture content at field capacity. Zabady et al. (2010) evaluated the influence of three irrigation systems on Jatropha production. They also, used different water management techniques. They showed that the seeds yield increased as the applied water increased. The maximum value of WUE was 0.18 kg m-3 at 80% from ETc and 2 days
interval for bubbler irrigation system.
Meanwhile, the minimum value was 0.04 kg
m-3 at 60% from ETc and 4 days interval for trickle irrigation system.
The aim of the present study was to investigate the potential utilizing sprinkler irrigation system in Delta soil conditions to irrigate barley.
MATERIALS AND METHODS
The experimental work was carried out at El-Gemmeiza Agric. Res. Station, Gharbia Governorate, Egypt during 2009/2010 in winter growing season. The experiments were
designed to select suitable irrigation
parameters for producing barley crop Giza 123 variety. The mechanical analysis of the experimental soil was classified as a clay soil as shown in Table (1).
Table 1. Physical properties of soil experimental site
Depth (cm)
Particle size layout
(%) Texture BD
g cm-3
F.C (%)
P.W.P (%)
A.W (%)
Sand Silt Clay
0-15 24.00 26.30 49.70 clay 1.16 43.36 24.25 19.11 15-30 24.15 27.30 48.55 clay 1.20 39.93 21.89 18.04 30-45 24.20 28.25 47.55 clay 1.23 36.62 19.85 16.77 45-60 25.00 28.45 46.55 clay 1.25 34.85 18.97 15.88
The area of the experiment was about 1.26 hectare and situated at 31°.07 longitude and
30°.43 latitude. It has an elevation of about
20 m above mean sea level. The physical properties were determined according to (Black et al., 1982; Klute, 1986) as presented in Table (1).
Prior to the experimental work, soil samples were collected from different randomized locations.
These soil samples were taken at the depths of 0-15, 15-30, 30-45, 45-60 cm for the determination of some physical properties of the soil at the experimental site. Super phosphate (15.5% P2O5) was applied at the
rate of 238 kg ha-1 before seeding. Barley (Giza 123) was seeded by a seed-drill at the rate of 119 kg ha-1 on 26th December 2009. To insure complete seed germination all treatments were irrigated by flooding for the first irrigation. In case of flood irrigation, Urea (46% Nitrogen) was applied by manual method at the rates of 238 kg ha-1 in two
equal doses, the first dose was applied before the second irrigation and the second dose was applied before the third irrigation. The first
irrigate was applied 1673 m3 ha-1 on
26/12/2009. The second irrigate was applied 1690 m3 ha-1 on 7/2/2010. The third irrigate
was applied 1714 m3 ha-1 on 18/3/2010. In case of sprinkler irrigation, Urea (46% Nitrogen) was applied by manual method at
the rate of 238 kg ha-1 for treatments of 100%
recommended fertilizer and 179 kg ha-1 for treatments of 75% recommended fertilizer in twelve equal doses, frequency of fertilization were been four days before irrigation. Irrigation frequency was four days.
PRINT ISSN 2284-7995, E-ISSN 2285-3952
quick couple pipe which 100 mm inside diameter and 6 m in length, 90 m long. Three valves which controlled water flow from main pipelines to sub main pipelines. Sub main pipelines located on the ground surface carry water from the main pipelines to the laterals. Sub main pipelines made from galvanized steel quick couple pipe which 89 mm inside diameter and 6 m in length, 72 m long. Lateral pipelines located on the ground surface carry water from the sub main pipelines to the sprinklers. Lateral pipelines made from galvanized steel quick couple pipe which 70 mm inside diameter and 6 m in length, 150 m long. Seventy two risers carry water from lateral pipelines to sprinklers, which was ¾ inch in diameter and 60 cm in height. Seventy two rotating type sprinklers were used, Perrot ZB 22, have one nozzle of 5.2 mm in diameter. Sprinkler discharge rate was 1.18 m3 h-1 at 150 kPa and installed at spacingăofă12×12ăm,ăwettedădiameterăwasă24ă m, overlapping was 100%. Precipitation
equal 8.2 mm h-1 and the plant height was 80
cm.
Experimental design.The field experiment included two sprinklers layouts (square and triangular), two irrigation levels (100% and 50% ETc) and two fertilization levels (100% and 75% recommended level). To control the amount of irrigation to be 50% and 100% ETc, an automatic valve was used to connect the riser with the lateral line. The different treatments may be classified as follows: S1 = square layout at 100% ETc with 100% fertilizer
S2 = square layout at 100% ETc with 75% fertilizer
S3 = square layout at 50% ETc with 100% fertilizer
S4 = square layout at 50% ETc with 75% fertilizer
T1 = triangular layout at 100% ETc with 100% fertilizer
T2 = triangular layout at 100% ETc with 75% fertilizer
T3 = triangular layout at 50% ETc with 100% fertilizer.
T4 = triangular layout at 50% ETc with 75% fertilizer
C = flood irrigation.
The applied water under flood irrigation.
Discharge rate of water in flood irrigation was acalculated using a 4 inch plastic spile according to Michael (1978) as follows:
Q= 0.61×10⁻³×A×(2gH)½ [1]
where:
Q = discharge rate in L s-1,
H= water head above the center of spile in cm,
A= orifice cross-section area of the spile in cm2 and
g= gravitational acceleration (981 cm s-2).
The applied water under sprinkler
irrigation
Flow rate of sprinkler was measured at operating ppressure by connecting a flexible hose to the sprinkler nozzle and collecting a known volume oof water in a container over a specified period (1min), the flow rate was calculated using the following equation (Melvyn, 1983).
Q = V/T [2]
where:
Q= the flow rate of sprinkler in m3 h-1,
V= the collecting water volume in m3 and
T= time of collecting water in h.
Distribution uniformity. The distribution ouniformity, coefficient of uniformity and application efficiency of low quarter were calculated using the water quantity which recorded from 16 catch cans. The catch cans were placed in a uniform pattern in the wetted area on each side of an operating lateral between each four sprinklers, cans were placed a 3 at 3 m distance between each other every two laterals. The test duration time was forty minutes. The distribution uniformity (DU) was calculated according to Heermann et al. (1990) as follows:
DU = [Ziq/Zav]ă×100 [3]
where:
DU = the distribution uniformity in %,
ZZiq = the average of catch cans depth in the
ZZav = the average of catch cans depth in the
entire field in mm.
Coefficient of uniformity
The coefficient of uniformity (CU) was calculated according to Christiansen (1942) as follows:
CU = [1- (Σă|ăxiă- x |/ năx)]ă×100 [4] Where:
CUă ţă theă Christiansen’să coefficientă ofă uniformity in %,
xi = the individual collector amount in mm, x = the average of collector's amount in mm and
Σă ţă theă summationă ofă nă valuesă andă nă isă theă number of measuring collectors.
Application Efficiency of low quarter
The application efficiency of low quarter (AELQ) was calculated using Merriam and Keller (1978) as follows:
AELQ = [Zr,iq/D]ă×100 [5]
Where:
AELQ = the application efficiency of low quarter in %,
Zr,iq = the average low quarter depth of
collected water in mm and
D = the average depth of water applied in mm.
Water use efficiency
The water use efficiency (WUE) was determined according to Begg and Turner
(1976)as follows:
WUE = Y/Q [6] Where:
WUE = water use efficiency in kg m-3,
Y = grain yield in kg ha-1 and Q = applied water in m3 ha-1.
Energy use efficiency
The energy use efficiency (EUE) was
determined according toas follows:
EUE = Y/Er [7]
Where:
EUE = energy use efficiency in kg kW-1 h-1,
Y = grain yield in kg ha-1 and Er = applied water in kW h ha-1.
RESULTS AND DISCUSSIONS
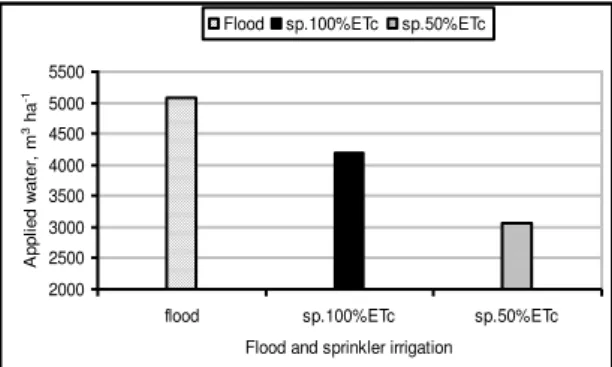
The amount of applied water
The amounts of applied water for flood irrigation and sprinkling levels (100% ETc
and 50% ETc) are depicted in Figure (1). The amounts of applied water were 5077, 4201 and 3068 m3 ha-1 for flood irrigation and sprinkling levels (100% ETc and 50% ETc), respectively. These results showed that the maximum applied water of 5077 m3 ha-1 was recorded with flood irrigation, while the minimum applied water of 3068 m3 ha-1 was recorded with 50% ETc of sprinkling method. It is interesting to mention that the water savings were 17% and 40% for 100% and 50% ETc, respectively in comparison with the control treatment.
2000 2500 3000 3500 4000 4500 5000 5500
flood sp.100%ETc sp.50%ETc
Flood and sprinkler irrigation
A
p
p
li
e
d
w
a
te
r,
m
3 h
a
-1
Flood sp.100%ETc sp.50%ETc
Figure 1. The amount of applied water under different irrigation regimes
Energy consumption. The results in Figure (2) indicate that, the values of energy consumption were 412, 333 and 276 kW h
ha-1 for sp.100% ETc, flood irrigation and
sp.50% ETc, respectively. These results showed that the maximum value of the energy
consumption was 412 kW h ha-1 using sp.
100% ETc. While, the minimum value of the
energy consumption was 276 kW h ha-1 using
sp. 50% ETc.
200 250 300 350 400 450
sp.100%ETc flood sp.50%ETc Sprinkler and flood irrigation
E
n
e
rg
y
c
o
n
s
u
m
p
ti
o
n
,
k
W
h
h
a
-1
sp.100%ETc flood sp.50%ETc
PRINT ISSN 2284-7995, E-ISSN 2285-3952 0 2 4 6 8 10 12 14 16 S1 S2 S3 S4 C Tre atm ent s B io m a s s , g ra in a n d s tr a w y ie ld , M g h a-1 bio mas s gra in str aw 0 2 4 6 8 10 12 14 16
T1 T2 T3 T4 C
Treatments B io m a s s , g ra in a n d s tr a w y ie ld , M g h a -1
biomass grain straw
Effect of sprinklers layouts on coefficient of uniformity, distribution uniformity and application efficiency of low quarter
The results in (Table 2) indicated that, the values of coefficient of uniformity were 78.28 and 78.22% for square and triangular layouts, respectively. The values of distribution uniformity were 77.24 and 73.47% for square and triangular layouts, respectively. The values of application efficiency of low quarter were 73.15 and 70.53% for square and triangular layouts, respectively. The results explained that, the highest values of
coefficient of uniformity, distribution
uniformity and application efficiency of low quarter were achieved by square layout. While the lowest ones were achieved by triangular layout.
Table 2. Effect of sprinklers layouts on coefficient of uniformity, distribution uniformity and application efficiency of low quarter
Sprinklers Layouts Coefficient of uniformity, (%) Distribution uniformity, (%) Application efficiency of low quarter, (%)
Square 78.28 77.24 73.15
Triangular 78.22 73.47 70.53
Effect of watering and fertilizer levels on biomass, grain yield and straw yield under both square and triangular layouts.
The results in (Figure 3) showed the effect of watering and fertilizer levels on biomass, grain yield and straw yield under square layout. The highest value of biomass (15.35
Mg ha-1) was obtained by treatment S1.
While, the lowest value of biomass (12.14 Mg
ha-1) was obtained by treatment S4. The value
of biomass (9.91 Mg ha-1) was obtained by
flood irrigation. The maximum value of grain
yield (5.70 Mg ha-1) was obtained by
treatment S1. While, the minimum value of grain yield (4.82 Mg ha-1) was obtained by treatment S4. The value of grain yield (4.55
Mg ha-1) was obtained by flood irrigation. The
highest value of straw yield (9.65 Mg ha-1) was obtained by treatment S1. While, the
lowest value of straw yield (7.33 Mg ha-1) was
obtained by treatment S4. The value of straw
yield was (5.36 Mg ha-1) was obtained by
flood irrigation.
Figure 3. Effect of watering and fertilizer levels on biomass, grain yield and straw yield under square layout
The results in (Figure 4) showed the effect of watering and fertilizer levels on biomass, grain yield and straw yield under triangular layout .The highest value of biomass (13.08
Mg ha-1) was obtained by treatment T1.
While, the lowest value of biomass (10.82 Mg
ha-1) was obtained by treatment T4. The value
of biomass (9.91 Mg ha-1) was obtained by
flood irrigation. The maximum value of grain
yield (5.03 Mg ha-1) was obtained by
treatments T1 and T3. While, the minimum
value of grain yield (4.79 Mg ha-1) was
obtained by treatment T4. The value of grain yield (4.55 Mg ha-1) was obtained by flood irrigation. The highest value of straw yield
(8.05 Mg ha-1) was obtained by treatment T1.
While, the lowest value of straw yield (6.04
Mg ha-1) was obtained T4. The value of straw
yield (5.36 Mg ha-1) was obtained by flood irrigation.
1.64
1.16
0.90 1.18
1.58
0.4 0.6 0.8 1.0 1.2 1.4 1.6 1.8
S1 S2 S3 S4 T1 T2 T3 T4 C
Treatments
W
a
te
r
u
s
e
e
ff
ic
ie
n
c
y
,
k
g
m
-3
13.66 18.20
11.88 17.52
12.04
6.0 8.0 10.0 12.0 14.0 16.0 18.0 20.0
S1 S2 S3 S4 T1 T2 T3 T4 C
Treatments
E
n
e
rg
y
u
s
e
e
ff
ic
ie
n
c
y
,
k
g
k
W
-1 h
-1
Effect of watering and fertilizer levels on water use efficiency under both square and triangular layouts
Figure (5) illustrate that, in case of square
layout, the highest value of WUE (1.58 kg m-3)
was obtained by treatment S3. While, the lowest value (1.18 kg m-3) was obtained by treatment S2. In case of triangular layout, the
highest value of WUE (1.64 kg m-3) was
obtained by treatment T3. While, the lowest
value (1.16 kg m-3) was obtained by treatment
T2. The value of WUE (0.90 kg m-3) was
obtained by flood irrigation. The figure obviously demonstrates that flood irrigation produced the minimum value of WUE.
Figure 5.Effect of watering and fertilizer levels on water use efficiency (square and triangular layouts)
Effect of watering and fertilizer levels on energy use efficiency under both square and triangular layouts
Figure (6) illustrate that, in case of square
layout, the highest value of EUE
(17.52 kg kW-1 h-1) was obtained by treatment
S3. While, the lowest value (12.04 kg kW-1 h-1) was obtained by treatment S2. In case of triangular layout, the highest value of EUE (18.20 kg kW-1 h-1) was obtained by treatment T3. While, the lowest value (11.88 kg kW-1 h-1) was obtained by treatment T2. The value of
EUE (13.66 kg kW-1 h-1) was obtained by
flood irrigation.
Figure 6. Effect of watering and fertilizer levels on energy use efficiency under both square and triangular layouts
CONCLUSIONS
From the above mentioned investigation, conclusions can be obtained the following: Sprinkler irrigation with 100 and 50% ETc saved water by 17 and 40%, respectively compared with flood irrigation. The highest
values of coefficient of uniformity,
distribution uniformity and application
efficiency of low quarter were achieved by square layout.
The highest value of WUE (1.64 kg m-3) was
obtained by treatment T3, while the lowest
value of WUE (1.16 kg m-3) was obtained by
treatment T2. The value of WUE was 0.90 kg m-3 for flood irrigation.
The highest value of EUE (18.20 kg kW-1 h-1)
was obtained by treatment T3, while the
lowest value of EUE (11.88 kg kW-1 h-1) was
obtained by treatment T2. The value of EUE was 13.66 kg kW-1 h-1 for flood irrigation. Treatments of square layout produced the better results compared to triangular layout. Treatments of 100% ETc produced the better results compared to 50% ETc. Treatments of 100% recommended fertilizer produced the better results compared to 75% recommended fertilizer.
REFERENCES
PRINT ISSN 2284-7995, E-ISSN 2285-3952
[2]Begg J.E., Turner N. C., 1976. Crop water deficits. Advances in Agron.20pp.
[3]Black C. A., Evans D. D., Ensminger L. E., White J. L., Clark F. E., Dinauer R. C., 1982. Methods of soil analysis. 7th Printing the Am. Soc. of Agron. Madison, Wisc., USA. No. 9. Part 2.
[4]Christiansen J. E., 1942. Irrigation by sprinkler. California Agricultural Experiment Station. University of California. Berkeley, California, USA. Bulletin. 670. 124 p.
[5]El-Adl M. A., 2001. sprinkler irrigation and fertigation effects on peanut production. Misr J. of Agric. Eng, 18 (1):75-88.
[6]El-Gindy A. M, Abdel-Mageed H. N, El-Adl M. A, Mohamed E. M. K., 2001. Effect of irrigation treatments and soil conditioners on maize production in sandy soils. Misr J. of Agric. Eng, 18(1):59-74.
[7]Heermann D. F, Wallender W. W, Bos G. M., 1990. Irrigation efficiency and uniformity. (Hoffman C. F, Howell G. J, Solomon T. A, K. H. (Eds.), Management of Farm Irrigation Systems. ASAE, St. Joseph, MI. 125-149.
[8]Kassem M. A, AL-Moshileh A. M., 2005. Effect of on- farm irrigation systems and water regimes on potato yield and water use efficiency. Misr J. of Agric. Eng, 22(2):679-698.
[9]Kassem M. A, Motawei M. I, AL-Moshileh A. M, 2002. Determination of water requirements for some varieties of barley under sprinkler irrigation system at central Saudi Arabia conditions. Misr J. of Agric. Eng, 19(1):169-182.
[10]Klute A., 1986. Methods of soil analysis. Part 1 Book series No. 9, 1172 pp., American Soc. of Agron and soil Sci, Madison, Wisconsin, USA.
[11]Melvyn K. , 1983. Sprinkler irrigation, equipment and practice. Bastsford Academic and Educational, London., 120 pp.
[12]Merriam J. L., Keller J., 1978. Farm irrigation system evaluation. A guide for management. Logan, Utah: Agricultural and Irrigation Engineering Department, Utah State University, USA. 285 pp. [13]Michael A. M., 1978. Irrigation theory and practice. 1st ed., New Delhi, India. 515 pp.