Submitted7 July 2016 Accepted 22 November 2016 Published22 December 2016 Corresponding author
Hiroki Itô, [email protected]
Academic editor Kerry Woods
Additional Information and Declarations can be found on page 13
DOI10.7717/peerj.2816
Copyright 2016 Itô
Distributed under
Creative Commons CC-BY 4.0 OPEN ACCESS
Changes in understory species occurrence
of a secondary broadleaved forest after
mass mortality of oak trees under deer
foraging pressure
Hiroki Itô
Hokkaido Research Center, Forestry and Forest Products Research Institute, Sapporo, Hokkaido, Japan
ABSTRACT
The epidemic of mass mortality of oak trees by Japanese oak wilt has affected secondary deciduous broadleaved forests that have been used as coppices in Japan. The dieback of oak trees formed gaps in the crown that would be expected to enhance the regeneration of shade-intolerant pioneer species. However, foraging by sika deerCervus nipponhas also affected forest vegetation, and the compound effects of both on forest regeneration should be considered when they simultaneously occur. A field study was conducted in Kyôto City, Japan to investigate how these compound effects affected the vegetation of the understory layer of these forests. The presence/absence of seedlings and saplings was observed for 200 quadrats sized 5 m×5 m for each species in 1992, before the mass mortality and deer encroachment, and in 2014 after these effects. A hierarchical Bayesian model was constructed to explain the occurrence, survival, and colonization of each species with their responses to the gaps that were created, expanded, or affected by the mass mortality ofQuercus serratatrees. The species that occurred most frequently in 1992,Eurya japonica,Quercus glauca, andCleyera japonica, also had the highest survival probabilities. Deer-unpalatable species such asSymplocos prunifolia
andTriadica sebiferahad higher colonization rates in the gaps, while the deer-palatable speciesAucuba japonicahad the smallest survival probability. The gaps thus promoted the colonization of deer-unpalatable plant species such as Symplocos prunifolia and
Triadica sebifera. In the future, such deer-unpalatable species may dominate gaps that were created, expanded, or affected by the mass mortality of oak trees.
SubjectsBiodiversity, Ecology, Plant Science
Keywords Japanese oak wilt, Deer-unpalatable plant species, Gap, Understory vegetation, Sika deer
INTRODUCTION
Many coppices have been abandoned for socio-economic reasons, such as the replacement of woody fuels with fossil fuels in Europe (Rackham, 2008;Müllerová, Hédl & Szabó, 2015;
which is carried by the ambrosia beetlePlatypus quercivorusMurayama (Kubono & Ito, 2002;Kinuura & Kobayashi, 2006). In addition, it has been pointed out that the coppice abandonment is an indirect cause of the epidemic because the ambrosia beetles reproduce more successfully in large oak stems, which are more abundant as abandoned oak stems grow up (Kobayashi & Ueda, 2005). There is another possible reason why the abandonment indirectly affected the epidemic: in the period when coppices were managed, oak stems that died from the wilt were quickly felled and utilized for fuel or charcoal, and as a result, it prevented outbreaks of the disease (Ida & Takahashi, 2010).
The mass mortality altered the structures of damaged oak forests. The two major deciduous oak species in Japan, Quercus crispulaBlume and Quercus serrata Murray, are vulnerable to the pathogenic fungus. Nakajima & Ishida (2014) showed that 80±
19% (mean ± standard deviation) stems of Quercus crispuladied, while 34± 19% stems ofQuercus serrata died. Naka (1982) studied an old-growth evergreen forest in the Kasugayama Forest Reserve in Nara City, which is located about 40 km south of the study site, and showed that the major gap generator was typhoons, and that the interval between the typhoon disturbances was 6.57 years with a tree fall rate for overstory trees of 0.84 trees/ha/year, and that the canopy opening rate was 55.6 m2/ha/year. Though these rates are not directly applicable to deciduous secondary oak forests, the gaps created by the mortality would not be negligible for oak-dominated forests. IfQuercus serratacovers 30% of the canopy and 30% of them die, 900 m2/ha of the canopy will become gaps. How
such damaged oak forests regenerate depends on the circumstances; sub-canopy trees might grow to canopy trees in some cases (Itô, Igarashi & Kinuura, 2009), and dense floor vegetation such as dwarf bamboo might inhibit regeneration in other cases (Itô, Kinuura & Oku, 2011;Saito & Shibata, 2012). In the latter case, the damaged forests may lack a canopy layer for a long time.
For the last several decades, herbivory by overabundant deer populations has negatively affected forest vegetation in Europe and North America (Rooney, 2001;Côté et al., 2004;
Rackham, 2008). This is paralleled in Japan: sika deer (Cervus nipponTemminck) is one major inhibitor of forest regeneration (Takatsuki, 2009;Suzuki, 2013;Iijima & Nagaike, 2015). However, little is known about how regeneration proceeds after mass mortality under deer foraging pressure (Obora, Watanabe & Yokoi, 2013). Gap formation should improve light conditions on the forest floor and promote the regeneration of many tree species (Suzuki, 2013). However, excessive browsing should inhibit regeneration, except for unpalatable and browse-tolerant species (Shimoda et al., 1994). Therefore, a combination of both factors might promote the regeneration of species that are unpalatable and/or browse-tolerant to deer. This in turn may alter the species composition of forests that regenerate from the mass mortality of oak trees over time.
Cleyera japonica Thunb., andEurya japonicaThunb. var.japonica, as well as to species unpalatable to deer, such as Symplocos prunifoliaSiebold et Zucc. andTriadica sebifera
(L.) Small. However, the study only described the changes in species occurrence and failed to estimate the specific probabilities of survival and colonization. In this study, the previous data from the understory layers were reanalyzed using a hierarchical Bayesian model that explicitly incorporates probabilities of ecological processes such as occurrence, survival, and colonization. A hierarchical model incorporating random species effects also makes it possible to estimate those probabilities by species, ‘‘borrowing strength from the ensemble’’ (Kéry & Schaub, 2012). These advantages should be of use in predicting which species will dominate such stands in the future.
MATERIALS AND METHODS
Study siteThe field data were collected in the Ginkakuzi-san (also spelled Ginkakuji-san) National Forest located in Kyôto City, Japan (35.029◦N, 135.801◦E). The yearly average temperature from 1981 to 2010 was 15.9 ◦C and the average precipitation was 1491.3 mm at the Kyôto Local Meteorological Office. Elevation of the forest was 100–290 m above sea level, and the forest was in the warm temperate zone. The national forest was protected for its landscape and erosion control, and most of it was situated in the buffer zone of the UNESCO world heritage site, historic monuments of ancient Kyôto. The fieldwork was conducted with permission under an agreement between the Kyôto-Ôsaka District Forest Office and the Forestry and Forest Products Research Institute.
In the 1930s, most of the forest canopy consisted of a mix of pines (Pinus densiflora
Siebold et Zucc.) and broadleaved trees including oak (Quercus serrata). After the 1960s, many pine trees had died due to the pine wilt disease. Recently, most of the national forest has been covered with a secondary broadleaved forest consisting of many species such as evergreen oak Quercus glauca, evergreen subcanopy speciesSymplocos prunifolia, and deciduous tree speciesIlex macropodaMiq., although conifers (Cryptomeria japonica(L.f.) D. Don andChamaecyparis obtusa(Siebold et Zucc.) Endl.) were planted in a small part of the area (Itô, 2007). In 2005, the mass mortality of oaks was first recognized in the eastern part of Kyôto City, in which the Ginkakuzi-san National Forest is located, and then the damage expanded (Itô, 2015). In addition, damage by sika deer resulting from browsing and bark-stripping has been noticeable over the same period. Deer had been seldom seen in the 1990s (pers. obs.), but by this time inhabited the forest throughout the year (Itô, 2015).
In 1992, a 0.5 ha (100×50 m) plot was established on a south-facing slope in the
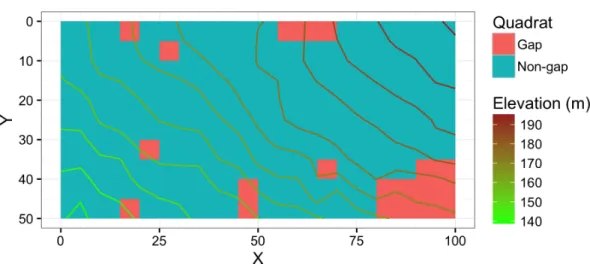
Figure 1 Map showing the study site.Gap denotes the gap quadrats created, expanded, or affected by the mass mortality of oak trees. Non-gap denotes the rest of the quadrats. Units of theXandYaxes are in meters.
These trees were most likely killed by Japanese oak wilt. This affected the forest structure in the plot via the formation of new canopy gaps or by expanding existing gaps. In some area, the mortality indirectly affected the forest floor via treatments of dead stems by the forest office (cutting down the stems, cutting the fallen stems into pieces, and disinfecting them) (Itô, 2015). On the other hand, none of the evergreen oaksQuercus glaucadied from the disease, though some were attacked by the ambrosia beetles, being less vulnerable thanQuercus serrata(Murata, Yamada & Ito, 2005;Murata et al., 2009). In the understory layer,Quercus glaucaand some evergreen shrub species such asEurya japonicaandCleyera japonicawere frequently observed. Overall changes in the species composition of the site from 1990s to 2010s were reported inItô (2015).
Data collection
The plot was divided into 200 quadrats sized 5 m×5 m. In 1992, all woody plant seedling or saplings (age≥1 year and dbh<3 cm) were tallied by species. The plots were resampled in 2014. In 2014, each quadrat was classified into inside or outside of gaps formed by the death of oak trees or older gaps that were affected in addition by fallen dead oak trees. Quadrats on the boundary were visually classified; if an open area which was created, expanded, or affected by the mass morality occupied most of the quadrat, the quadrat was classified as a gap quadrat. Twenty of 200 quadrats were classified as gaps created or affected by oak death (Fig. 1). The size of the largest gap was approximately 250 m2consisting of
10 adjacent quadrats.
glauca. The mean and median were 15.6 and 5, respectively, excluding species which did not occur in 2014 in any quadrats.
Data analysis was conducted for 42 of the species that were observed in more than 5 quadrats over both sample years (200 quadrats×2 observations).
Statistical modeling
A hierarchical Bayesian model was constructed to determine how species were affected by the recent environmental changes in the forest.
The presence/absence (presence=1, absence=0) of speciesiin quadratj in the year 1992 (y1ij) and 2014 (y2ij) was assumed to follow the Bernoulli distribution given the
occurrence probabilityψ1ij andψ2ij, as follows,
y1ij∼Bernoulli(ψ1ij)
y2ij∼Bernoulli(ψ2ij).
To be exact, the ‘‘presence/absence’’ was ‘‘detection/nondetection’’ (Dorazio et al., 2006;Kéry & Schaub, 2012). It has been pointed out that detection probability should be considered to correctly estimate population properties such as the occurrence rate or survival rate, even if the observed objects are plants (Kéry, 2004;Chen et al., 2009;Chen et al., 2013). The present study had only one observation for each survey year. However, the quadrat size was rather small (5 m×5 m) and the whole of each quadrat was explored, so I
expected that the detection probability should be near to one and therefore ‘‘detection/non-detection’’ was regarded as ‘‘presence/absence’’ in this study. Chen et al. (2009)showed that the detection probability asymptotically approaches one with larger survey efforts.
The parameter of occurrence in 1992,ψ1ij, was formulated as follows:
logit(ψ1ij)=βo+ǫoi+rj,
whereβodenotes an intercept or overall mean ofψ1on the logit scale, andǫoidenotes the random species effect on the intercept of speciesi. The parameterrj denotes a spatially autocorrelated random effect of quadratj.
The parameter of occurrence in 2014,ψ2ij, was formulated as follows:
ψ2ij=y1ijφij+(1−y1ij)γij,
where parameterφijdenotes the ‘survival’ probability that speciesiwas present in quadrat j in 1992 and still present in 2014. The parameterγij denotes the ‘colonization’ probability
that speciesiwas absent in quadratj in 1992 but present in 2014.
The parameters of survivalφij and colonizationγij were formulated as follows:
logit(φij)=βs+ǫsi+(βsg+ǫsgi)gj
logit(γij)=βc+ǫci+(βcg+ǫcgi)gj,
βsgandβcg are coefficients of the gap predictorgj (0: non-gap quadrats, 1: gap quadrats affected by oak mortality), andǫsgiandǫcgiare random species effects on the coefficients. Priors of the random species effects were defined hierarchically; hyperparameters,σo, σs,σsg,σc, andσcgscaled the distribution ofǫoi,ǫsi,ǫsgi,ǫci, andǫcgi, respectively, as follows:
ǫoi∼Normal(0,σo2)T(−10,10),
where Normal(0,σ2)T(−10,10) denotes a normal distribution truncated at −10 and 10; the truncation was incorporated to stabilize the logit scale parameters (Kéry & Schaub, 2012). Priors of the parameters βo,βop,βos,βs,βsg,βc, andβcg were defined
as Normal(0,104)T(−10,10). The prior of the spatial effectrj was defined as an intrinsic
conditional autoregressive model as follows:
rj|r−j∼Normal
X
k6=j wjkrj
wj+
, σ
2 r wj+
,
wherer−j denote the values ofrexcept for the quadratj, a variablewjk was defined to be
1 if quadratjand quadratkare adjacent, and 0 if not, andwj+was defined to be P
kwjk.
The parameterσr2denotes a variance of the random effect.
Presence/absence data for 42 species, which were observed in more than 5 quadrats in total over two surveys, 1992 and 2014, were used for the parameter estimation. To estimate the posterior distribution for each parameter, the Markov chain Monte Carlo (MCMC) method was adopted; this simulation method generates Markov chains drawing values from the target posterior distributions if the chains converge to stationary distributions (Gelman et al., 2013). Four parallel chains were generated in this study, and each of them had 13,000 iterations while the first 3,000 iterations were dropped as burn-in. The MCMC sample was taken from the three chains with 10 thinning intervals, so that the sample size was 4,000. OpenBUGS 3.2.3 (Lunn et al., 2009) was used for the computation. The BUGS code is available inSupplemental Information 2. To check the convergence, Gelman–Rubin statistics (Rˆ) were calculated (Gelman & Rubin, 1992;Brooks & Gelman, 1998;Gelman et
al., 2013). When the Markov chains successfully converge, the value ofRˆ becomes nearly
one. If the value ofRˆ is no larger than 1.1, the chains are usually regarded as converged
(Kéry & Schaub, 2012).
RESULTS
For each parameter, the values ofRˆ were no larger than 1.1, so that the Markov chains
seemed to reach convergence. However, some random species effects on coefficients of gaps had rather wide posteriors as mentioned later. Those parameters might lack enough information to obtain satisfactory estimates.
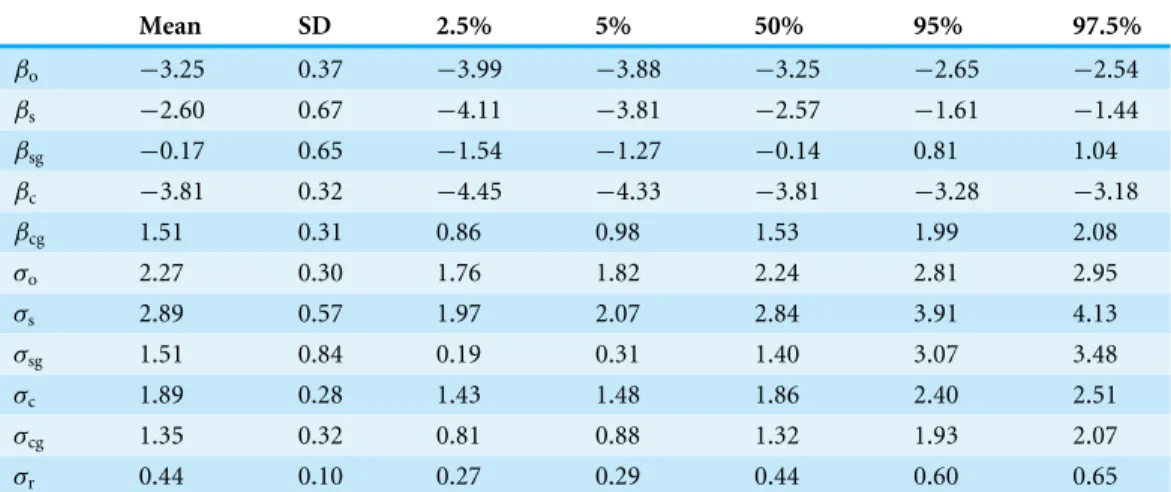
Posterior mean, median, and 95% credible interval (CI) of the overall occurrence probability in 1992 (probability that a species was present in a quadrat in 1992), βo, was estimated to be−3.25 for the posterior mean,−3.25 for the median, and−3.99 to
Table 1 Parameter estimates (posterior mean, standard deviation (SD), and 2.5%, 5%, 50%, 95%, and 97.5% quantiles) other than random effects.Positive values of the intercepts (βo,βs, andβc) on the logit
scale mean that the corresponding probabilities are larger than 0.5, and vice versa. Positive values of the coefficients of gap (βsgandβcg) mean that the gap increases the corresponding probabilities. Parameters σoand below are standard deviations of the corresponding predictors.
Mean SD 2.5% 5% 50% 95% 97.5%
βo −3.25 0.37 −3.99 −3.88 −3.25 −2.65 −2.54
βs −2.60 0.67 −4.11 −3.81 −2.57 −1.61 −1.44
βsg −0.17 0.65 −1.54 −1.27 −0.14 0.81 1.04
βc −3.81 0.32 −4.45 −4.33 −3.81 −3.28 −3.18
βcg 1.51 0.31 0.86 0.98 1.53 1.99 2.08
σo 2.27 0.30 1.76 1.82 2.24 2.81 2.95
σs 2.89 0.57 1.97 2.07 2.84 3.91 4.13
σsg 1.51 0.84 0.19 0.31 1.40 3.07 3.48
σc 1.89 0.28 1.43 1.48 1.86 2.40 2.51
σcg 1.35 0.32 0.81 0.88 1.32 1.93 2.07
σr 0.44 0.10 0.27 0.29 0.44 0.60 0.65
(=1/(1+exp(3.25))) on the probability scale. Therefore, a species was expected to occur in 3.7% of quadrats on average in 1992. In the same manner, the 95% CI was 1.8–7.3% on the probability scale.
The overall survival probability (probability that a species was present in a quadrat in 1992 and still present in the same quadrat in 2014),βs, was estimated to be−2.60 for the posterior mean,−2.57 for the median, and−4.11 to−1.44 for the 95% CI. The mean value was equivalent to a probability that a species occurring in 1992 surviving in the same quadrat in 2014 was expected to be 6.9%, and the 95% CI was 1.6–19.2%.
On the other hand, the overall colonization probability (probability that a species was absent in a quadrat in 1992 but present in the same quadrat in 2014),βc, was estimated to be−3.81 for the posterior mean,−3.81 for the median, and−4.45 to−3.18 for the 95% CI. The value−3.81 was equivalent to 0.022 on the probability scale; so that the probability that a species which was absent in a quadrat in 1992 had colonized into the quadrat in 2014 was expected to be 2.2%, and the 95% CI was 1.2–4.0%.
Posterior mean of coefficients of the gap effect on survivalβsgand colonizationβcgwere
−0.17 and 1.51, respectively, andβcgdid not include zero in the 95% CI (0.86–2.08), while βsgincluded zero in the 90% CI (−1.27–0.81). The mean value 1.51 ofβcgmeant that gaps increased average colonization probability from 2.2% to 9.1% (=1/(1+exp(3.81−1.51))) on average.
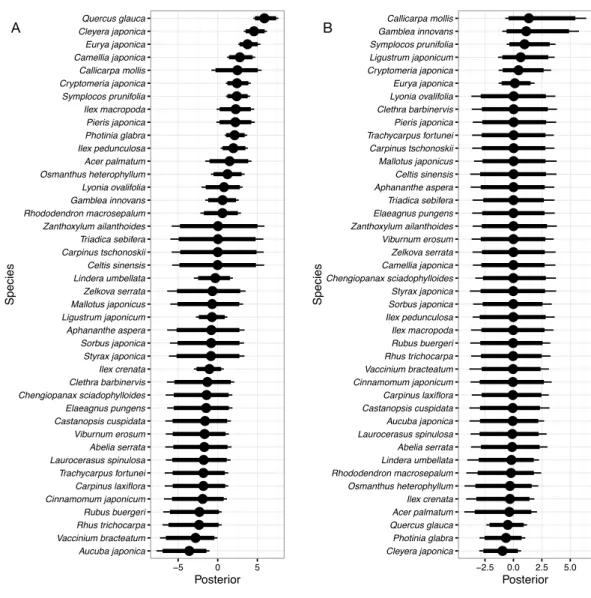
● ● ● ● ● ● ● ● ● ● ● ● ● ● ● ● ● ● ● ● ● ● ● ● ● ● ● ● ● ● ● ● ● ● ● ● ● ● ● ● ● ● Carpinus tschonoskii Zanthoxylum ailanthoides Celtis sinensis Triadica sebifera Zelkova serrata Styrax japonica Aphananthe aspera Mallotus japonicus Sorbus japonica Clethra barbinervis Acer palmatum Ilex macropoda Pieris japonica Callicarpa mollis Elaeagnus pungens Chengiopanax sciadophylloides Castanopsis cuspidata Abelia serrata Lyonia ovalifolia Laurocerasus spinulosa Viburnum erosum Rhododendron macrosepalum Carpinus laxiflora Trachycarpus fortunei Osmanthus heterophyllum Cinnamomum japonicum Gamblea innovans Camellia japonica Ilex pedunculosa Lindera umbellata Rubus buergeri Rhus trichocarpa Cryptomeria japonica Vaccinium bracteatum Symplocos prunifolia Ligustrum japonicum Photinia glabra Ilex crenata Aucuba japonica Cleyera japonica Quercus glauca Eurya japonica
−4 0 4
Posterior
Species
Figure 2 Random species effects on occurrence in 1992ǫo. Thin lines denote 95% credible intervals
(CI), thick lines denote 90% CI, and circles denote medians. Larger positive values in the posterior indi-cate that the species will be more likely to be present in 1992 than the overall mean, and negative values in-dicate that the species will be less likely.
species. In the same manner, the expected occurrence probabilities were 59.1% forCleyera japonica, 53.2% forAucuba japonica, 34.8% forIlex crenata, and 31.6% forPhotinia glabra. On the other hand,Carpinus tschonoskiiMaxim.,Celtis sinensis,Zanthoxylum ailanthoides
Siebold et Zucc., andTriadica sebiferahad the smallest values because these species were not detected in 1992 (Fig. 2). The posterior mean forCarpinus tschonoskiiwas−3.21 on
● ● ● ● ● ● ● ● ● ● ● ● ● ● ● ● ● ● ● ● ● ● ● ● ● ● ● ● ● ● ● ● ● ● ● ● ● ● ● ● ● ● Aucuba japonica Vaccinium bracteatum Rhus trichocarpa Rubus buergeri Cinnamomum japonicum Carpinus laxiflora Trachycarpus fortunei Laurocerasus spinulosa Abelia serrata Viburnum erosum Castanopsis cuspidata Elaeagnus pungens Chengiopanax sciadophylloides Clethra barbinervis Ilex crenata Styrax japonica Sorbus japonica Aphananthe aspera Ligustrum japonicum Mallotus japonicus Zelkova serrata Lindera umbellata Celtis sinensis Carpinus tschonoskii Triadica sebifera Zanthoxylum ailanthoides Rhododendron macrosepalum Gamblea innovans Lyonia ovalifolia Osmanthus heterophyllum Acer palmatum Ilex pedunculosa Photinia glabra Pieris japonica Ilex macropoda Symplocos prunifolia Cryptomeria japonica Callicarpa mollis Camellia japonica Eurya japonica Cleyera japonica Quercus glauca
−5 0 5
Posterior Species ● ● ● ● ● ● ● ● ● ● ● ● ● ● ● ● ● ● ● ● ● ● ● ● ● ● ● ● ● ● ● ● ● ● ● ● ● ● ● ● ● ● Cleyera japonica Photinia glabra Quercus glauca Acer palmatum Ilex crenata Osmanthus heterophyllum Rhododendron macrosepalum Lindera umbellata Abelia serrata Laurocerasus spinulosa Aucuba japonica Castanopsis cuspidata Carpinus laxiflora Cinnamomum japonicum Vaccinium bracteatum Rhus trichocarpa Rubus buergeri Ilex macropoda Ilex pedunculosa Sorbus japonica Styrax japonica Chengiopanax sciadophylloides Camellia japonica Zelkova serrata Viburnum erosum Zanthoxylum ailanthoides Elaeagnus pungens Triadica sebifera Aphananthe aspera Celtis sinensis Mallotus japonicus Carpinus tschonoskii Trachycarpus fortunei Pieris japonica Clethra barbinervis Lyonia ovalifolia Eurya japonica Cryptomeria japonica Ligustrum japonicum Symplocos prunifolia Gamblea innovans Callicarpa mollis
−2.5 0.0 2.5 5.0 Posterior
Species
A B
Figure 3 Random species effects on survival.(A)ǫs, on the intercept, and (B)ǫsg, on the coefficient
of the effect of gap. Thin lines denote 95% credible intervals (CI), thick lines denote 90% CI, and circles denote medians. Larger positive values in the posterior indicate that a species that had been present in a quadrat in 1992 will be more likely to be present in the same quadrat in 2014 than the overall mean, and negative values indicate that the species will be less likely.
Random species effects on the intercept of survival from 1992 to 2014 (ǫs) are shown inFig. 3A.Quercus glaucahad the largest value, andCleyera japonica,Eurya japonica, and
Camellia japonicaL. followed. The posterior mean ofQuercus glaucawas 5.93, and the expected survival probability was 96.5% (=1/(1+exp(2.60−5.93))) without the gap effects. The expected survival probabilities were 88.3% for Cleyera japonica, 76.7% for
Eurya japonica, and 55.7% forCamellia japonica. On the other hand, the posterior of
Aucuba japonica was less than zero within 95% CI (Fig. 3A). The posterior mean of the random effect was−3.80 and the expected value of survival probability was 0.2%. The posterior mean ofVaccinium bracteatum. Thunb was the second smallest and the value was
● ● ● ● ● ● ● ● ● ● ● ● ● ● ● ● ● ● ● ● ● ● ● ● ● ● ● ● ● ● ● ● ● ● ● ● ● ● ● ● ● ● Trachycarpus fortunei Pieris japonica Viburnum erosum Rubus buergeri Aucuba japonica Lindera umbellata Rhus trichocarpa Vaccinium bracteatum Callicarpa mollis Lyonia ovalifolia Elaeagnus pungens Chengiopanax sciadophylloides Acer palmatum Rhododendron macrosepalum Abelia serrata Camellia japonica Triadica sebifera Aphananthe aspera Celtis sinensis Ilex crenata Carpinus tschonoskii Cinnamomum japonicum Ligustrum japonicum Laurocerasus spinulosa Castanopsis cuspidata Zelkova serrata Osmanthus heterophyllum Gamblea innovans Clethra barbinervis Zanthoxylum ailanthoides Sorbus japonica Mallotus japonicus Styrax japonica Carpinus laxiflora Ilex pedunculosa Cryptomeria japonica Ilex macropoda Photinia glabra Symplocos prunifolia Cleyera japonica Eurya japonica Quercus glauca
−5 0 5
Posterior Species ● ● ● ● ● ● ● ● ● ● ● ● ● ● ● ● ● ● ● ● ● ● ● ● ● ● ● ● ● ● ● ● ● ● ● ● ● ● ● ● ● ● Cleyera japonica Gamblea innovans Castanopsis cuspidata Laurocerasus spinulosa Ilex macropoda Ilex crenata Chengiopanax sciadophylloides Lyonia ovalifolia Elaeagnus pungens Osmanthus heterophyllum Rhus trichocarpa Vaccinium bracteatum Lindera umbellata Viburnum erosum Rubus buergeri Pieris japonica Trachycarpus fortunei Aucuba japonica Ilex pedunculosa Rhododendron macrosepalum Abelia serrata Cinnamomum japonicum Sorbus japonica Photinia glabra Quercus glauca Cryptomeria japonica Clethra barbinervis Styrax japonica Carpinus laxiflora Camellia japonica Ligustrum japonicum Zelkova serrata Aphananthe aspera Eurya japonica Mallotus japonicus Acer palmatum Celtis sinensis Symplocos prunifolia Triadica sebifera Carpinus tschonoskii Zanthoxylum ailanthoides Callicarpa mollis
−2.5 0.0 2.5
Posterior
Species
A B
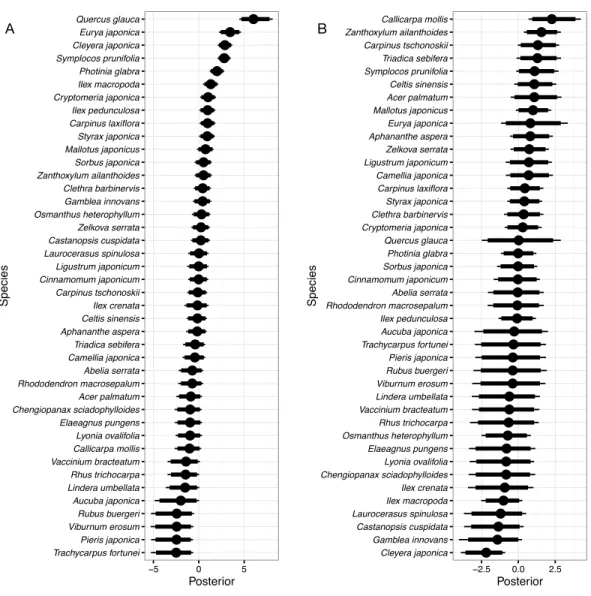
Figure 4 Random species effects on colonization.(A)ǫc, for the intercept and (B)ǫcg, for the
coeffi-cient of the gap effect. Thin lines denote 95% credible intervals (CI), thick lines denote 90% CI, and cir-cles denote medians. Larger positive values in the posterior indicate that species that had been absent in a quadrat in 1992 will be more likely to be present in the same quadrat in 2014 than the overall mean, and negative values indicate that the species will be less likely.
species effects on the survival coefficients of the gap predictor were rather small as absolute values and included zero in their 90% CI for all species (Fig. 3B).
Random species effects on intercepts of colonization from 1992 to 2014 were the largest in Quercus glauca, followed by Eurya japonica, Cleyera japonica, Symplocos prunifolia,
Photinia glabra, and so on (Fig. 4A). The posterior mean of the random effect forQuercus glaucawas 6.09 and the expected colonization probability without the gap effects was 90.7%. In the same manner, the expected colonization probabilities forCleyera japonica,
Symplocos prunifolia, andPhotinia glabrawere 28.3%, 26.7%, and 14.1%, respectively. Random species effects on the colonization coefficient of the gap predictor were the largest forCallicarpa mollis Siebold et Zucc., followed byZanthoxylum ailanthoides,
The posterior mean of the random effect forCallicarpa molliswas 2.32, so that the expected colonization probability for the species in the gap quadrats was estimated to be 25.9% (=1/(1+exp(3.81−1.51+1.07−2.32))), as the posterior mean of the random species effect on the colonization for the species was−1.07. Some species such asQuercus glauca
had wider CI in their posteriors. This might be because there was little information for such species due to the small number of colonizers within the gaps (Fig. 4B).
Complete estimates of random effects are available inTable S3.
DISCUSSION
The mean probability of overall occurrence in 1992 for individual species was estimated to be only 3.7% for each quadrat. This reflects the fact that many species occurred only in a small fraction of the quadrats. The most frequent species in 1992 were all evergreen tree or shrub species such asEurya japonica,Quercus glauca,Cleyera japonica,Aucuba japonica,Ilex crenata, andPhotinia glabra; the expected occurrence probabilities of these species were all larger than 30%. Species with large values of random species effects concerning occurrence corresponded to these species as a matter of course (Fig. 2). On the other hand, the least frequently occurring species were deciduous trees or shrubs such asCarpinus tschonoskii,
Zanthoxylum ailanthoides,Celtis sinensisPers., andTriadica sebifera; these species were not detected in the quadrats in 1992. The canopy of the forest was almost closed in 1992, so that shade-tolerant evergreen tree or shrub species dominated the understory layer and deciduous early-successional species infrequently occurred.
Overall survival and colonization probability by individual species were expected to be 6.9% and 2.2%, respectively, on average. These may seem small, but some species have large random effect values allowing them to survive or colonize at high probabilities. The average colonization probability was estimated to increase in the gap quadrats. This was in accord with the preceding study showing that gap creation increased floor species richness even under deer pressure (Suzuki, 2013).
The species that had the highest survival probability in the non-gap quadrats wasQuercus glauca(Fig. 3A); the mean probability of survival was expected to be 96.5%.Quercus glauca
results suggest that the species is vulnerable to deer impacts. The random species effects on the survival coefficients of the gap predictor were not so clear (Fig. 3B). This may due both to the small sample size of the gap quadrats, and to the small number of light-demanding species occurring in 1992.
The colonization probability in the non-gap quadrat was highest inQuercus glauca, and evergreen shrub or sub-canopy trees followed (Fig. 4A). Among them,Quercus glaucahad an especially high colonization probability; the expected value was 90.7%. This might be because numerous seeds of this species are dispersed in the forest due to the abundance of mother trees (Itô, 2007;Itô, 2015), and it could persist at the seedling stage (Itô, 2009). On the other hand, the four species whose colonization probabilities were largest in the gaps are all shade-intolerant (Shimoda et al., 1994;Shibata & Nakashizuka, 1995). In addition to the four species,Symplocos prunifoliais also considered to be a shade-intolerant species though it is an evergreen (Fujii, 1994). However,Symplocos prunifoliaandTriadica sebifera are unpalatable plants for sika deer (Shimoda et al., 1994;Hashimoto & Fujiki, 2014).Triadica sebiferais an alien species in Japan. The species is unpalatable for sika deer (Shimoda et al., 1994;Hashimoto & Fujiki, 2014), and as of 2002, it was increasing on Mt. Kasugayama (Maesako, Nanami & Kanzaki, 2007).Shimoda et al. (1994)studied the deer effects on pioneer species on Mt. Kasugayama, where deer population density was high; the authors found that pioneer species includingZanthoxylum ailanthoidesandCallicarpa mollisemerged in gaps but rarely survived or matured due to deer foraging pressure.
In the study site, few large stems (height≥50 cm) ofZanthoxylum ailanthoides,Callicarpa mollis, andCarpinus tschonoskiiwere found, though a greater number of those ofQuercus glauca,Cleyera japonica, andEurya japonicawere found in the quadrats that were not affected by the mass oak mortality (Itô, 2015). The latter species are evergreen trees or shrubs, and they had been dominant at least since 1992. In addition to these species, large plants ofSymplocos prunifoliaandTriadica sebiferawere found in the gap quadrats created, expanded, or affected by the mass mortality (Itô, 2015), and the high colonization rate of these species in the gaps might contribute to their regeneration.Suzuki (2013)pointed out that succession after the abandonment of coppices in which there was gap creation under deer herbivory pressure would increase dominance by shade-tolerant and herbivory-tolerant species. In the present study, the two shade-inherbivory-tolerant and deer-unpalatable species frequently colonized into the gap quadrats and grew up. The difference may be due to the abundance of the two species or overall differences in species composition; for example, the shade-tolerant and herbivory-tolerant speciesMaesa japonica(Thunb.) Moritzi et Zoll. present in the gap plots of (Suzuki, 2013) was not found in the present study site.
Horsley, Stout & DeCalesta (2003)conducted a field experiment in a hardwood forest in Pennsylvania, North America, and showed that fern abundance increased in thinned and clear-cut stands with an increase in deer density while the abundance of Rubus
within exclosures.Obora, Watanabe & Yokoi (2013), however, also mentioned that the tree species were suppressed by shrub and grass species even in the exclosures. This suggests the difficulty of forests regenerating from damage caused by the mass mortality of oak trees. A similar issue was also reported inItô, Kinuura & Oku (2011), in a forest subjected to mass mortality and whose floor was dominated by dwarf bamboo. In the present study, such shrub or grass species were lacking, but a deer-unpalatable fern,Hypolepis punctata(Thunb.) Mett. ex Kuhn, partially colonized the gap quadrats (Itô, 2015). Such deer-unpalatable ferns and/or herbaceous species may suppress regeneration of tree species, and colonize gaps, resulting in dominance of the forest floor.
CONCLUSION
Gaps that were created, expanded, or affected by the mass mortality of oak trees might increase colonization of pioneer species. Shade-intolerant species such asCallicarpa mollis,
Zanthoxylum ailanthoides,Carpinus tschonoskii,Triadica sebifera, andSymplocos prunifolia
were estimated to more frequently colonize the gaps. Among them, deer-unpalatable
Symplocos prunifoliaandTriadica sebiferamay be more likely to survive or mature under foraging pressure of deer, while deer-palatable species such as Callicarpa mollis and
Zanthoxylum ailanthoidesmay be unlikely to grow under such pressure. This may change the species composition in regenerating stands.
In the future, deer-unpalatable species such asSymplocos prunifoliaandTriadica sebifera
may dominate the understory within the gaps that are created, expanded, or affected by the mass mortality of oak trees rather than the current dominant species such as
Eurya japonicaandQuercus glauca, while these current dominant species may retain their dominance within unaffected areas owing to their abundance and shade-tolerance under the current magnitude of deer pressure.
ACKNOWLEDGEMENTS
I thank Dr. K Hirayama (Kyôto Prefectural University) for cooperating with the fieldwork and the Kyôto-Ôsaka District Forest Office for supporting this work. I also thank Dr. H Iijima (Yamanashi Forest Research Institute) for reading a previous version of the manuscript and for comments. Computational calculations were conducted on the high-performance cluster computing system of AFFIT, the Ministry of Agriculture, Forestry and Fisheries, Japan.
ADDITIONAL INFORMATION AND DECLARATIONS
Funding
Grant Disclosures
The following grant information was disclosed by the author: JSPS KAKENHI: JP26450215.
Competing Interests
The author declares that they have no competing interests.
Author Contributions
• Hiroki Itô conceived and designed the experiments, performed the experiments, analyzed
the data, contributed reagents/materials/analysis tools, wrote the paper, prepared figures and/or tables, reviewed drafts of the paper.
Field Study Permissions
The following information was supplied relating to field study approvals (i.e., approving body and any reference numbers):
The Kyôto-Ôsaka District Forest Office and the Forestry and Forest Products Research Institute agreed to conduct the study cooperatively in the national forest.
Data Availability
The following information was supplied regarding data availability: The raw data has been supplied as aSupplementary File.
Supplemental Information
Supplemental information for this article can be found online athttp://dx.doi.org/10.7717/ peerj.2816#supplemental-information.
REFERENCES
Brooks SP, Gelman A. 1998.General methods for monitoring convergence of iterative simulations.Journal of Computational and Graphical Statistics7:434–455.
Cai F. 2000.A study on the structure and dynamics ofCyclobalanopsis glaucapopulation at hills around West Lake in Hangzhou.Scientia Silvae Sinicae36:67–72 (in Chinese with English summary).
Chen G, Kéry M, Plattner M, Ma K, Gardner B. 2013.Imperfect detection is the rule rather than the exception in plant distribution studies.Journal of Ecology
101:183–191DOI 10.1111/1365-2745.12021.
Chen G, Kéry M, Zhang J, Ma K. 2009.Factors affecting detection probability in plant distribution studies.Journal of Ecology 97:1383–1389
DOI 10.1111/j.1365-2745.2009.01560.x.
Côté SD, Rooney TP, Tremblay J-P, Dussault C, Waller DM. 2004.Ecological impacts of deer overabundance.Annual Review of Ecology and Systematics35:113–147
DOI 10.1146/annurev.ecolsys.35.021103.105725.
Dorazio RM, Royle JA, Söderström B, Glimskär A. 2006.Estimating species richness and accumulation by modeling species occurrence and detectability.Ecology87:842–854
Fujii T. 1994.Stand development process and flowering patterns of aSymplocos prunifo-liapopulation.Humans and Nature 3:79–83 (in Japanese with English summary). Gelman A, Carlin JB, Stern HS, Dunson DB, Vehtari A, Rubin DB. 2013. Bayesian data
analysis. 3rd edition. Boca Raton: CRC Press.
Gelman A, Rubin DB. 1992.Inference from iterative simulation using multiple se-quences.Statistical Science7:457–472DOI 10.1214/ss/1177011136.
Hashimoto Y, Fujiki D. 2014.List of food plants and unpalatable plants of sika deer (Cervus nippon) in Japan.Humans and Nature25:133–160 (in Japanese).
Horsley SB, Stout SL, DeCalesta DS. 2003.White-tailed deer impact on the vegetation dynamics of a northern hardwood forest.Ecological Applications13:98–118
DOI 10.1890/1051-0761(2003)013[0098:WTDIOT]2.0.CO;2.
Ida H, Takahashi S. 2010.Mass mortality of oak trees had already occurred at the Edo period.Journal of Japanese Forest Society92:115–119 (in Japanese with English summary)DOI 10.4005/jjfs.92.115.
Iijima H, Nagaike T. 2015.Appropriate vegetation indices for measuring the impacts of deer on forest ecosystems.Ecological Indicators48:457–463
DOI 10.1016/j.ecolind.2014.09.009.
Itô H. 2007.Twelve-years change of a broad-leaved secondary forest in Ginkakuji-san National Forest.Bulletin of FFPRI6:93–100 (in Japanese with English summary). Itô H. 2009.A comparison of seedling emergence and survival between
Quer-cus glaucaandSymplocos prunifolia.Journal of Forest Research14:245–250
DOI 10.1007/s10310-009-0124-x.
Itô H. 2015.Effects of sika deer (Cervus nippon) on the dynamics of a broadleaved secondary forest after mass mortality of oak trees.Journal of Japanese Forest Society
97:304–308 (in Japanese with English summary)DOI 10.4005/jjfs.97.304.
Itô H, Igarashi T, Kinuura H. 2009.Changes in stand structure after the mass mortality of oak trees in Keihoku area, Kyoto City, Japan.Journal of Japanese Forestry Society
91:15–20 (in Japanese with English summary)DOI 10.4005/jjfs.91.15.
Itô H, Kinuura H, Oku H. 2011.Stand structure of a broadleaved forest withSasa-type floor after mass mortality by oak wilt disease.Journal of Japanese Forestry Society
93:84–87 (in Japanese with English summary)DOI 10.4005/jjfs.93.84.
Kabaya H. 1988.Changes of undergrowth of a broadleaved evergreen forest in relation to grazing effects by sika deer.Bulletin of the Tokyo University Forests78:67–82 (in Japanese with English summary).
Kéry M. 2004.Extinction rate estimates for plant populations in revisitation studies: importance of detectability.Conservation Biology18:570–574
DOI 10.1111/j.1523-1739.2004.00105.x.
Kéry M, Schaub M. 2012. Bayesian population analysis using WinBUGS: a hierarchical perspective. Waltham: Academic Press.
Kinuura H, Kobayashi M. 2006.Death ofQuercus crispulaby inoculation with adult
Platypus quercivorus(Coleoptera: Platypodidae).Applied Entomology and Zoology
Kobayashi M, Ueda A. 2005.Wilt disease of Fagaceae trees caused byPlatypus quercivorus
(Murayama) (Coleoptera: Platypodidae) and the associated fungus: aim is to clarify the damage factor.Journal of Japanese Forest Society87:435–450 (in Japanese with English summary)DOI 10.4005/jjfs.87.435.
Kubono T, Ito S-I. 2002.Raffaelea quercivorasp. nov. associated with mass mortality of Japanese oak, and the ambrosia beetle (Platypus quercivorus).Mycoscience
43:255–260DOI 10.1007/s102670200037.
Kuroda K, Osumi K, Oku H. 2012.Reestablishing the health of secondary forests ‘‘Satoyama’’ endangered by Japanese oak wilt: a preliminary report.Journal of Agri-cultural Extension and Rural Development 4:192–198DOI 10.5897/JAERD12.047. Lunn D, Spiegelhalter D, Thomas A, Best N. 2009.The BUGS project:
evolu-tion, critique, and future directions.Statistics in Medicine28:3049–3067
DOI 10.1002/sim.3680.
Maesako Y, Nanami S, Kanzaki M. 2007.Spatial distribution of two invasive alien species,Podocarpus nagiandSapium sebiferum, spreading in a warm-temperate evergreen forest of the Kasugayama Forest Reserve, Japan.Vegetation Science
24:103–112.
Müllerová J, Hédl R, Szabó P. 2015.Coppice abandonment and its implications for species diversity in forest vegetation.Forest Ecology and Management 343:88–100
DOI 10.1016/j.foreco.2015.02.003.
Murata M, Matsuda Y, Yamada T, Ito S. 2009.Differential spread of discoloured and non-conductive sapwood among four Fagaceae species inoculated withRaffaelea quercivora.Forest Pathology39:192–199DOI 10.1111/j.1439-0329.2009.00577.x. Murata M, Yamada T, Ito S-I. 2005.Changes in water status in seedlings of six species in
the Fagaceae after inoculation withRaffaelea quercivoraKubono et Shin-Ito.Journal of Forest Research10:251–255DOI 10.1007/s10310-004-0142-7.
Naka K. 1982.Community dynamics of evergreen broadleaf forests in southwestern Japan. I. Wind damaged trees and canopy gaps in an evergreen oak forest.Botanical Magazine Tokyo95:385–399DOI 10.1007/BF02489476.
Nakajima H, Ishida M. 2014.Decline ofQuercus crispulain abandoned coppice forests caused by secondary succession and Japanese oak wilt disease: stand dynamics over twenty years.Forest Ecology and Management 334:18–27
DOI 10.1016/j.foreco.2014.08.021.
Nakajima M. 1929.The feeding experiments of Japanese deer in the university forest in Chiba prefecture.Bulletin of the Tokyo University Forests8:95–114 (in Japanese). Obora T, Watanabe H, Yokoi S. 2013.The effect of Sika deer browsing damage on
regeneration in mass mortality area of Japanese oak trees.Journal of Japanese Society of Revegetation Technology 39:260–263 (In Japanese)DOI 10.7211/jjsrt.39.260. Rackham O. 2008.Ancient woodlands: modern threats.New Phytologist 180:571–586
DOI 10.1111/j.1469-8137.2008.02579.x.
Rooney TP. 2001.Deer impacts on forest ecosystems: a North American perspective.
Saito S, Shibata M. 2012.The forest structure and tree death rate of forest stands damaged by Japanese oak wilt in Yamagata prefecture.Journal of Japanese Forest Society94:223–228 (in Japanese with English summary)DOI 10.4005/jjfs.94.223. Shibata M, Nakashizuka T. 1995.Seed and seedling demography of four co-occurring
Carpinusspecies in a temperate deciduous forest.Ecology 76:1099–1108
DOI 10.2307/1940918.
Shimoda K, Kimura K, Kanzaki M, Yoda K. 1994.The regeneration of pioneer tree species under browsing pressure of Sika deer in an evergreen oak forest.Ecological Research9:85–92DOI 10.1007/BF02347245.
Suzuki M. 2013.Succession of abandoned coppice woodlands weakens tolerance of ground-layer vegetation to ungulate herbivory: a test involving a field experiment.
Forest Ecology and Management 289:318–324DOI 10.1016/j.foreco.2012.10.003. Svátek M, Matula R. 2015.Fine-scale spatial patterns in oak sprouting and
mortal-ity in a newly restored coppice.Forest Ecology and Management348:117–123
DOI 10.1016/j.foreco.2015.03.048.
Takatsuki S. 1989.Effects of deer on plants and plant communities.Japanese Journal of Ecology 39:67–80 (in Japanese with English summary).