Series V: Economic Sciences • Vol. 9 (58) No. 2 - 2016
Estimating the economic impact of tourism industry
through the MM approach
C. SOCCI
1, Y. ALI
2M. CIASCHINI
3,
R. PRETAROLI
4, F. SEVERINI
3Abstract: Tourism is one of the fastest growing industries in Italy and has proven to be a valuable source of economic prosperity. The main issue emerging when measuring the impact of tourism is that tourism is usually considered as a specific industry while in most applied situations it shows traits of a complex and structured economic activity characterized by a blend of different industries. We will identify the relationship among the various industries making up the complex economic activity usually referred as the “tourism industry”. This is done through the application of the multisectoral analysis to the Italian case. The evaluation of tourism in terms of economic policy is performed through the definition of an index of interaction among industries.
Key-words: Output changes, Input-Output Model, Key industry, Macro Multiplier approach
1. Introduction and methodology
Tourism is suitable, under many ways, to bring economic advantages to operators in a country or a region. The World Travel and Tourism Council (WTTC) statistics suggests that tourism is the second largest industry in the world, which generates 200 million jobs worldwide and accounts for 10% of global GDP (WTTC, 2003).
However when measuring the impact of the tourism industry both on total output and GDP the main problem which arises is that a distinct tourism industry doesn’t exists within list of industries in national accounts (NACE-CLIO) and the quantitative links between the “tourism industry” and the industry outputs and GDP of the economy have to be carefully reconstructed (Smeral, 2006). Tourism industry appears then as an economic activity that relies on outputs and services provided to tourists by the various industries that constitute the producing core of economy. For
1
Corresponding author: claudio.socci@unimc.it, Department of Economics and Law, via Crescimbeni
14, 62100 Macerata – ITALY, phone number +3907332583263.
2
Ghulam Ishaq Khan Institute of Engineering Sciences and Technology, Topi, Pakistan.
3
Department of Economics and Law, University of Macerata, Italy.
4
identifying the potential economic contribution of tourism to a country's economy the relationships of tourism data with data in the national accounts have to be put under scrutiny as to the consistency and reliability of the source of information on the economic dimensions of tourism. These reasons lead to consider the “tourism industry” as a cluster of industrial activities associated with tourism: the Tourism Cluster (Babalola, 2011).
Our study starts as an analysis of dispersion in an I-O model of the Italian
economy based on an I-O table (industry by industry) for year 2010 with 64
industries a tool for analyzing tourism effects and quantifying the direct and indirect impacts of tourism as highlighted by (Henry and Deane, 1997; Fletcher, 1994; Archer and Fletcher, 1996; Tyrrell and Johnston, 2001; Gul, 2015). We then further deepen this analysis through the identification and quantitative determination of aggregated Macro Multipliers (MM) (Ciaschini and Socci, 2006) that drive the magnitude of the economic interactions through the structure of macroeconomic variables (Ciaschini and Socci, 2007). The reference to two indices: “target efficiency” and “control effectiveness” (Ali et al., 2015) will help the analysis extending the focus from the industries towards the policies, intended as those combinations of industries composing both the policy control variables and the policy target.
2. Tourism industry as a cluster of industries
Tourism is one of the fastest growing industries in Italy. It has proven as to be a valuable economic pillar of the Italian economy and we urgently need to determine what really falls under tourism as a complex process. According to (UNWTO) certain economic industries are defined as tourism industries (United Nations, 2008). However, the tourism industry is implicitly included in the I-O tables as part of the production of different industries such as “Accommodation services for visitors”, “Hotel and Restaurant”, “Food and beverage industry”, “Land transport”, “Water transport”, “Rail transport”, “Air transport”, “Supporting and auxiliary transport services, recreational, culture and sporting services”, “retailing industry and country specific tourism industry” (Maresca and Anzalone, 2011).
VAT reduction in the Italian hotels and restaurants industry; (Tantirigama and Taniguchi, 2009) used an input output multiplier approach to measure the economic impacts of transport and tourism in New Zealand. According to Fletcher (1989) the I-O analysis has been used in measuring the impact of tourism on economies as it is more comprehensive in providing a holistic picture of economic structure. Fan and Ooasterhaven (2005) investigated the impact of international tourism on the Chinese economy.
The mixed structure and the consistency of ‘complex’ tourism industry strictly depend on the qualitative and quantitative elements emerging prevalently on the demand side. In this context tourism refers to the extent in which change in prices, competition, promotion, quality and quantity of facilities determine the change in the number of tourists in a given area. The demand approach, then, overcomes the difficulties in the industry approach by redirecting the focus towards tourists (Madsen and Zhang, 2010).
Usually tourism is associated with various motivations of visiting a place away from home. Different people have different ideas about the chemistry of tourism, although they may not all agree with the same definition. Henry and Deane (1997) describe tourism as follows: “Tourism is referred to as an industry, but that is a misnomer. From the perspective of the tourist, he or she demands an extraordinary range of goods and services during the course of a holiday, or a visit to another country. The needs of tourists are not met by accommodation, transport, dining, and one or two other basics alone, but extend to such diverse areas as banking, medical and dental care, security, manufacturing, telecommunications, sewerage and other such attributes. From the perspective of the supply side, some operators, such as hoteliers, see themselves as integral components of this industry. Others, such as a medical doctor or a mail carrier, of course would not think along those lines as they provide services to public with no special interest in the tourists. But, nevertheless, their services include meeting the needs of tourists which essentially make them part of the tourist industry”.
From the perspective of different analysts, it can be summed up that tourism refers to visiting a place away from home, the visitor should be someone who is travelling under certain conditions, for pleasures, education, medical treatment, business or other purposes (Steenge and Steeg, 2010). In this context, tourism is not only related to fun and pleasures but also means of fulfilling other purposes.
For a quantitative study of tourism, it is important to have both conceptual basis as well as empirical tools to measure the impact of tourism related activities. Equally important is to determine which industries relate to tourism industry, and what percentage of their total sales should be attributed to tourism industry, so that all these fractions can be composed into larger pieces without altering the national accounts structure.
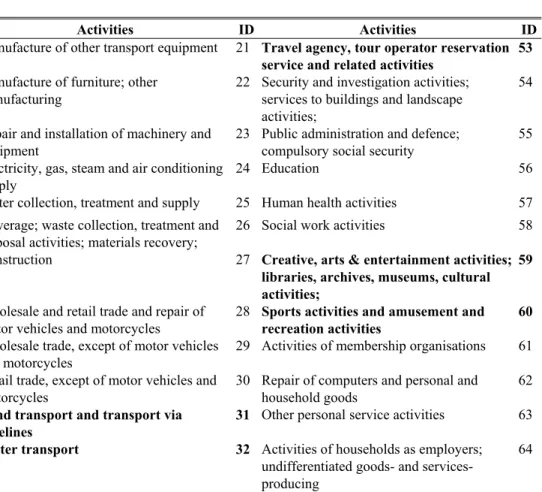
Almost all industries of an economy directly and indirectly benefit from the tourism industry given that provides services across all sectors of the economy. Among the industries those which directly benefit from tourism include transportation i.e. land transport, water transport, air transport, which correspond to industries nr. 31, 32 and 33 in the NACE-CLIO classification of industries at 64 sectors. The cluster also includes industries as 36. “Accommodation and food service activities”, 53. “Travel agency, tour operator reservation service and related activities”, 59. “Creative, arts & entertainment activities; libraries, archives, museums, cultural activities” and 60. “Sports activities and amusement and recreation activities”. In fact, more tourist-travelers mean more use of transportation, more food and beverages consumption, more credit flow to hotels and restaurants. These seven industries, nonetheless, define the Tourism Cluster (TC) that we utilize in our applied work.
Tourism affects the economy of a country through various means. Government and industries recognize the contribution of tourism to the economy in terms of employment, revenues, income generation, balance of payment and investment. Basically, tourism is a labour intensive industry and the greatest proportion of its value derives from wages and salaries paid to those employed in full time jobs. The industrial sectors, in which those jobs are based, either directly serve the needs of tourist or indirectly benefit from the tourists expenditures. In the economic perspectives, tourism is also important for the economy because it generates employment for locals and increases profit margins in various industrial sectors of a country.
services, while the contribution of tourism to economic activity worldwide is estimated at some 5%. This represents 6-7% of the overall number of jobs worldwide (UNWTO, 2010).
3. Tourism and Input-Output analysis
Information related to tourism, as models and data, must affect both the tourism activities as well as their relationship with other activities, within and outside the local and regional economic system. I-O analysis can provide a useful tool for the study of the complex tourism industry, since it spells out the model of interactions among industries composing the economy also with reference to the seven industries forming tourism industries set that we have defined above. Moreover, it offers a database strictly consistent with the definitions of intersectoral variables in the model for a reliable quantification of interindustry flows. It gives the possibility of quantifying the economic impacts, in terms of direct, indirect and induced impacts and deriving multipliers making use of the two matrices, supply and use, made available in national accounts. The main postulates and applications of I-O analysis have been discussed in (Ahlert, 2009; Miller and Blair, 2009; Leontief, 1986; EUROSTAT, 2008; Ten, 2005). Fletcher (Fletcher, 1989) discussed in details the use of I-O analysis in studying the economic impact of tourism. While (Archer, 1982) debated the use of I-O models for Tourism industry. He also analyzed different policy choices to compare each one for its implications on income, employment and wages, which would be valuable to policy makers and policy planners in the tourism industry.
In the I-O model the total output x of n industries is a function of the interdependencies among the industries, describe by the technical coefficient matrix A, and consumption of commodities in each industry, denoted by the final use vector c.
The original structure of the Leontief model is shown in the below equation.
x =Ax + c (1)
Solving equation 1 to get the total output can be in the form
x = (I - A) -1 c (2)
The equilibrium output vector can also be written as
x = L c (3)
where (I - A)-1 = L is the Leontief inverse.
inverse. The model can identify the most efficient structure that quantify the aggregate scale effects and the associated structures of the impact of a change in final demand on total output.
Through the MM approach key structure of the exogenous variable (final demand change) can be identified in order to obtain the expected total output change. Avoiding the main criticism associated with the traditional multiplier analysis which is affected by the unrealistic structure of the exogenous shock (Ciaschini et. al, 2009), the MM analysis overcomes this limit and identify the most convenient structure of the policy control (final demand for tourism industry) by which the shock on economy is modelled.
The SVD of the n x n matrix L can be written as the product of three matrices:
L = USVT (4)
Matrices U and V are two unitary or orthonormal basis matrices of dimension n x n.
The columns of matrix U represent the structures of the objective variables (the total output) through which all the results are observed and evaluated. These structures are called the key structures of the policy objectives. The rows of unitary matrix V give the structures of the policy controls, these structures measure and establish the
composition of all the possible control policies. Matrix S is an n x n diagonal matrix
whose elements are positive scalars called singular values. The elements along the diagonal represent aggregate multipliers, which are all real positive and ordered according their magnitude as: s1 ≥ s2 ≥ … ≥ s1n ≥ 0.
The SVD of the inverse matrix L can be express from equation (4) as a sum of
n matrices:
L = s1 u1 v1 + …+ sn un vn = si ui vi (5)
where ui and vi are the ith columns of matrix U and V and si is the ith singular
value of matrix L. As the columns of matrix V are orthonormal therefore each operator si ui viT acts as a filter.
The analysis proposed stresses then a change of view point from comparison between columns of the Leontief inverse to the relationship between the demand shock, considered as the policy control and the total output vector considered as the target variable, providing a tool for quantifying the effect of a change in the structure of the policy variable in terms of the total scale of the policy.
We can decompose the Leontief inverse and concentrate on the highest, dominating, macro multiplier for which:
L v1 = s1 u1 (6)
where vector v1 corresponds to the most “effective” control key-structure among
the set of all control key-structures, vi, i = 1, ... ,n and vector u1 is the most
these methodological bases in mind, we elaborated two indices of effectiveness and efficiency of the policy. These indices, which are still referred to each single industry, show the role of each industry inside the set of key-structures and quantify their relevance both in terms of what we defined “target efficiency” and “control effectiveness”. For the set of the target key-structures, given in the columns of matrix U, it is possible to define the following index of target efficiency of industry i on target j:
∑ ∑ ∑ = = = = n i m j j ij n j j ij
ij j ij u s n u s u s n 1 1 2 1 1 1 µ (7)
which quantifies the relevance of the ith industry on the jth unitary target structure
weighted by the scale effect given by the jth Macro multipliers that impacts on it.
When this index takes a value lower than 1, µij < 1, the corresponding ith industry is
of low relevance within the jth target key-structures.
It is also possible to define an index starting from the set of the control key-structures determined in columns of matrix V. We defined this index as policy
effectiveness of industry i on control j and shows the relevance of the single sector
component vij, within the structure of the jth policy key-sector.
∑ ∑ ∑ = = = = n i m j ij n j ij ij ij v n v v n 1 1 2 1 1 1 γ (8)
In particular, this index makes explicit the role played by the selected industry
within the control key-structure which will cause the attainment of the jth target
structures uj, activating corresponding Macro Multiplier sj on the target. When this
index takes a value lower than 1, γij< 1, the corresponding ith industry is of low
relevance within the jth control key-structures.
4. Dispersions analysis for Tourism industry
4.1. Power and sensitivity dispersion for Tourism industry
reduced form of the model, we can build two types of indices of dispersion that are able to evaluate quantitatively the role of any commodity produced in terms of power of dispersion and sensitivity of dispersion.
The first type of index stresses the relevance of a commodity in activating the
production chain evaluating an increase of a unit final demand shock of the ith good
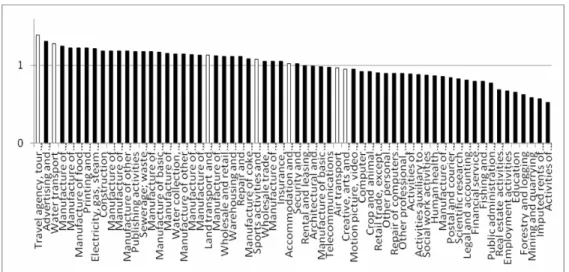
in terms of a change of the output of all other commodities. The second type of index evaluates the relevance of a commodity when a unit final demand shock on all commodities is imposed. These indices of dispersion determine those key commodities that play a significant role in particular in the industries of the tourism industries set and give a rank to all commodities in terms of power and sensitivity of dispersion. Results of the power of dispersion and sensitivity of dispersion indices are reported in the Figures 1 and 2 below. The TC industries are represented with histogram bars coloured white. These figures show the results based on the Leontief inverse for the period of 2010.
Fig. 1. Power of Dispersion (PD): Tourism Relevance
Using the dispersion analysis proposed by Rasmussen (Rasmussen, 1956), an industry is considered as a key industry if PDj > 1 and SDi > 1. In the second case if
for an industry PDj < 1 and SDi > 1 then the industry is considered as a sensitivity of
dispersion oriented industry. In the third case is if PDj > 1 and SDj < 1 then the
industry is considered as power of dispersion oriented industry (Khanal, 2014; Soulie, 2014; Cai et al., 2006).
36.“Accommodation and food service activities” are also among these industries. The results for power of dispersion are shown in Figure 1. These results indicate for TC industries that 53.“Travel agency, tour operator reservation service and related activities” and 32.“Water transport and transport via pipelines” occupy two highest ranks within all industries. From Figure 1 we also observe that 34 industries out of 64 for which the value of index is greater than one Five of the seven TC industries belong to this group.
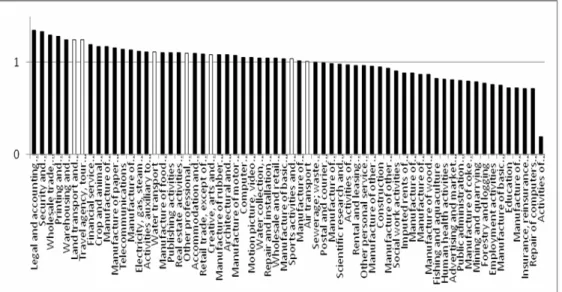
Fig. 2. Sensitivity Dispersion (SD): Tourism Relevance
Figure 2 shows the sensitivity dispersion index for the Italian economy. The results of the sensitivity of dispersion indicate that “Wholesale trade, except of motor vehicles and motorcycles” is the key and highest rank industry among the 27 industries out of 64. The second key industry is “Land transport and transport via pipelines”, an industry of the TC. The results support the importance of different industries in stimulating the economic growth of Italy tourism industry is involved in both the power and sensitivity dispersion effects
4.2 . Policy target efficiency and policy control effectiveness
equation (6) reveals the role played by the selected commodity inside the target
structures ui when the corresponding Macro Multiplier si is activated. When the
value of this index is lower than 1 (i.e. µij<1) than the commodity has a low
importance inside the target structure.
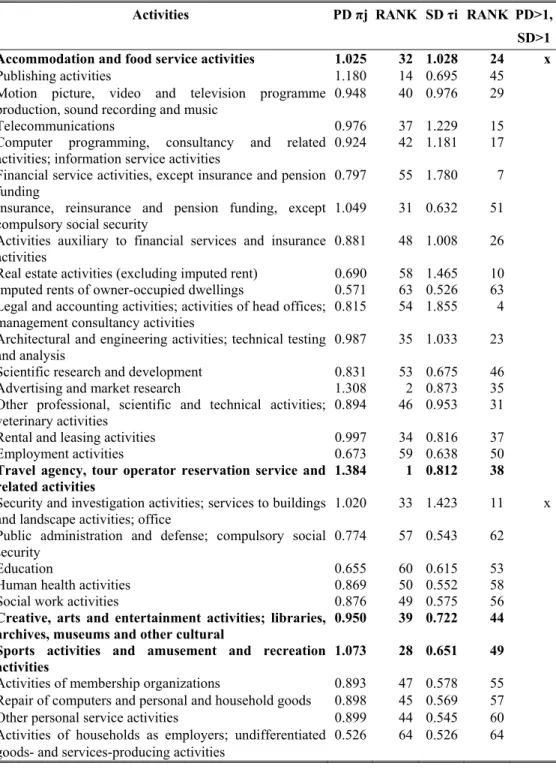
The results regarding the target structures are shown in Figure 3. We observe that 37 industries out of 64 for which the value of index is greater than 1; among these the TC industries whose bars are coloured in white. We notice that industry 46. “Legal and accounting activities; activities of head offices; management consultancy activities” get a high score among the 37 upper target structures. All the seven industries composing the tourism set are placed in the upper target structures.
Fig. 3. Policy Target Efficiency (PTE)
Fig. 4. Policy Control Effectiveness (PCE)
The Policy Control Effectiveness is given in eq. (7), which quantifies the importance
of the ith good in all the n control structures. In particular, this index reveals the role
played by the selected commodity inside the control structure (vi). When the index
assumes a value lower than 1 (i.e. γij < 1) than the commodity has a low importance
inside the control structure. Further, these indices identify the relevant structures of final demand in which the TC industries play a role in terms of tool of economic policy. From figure 4 we can identify 38 key structures of final demand that have an
index greater or equal to one (γij≥ 1). On the basis of these structures of final demand
we can identify the commodities that get the major changes in terms of output.
From figure 4 we see that industry 46. “Land Legal and accounting activities; activities of head offices; management consultancy activities” plays a role within the upper 38 control structures. For what regards TC industries all the 7 industries are placed in the upper target structures. From table A3 in the appendix we can see that 53. “Travel agency, tour operator reservation service and related activities” get the highest rank, 5, among the entire tourism set industries. Another influential industry of the tourism set is 31. “Land transport and transport via pipelines” which is ranked 7.
5. Policy target and policy control structures
whole also impacts the remaining industries’ outputs. We then determine a set of 64 MM, a set of 64 structures of demand control, rows of matrix VT, and a set of 64 structures of objective, the columns of matrix U. The structures identified by matrix VT and U together with matrix S determine all the possible behaviours of the economic system.
From the set of structures of the target variable, si ui (i=1,…,64), it is possible
to choose the most effective policies for the TC. Table 1 shows the most effective policies that give the highest push to at least one of the industries composing the
tourism industry set. Policy structure 1 has a modulus multiplier s1, a demand
control structure v1 and an overall policy effect on the target, s1ui1, which is shown
in the second column of table 1. We notice that the most relevant component is industry 31. “Land transport and transport via pipelines services”.
Policy structure 18 is a convenient structure for industry 53. “Travel agency, tour operator reservation service and related activities”. However, the impact is in
opposite direction. Target policy structure 24 can be seen from the 4th column of
table 1. This policy has a relevant impact on industry 59. “Creative, arts & entertainment activities”. Target policy structure 49 has a relevant impact on
industry 33. “Air transport sector”. Target policy structure 50 can be seen in the 6th
column of table 1. This policy has a relevant impact on industry 60. “Sports activities & amusement and recreation activities”. Target policy structure 57 has a relevant impact on industry 36. “Accommodation and food service activities” and finally the relevant impact of target policy structure 60 is on industry 32. “Water transport services”. Since policy 1 is a dominating policy, which means a specific demand driven policy that has the highest multiplier effect on outputs, the policy control gives a consistent expansive push to all industries. The policy control structure v1 of all positive final demand changes generates a vector of all positive (target variable) total output changes s1u1. The structure of policy target 1 is shown in figure 5.
Key Objective policy structures: 1, 18, 24, 49, 50,57,60 Key policies control Structures: 24, 49, 50, 55, 57, 60
Key Objective policy structures: 1, 18, 24, 49, 50,57,60 Key policies control Structures: 24, 49, 50, 55, 57, 60
x15 0.50 -0.16 -0.13 0.00 0.01 0.00 -0.01 f15 -0.13 0.00 0.00 0.00 0.00 -0.01 x16 0.47 -0.11 0.16 0.05 -0.03 -0.02 -0.02 f16 0.14 0.05 -0.03 0.03 -0.02 -0.02 x17 0.19 0.44 -0.20 0.02 0.00 0.03 -0.01 f17 -0.19 0.02 0.00 0.02 0.03 -0.01 x18 0.25 0.39 0.27 0.02 0.02 0.01 0.01 f18 0.24 0.02 0.01 0.00 0.01 0.01 x19 0.34 0.02 0.02 0.01 0.02 0.02 0.02 f19 0.03 0.02 0.01 -0.01 0.02 0.03 x20 0.19 0.15 -0.25 0.06 -0.05 0.09 0.00 f20 -0.22 0.07 -0.05 -0.02 0.10 0.00 x21 0.18 0.32 0.04 -0.06 0.04 0.06 0.09 f21 0.04 -0.07 0.04 -0.02 0.06 0.12 x22 0.18 -0.05 0.19 0.00 0.02 0.03 0.01 f22 0.17 0.00 0.02 -0.02 0.03 0.01 x23 0.17 0.03 0.02 -0.24 0.09 -0.05 0.03 f23 0.03 -0.23 0.09 -0.12 -0.05 0.03 x24 0.56 -0.24 -0.11 0.04 -0.02 -0.01 -0.02 f24 -0.10 0.05 -0.03 -0.02 0.00 -0.01 x25 0.14 -0.11 -0.08 0.08 -0.10 -0.02 0.01 f25 -0.08 0.08 -0.10 0.06 -0.02 0.01 x26 0.26 0.40 0.01 -0.03 0.04 0.04 0.00 f26 0.01 -0.05 0.03 -0.02 0.04 0.00 x27 0.34 -0.06 -0.08 -0.02 0.00 0.00 0.01 f27 -0.07 -0.02 -0.01 0.04 0.00 0.01 x28 0.16 0.07 -0.19 -0.09 0.11 -0.17 -0.01 f28 -0.18 -0.09 0.11 -0.05 -0.16 -0.01 x29 0.67 -0.03 -0.17 0.00 -0.10 -0.21 0.04 f29 -0.15 0.00 -0.11 -0.12 -0.22 0.05 x30 0.19 -0.05 0.01 0.00 -0.04 -0.16 -0.04 f30 0.00 0.00 -0.04 0.31 -0.15 -0.04 x31 0.62 0.20 0.04 -0.05 -0.12 0.02 0.03 f31 0.04 -0.04 -0.13 0.47 0.02 0.04 x32 0.16 -0.11 -0.05 -0.29 0.18 -0.17 -0.56 f32 -0.05 -0.29 0.18 0.10 -0.18 -0.58 x33 0.12 -0.02 -0.03 0.52 -0.26 -0.10 -0.29 f33 -0.03 0.52 -0.26 -0.05 -0.11 -0.30 x34 0.41 0.05 0.07 0.11 0.05 0.06 0.08 f34 0.06 0.12 0.04 -0.42 0.07 0.10 x35 0.10 -0.03 0.00 -0.14 0.15 -0.05 -0.05 f35 0.00 -0.14 0.15 -0.40 -0.05 -0.05 x36 0.23 -0.17 -0.05 0.03 -0.02 0.48 -0.40 f36 -0.04 0.03 -0.02 -0.12 0.48 -0.42 x37 0.17 -0.03 -0.02 0.01 -0.04 0.43 0.04 f37 -0.01 0.01 -0.03 0.06 0.42 0.03 x38 0.20 0.18 -0.14 0.01 0.01 0.01 -0.04 f38 -0.09 0.01 0.01 -0.02 0.02 -0.04 x39 0.28 -0.12 0.09 0.07 0.11 -0.02 -0.06 f39 0.08 0.07 0.11 0.16 -0.02 -0.07 x40 0.24 -0.04 0.09 0.00 -0.06 -0.01 0.00 f40 0.08 0.00 -0.05 -0.02 -0.01 0.00 x41 0.38 0.01 -0.02 0.02 0.02 0.10 -0.01 f41 -0.01 0.02 0.02 0.11 0.12 -0.01 x42 0.10 0.04 -0.02 -0.02 -0.02 -0.02 0.01 f42 -0.02 -0.01 -0.02 0.00 -0.02 0.01 x43 0.16 0.08 -0.02 0.00 -0.03 -0.07 0.02 f43 -0.02 0.00 -0.02 -0.05 -0.06 0.01 x44 0.29 -0.12 0.06 0.02 0.01 0.10 0.08 f44 0.05 0.02 0.01 -0.27 0.11 0.09 x45 0.01 0.00 -0.01 -0.22 -0.17 -0.11 0.00 f45 0.00 -0.22 -0.17 -0.18 -0.11 0.00 x46 0.44 -0.09 0.04 -0.09 0.24 0.12 -0.06 f46 0.04 -0.09 0.24 0.21 0.14 -0.07 x47 0.22 0.01 -0.06 0.01 0.01 -0.02 0.01 f47 -0.05 0.01 0.01 -0.01 -0.01 0.00 x48 0.09 0.04 -0.02 -0.04 -0.05 -0.08 0.00 f48 -0.01 -0.04 -0.05 -0.04 -0.08 0.00 x49 0.23 0.16 -0.25 0.00 0.00 -0.01 0.02 f49 -0.25 0.00 0.00 -0.01 0.00 0.01 x50 0.18 -0.04 0.00 0.21 0.01 -0.09 0.02 f50 0.00 0.22 0.01 -0.05 -0.09 0.01 x51 0.17 -0.06 0.02 -0.04 0.19 0.07 0.17 f51 0.02 -0.03 0.19 0.09 0.08 0.20 x52 0.06 -0.02 -0.01 -0.27 -0.13 -0.03 0.00 f52 -0.01 -0.27 -0.13 0.06 -0.02 -0.01 x53 0.23 -0.45 -0.10 -0.02 -0.02 0.16 0.41 f53 -0.10 -0.01 -0.03 0.07 0.16 0.43 x54 0.34 -0.10 0.17 -0.12 -0.34 -0.14 0.00 f54 0.15 -0.13 -0.35 -0.08 -0.14 -0.01 x55 0.05 0.00 0.01 0.03 0.33 -0.06 0.01 f55 0.01 0.03 0.33 -0.03 -0.06 0.01 x56 0.05 -0.02 -0.02 0.03 0.01 0.02 0.00 f56 -0.02 0.03 0.01 -0.09 0.02 0.00 x57 0.06 -0.03 0.00 0.03 0.08 0.01 0.01 f57 0.00 0.02 0.07 0.00 0.01 0.01 x58 0.06 -0.12 -0.48 -0.01 -0.03 -0.07 0.04 f58 -0.44 -0.01 -0.03 -0.02 -0.06 0.03 x59 0.11 -0.05 0.51 0.11 0.33 -0.02 0.02 f59 0.46 0.11 0.34 -0.02 -0.02 0.02 x60 0.11 -0.05 0.39 -0.17 -0.48 -0.04 0.01 f60 0.36 -0.17 -0.47 0.02 -0.04 0.01 x61 0.08 0.01 0.03 0.45 0.09 -0.12 0.02 f61 0.03 0.45 0.09 0.08 -0.12 0.02 x62 0.07 0.03 -0.01 -0.12 -0.07 -0.05 0.01 f62 -0.01 -0.12 -0.07 -0.09 -0.05 0.01 x63 0.07 -0.12 -0.02 -0.07 0.04 -0.04 -0.01 f63 -0.02 -0.06 0.03 0.14 -0.04 -0.01 x64 0.00 0.00 0.00 0.00 0.00 0.00 0.00 f64 0.00 0.00 0.00 0.00 0.00 0.00
Among the 64 industries, a hierarchy of industries to be stimulated can be established in order to get the result of policy 1. From figure 6 we see that seven industries are stimulated at a very high degree, i.e. 8. “Manufacture of paper and paper products”, 11.“Manufacture of chemicals and chemical products”, 15.“Manufacture of basic metal”, 16.“Manufacture of fabricated metal products, except machinery and equipment”, 24.“Electricity, gas, steam and air conditioning supply”, 29.“Wholesale trade, except of motor vehicles and motorcycles" and 31.“Land transport and transport via pipelines”. Ten industries are part of a second set highly stimulated i.e. 5.“Manufacture of food products, beverages and tobacco products”, 6.“Manufacture of textiles, wearing apparel and leather products”, 9.“Printing and reproduction of recorded media”, 10.“Manufacture of coke and refined petroleum products”, 13.“Manufacture of rubber and plastic products”, 14.“Manufacture of other non-metallic mineral products", 19.“Manufacture of machinery and equipment”, 27. “Construction", 34.“warehousing and support activities for transportation” and 53.“Travel agency, tour operator reservation service and related activities”. The remaining industries are activated at a low level or very low level.
From the set of structures for the policy, vi (i=1,…,64), it is possible to choose the
most effective policies that use the Tourism Cluster. Table1 shows the most effective policies that use the output of the Tourism Cluster. From table 1 policy structure 24 uses industry 59.“Creative, arts & entertainment activities; libraries, archives, museums, cultural activities” output. Policy structure 49 uses industry 33.“Air transport services” and policy structure 50 uses industry, 60.“Sports activities and amusement and recreation activities” outputs. Policy structure 55 uses industry 31. “Land transport and transport via pipelines” and policy structure 57 the industry 36. “Accommodation and food service activities” outputs and finally policy structure 60 uses industry 53. “Travel agency, tour operator reservation service and related activities” and industry 32. “Water Transport services” outputs however the impact is in opposite direction.
Fig. 6. Dominating policy control and tourism industries
From figure 5 we can see that the highest impact is borne by a group of two industries: 29.“Wholesale trades, except of motor vehicles and motorcycles” and 31.“Land transport and transport via pipelines”. Three industries are part of a second group with highest impact: 11.“Manufacture of chemicals and chemical products”, 15.“Manufacture of basic metal” and 24.“Electricity, gas, steam and air conditioning supply”. Five industries are part of a third group with highest impact: 4.“Mining and quarrying”, 8.“Manufacture of paper and paper products”, 16.“Manufacture of fabricated metal products, except machinery and equipment”, 34.“Warehousing and support activities for transportation” and 46.“Legal and accounting activities; activities of head offices; management consultancy activities”. Fourth group of 50. “industries bears” an impact of intermediate intensity and a set of four industries is under an impact of low intensity.
6. Conclusion
issue, debated by the research community regards the economic articulation of tourism in national accounts since tourism does not appear as a distinct industry rather it looks as a cluster of industries contributing to the definition of tourism.
The evidence of our analysis starts from the results of the dispersion analysis (power of dispersion & Sensitivity of dispersion) but we expand the focus to include the discussion of the efficiency of different existing configurations of policies (policy target efficiency & policy control effectiveness)
The approach starts from the assessment of the intensity of economic flows involved in the output of the tourism industry identified with what we have defined as the Tourism Cluster: a set of industries that includes industry 31:Land transport and transport via pipelines, industry 32: Water transport, industry 33: Air transport, industry 36: Accommodation and food service activities, industry 53: Travel agency, tour operator reservation service and related activities, industry 59: Creative, arts & entertainment activities; libraries, archives, museums, cultural activities and industry 60: Sports activities & amusement and recreation activities.
Then the dispersion analysis is applied to the inverse matrix of the multisectoral model. The results obtained emphasize the relevance of a set of industries in stimulating the economic growth of Italy's tourism industry in terms of both the “power of dispersion” and “sensitivity of dispersion” effects. The results also outline the importance of key industries that have higher potential to increase the output of tourism industry. In particular, the power of dispersion reveals a high potential stimulus to other industries from a demand shock in tourism industry. The power dispersion results indicate that travel agency, tour operator reservation service and related activities is the key and highest rank industry, which plays a central role. Both the power of dispersion and the sensitivity of dispersion results confirm that the industries of the Tourism Cluster - i.e. 31.Land transport and transport via pipelines; 32. Water transport; 33 Air transport; 36 Accommodation and food service activities; 53 Travel agency, tour operator reservation service and related activities; 59 Creative, arts & entertainment activities; libraries, archives, museums, cultural activities and 60 Sports activities & amusement and recreation activities - are the key and highest rank industries for tourism.
In order to get a wider picture of the actual and potential impacts of tourism industry, the analysis has been concentrated on the role played by the sectoral composition, i.e. the structure of macroeconomic variables. Each macroeconomic variable is decomposed into an aggregated scale component and a disaggregated structure component through a rigorously consistent procedure. This advance has been realized through the application of our approach of Macro Multipliers (MM), for checking the relevance of tourism industries from a policy perspective, and this
is done in the two sides: i) the final demand, as the multisectoral policy control, and
ii) the total output, as multisectoral policy target. Within a scheme of economic
The MM analysis performed through the determination of the target efficiency and control effectiveness reveal, for the target, that all the seven tourism industries composing the Tourism Cluster, appear in the key target structures with non-negligible proportions. While the control effectiveness reveals a high potential stimulus to other industries since in all the key structures the Tourism Cluster appear with a relevant weight. Industry 53 Travel agency, tour operator reservation service and related activities get the highest rank, 5, among the entire economic industry and tourism industry. The policy problem is then transformed into the choice of a convenient structure for the policy control.
Each of the 64 MM is associated with a structure of a policy control that activates each multiplier effect. This multiplier effect is directed towards each specific industry component of the policy target according the target key structures. Focus on the dominant policy means a positive effect on the system as a whole. Both the target and control key structures associated with the dominant policy have all positive components thus the policy control increases both the scale of total output and each industrial component. In particular, the results of the analysis performed shows that tourism industry, the tourism cluster, has a role to play in the composition of both the policy target and the policy control variable. The policies of final demand are determined in terms of the effects on the target of changing the inner composition of the policy variable while its magnitude is kept constant. Then the allocation of resources directly to tourism, within a policy demand control of convenient composition, generates a general increase in total output.
The analysis also reveals the policy targets where the tourism cluster is more stimulated and further establishes that the TC is as much effective as other relevant industries in generating changes in output if it is stimulated conveniently. The results also stress the role of all other industries when the final demand policy tends to privilege tourism industry's demand. Finally, an extension of the method has been provided in terms of interaction analysis, which presents an interpretation of the strength of the mutual links between the Tourism Cluster and other industries in terms of disaggregated components of total output and final demand.
7. References
Ahlert, G., 2009. Estimating the Economic Impact of an Increase in Inbound
Tourism on the German Economy Using TSA Results. Journal of Travel
Research, 47(2), pp. 225-234.
Ali, Y., Ciaschini, M., Pretaroli, R., and Socci, C., 2015. Measuring the economic
landscape of Italy: target efficiency and control effectiveness. Journal of
Industrial and Business Economics, 42(3), pp. 297-321.
Archer, B.H., 1982. The value of multipliers and their policy implications. Tourism
Archer, B. and Fletcher, J., 1996. The economic impact of tourism in the Seychelles.
Annals of Tourism Research, 23, pp. 32-47.
Babalola, A., 2011. Tourism Cluster in Italy. Microeconomics of Competitiveness
final report, May, 34.
Cai, J., Leung, P., and Mak, J., 2006. “Tourism's Forward and Backward Linkages.”
Journal of Travel Research, 45(1): 36-52.
Ciaschini, M. and Socci, C., 2006. Income distribution and output change: a macro
multiplier approach. In: N. Salvadori (ed.), Economic Growth and
Distribution: on the Nature and Causes of the Wealth of Nations, pp. 247-270. Ciaschini, M. and Socci, C., 2007. Final demand impact on output: A macro
multiplier approach. Journal of Policy Modeling, 29(1), pp.115-132.
Ciaschini, M., Pretaroli, R. and C. Socci. 2009. A Convenient Multisectoral Policy
Control For ICT In The US Economy. Metroeconomica, 60(4), pp. 660-685.
EUROSTAT, 2008. Eurostat Manual of Supply, Use and Input-Output Tables:
Collection, Methodologies and Working Papers.” Luxembourg: Eurostat.
Fan, T. and Ooasterhaven, J., 2005. The impact of international tourism on the
Chinese economy.” Paper presented at the 15th International Input-Output Conference, Beijing, China, June.
Fletcher, J.E., 1989. Input-output analysis and tourism impact studies. Annals of
Tourism Research, 16, pp. 514-529.
Fletcher, J. 1994. “Input-output analysis." Tourism Management and Marketing Handbook, New York: Prentice Hall.
Frechtling, D. and E. Horvath. 1999. “Estimating the Multiplier Effects of Tourism Expenditures on a Local Economy through a Regional Input-Output Model.” Journal of Travel Research 37(4): 324-329.
Gul, H. and Cagatay, S., 2015. Impact Analysis of Demand-Driven Shocks in Turkey's Tourism Industry within the Framework of the Social Accounting
Matrix. Tourism Economics, 21(1), pp. 33-48.
Henry, E.W. and Deane, B., 1997. The contribution of tourism to the economy of
Ireland in 1990 and 1995. Tourism Management, 18, pp. 535-553.
Holloway, J., 2006. The Business of Tourism. London: Longman.
Khanal, B. R., Gan, C. and Becken, S., 2014. Tourism Inter-industry Linkages in the
Lao PDR Economy: An Input-Output Analysis. Tourism Economics, 20(1),
pp. 171-94.
Leontief, W., 1986. Input-output economics. Oxford: Oxford University Press.
Madsen, B. and Zhang, J., 2010. Towards a new framework for accounting and
modelling the regional and local impacts of tourism. Economic Systems
Research, 22(4), pp. 313-340.
Mak, J., 2004. Tourism and the economy: Understanding the economics of tourism.
Manente, M., 1999. Regional and Inter-Regional Economic Impacts of Tourism
Consumption: Methodology and the Case of Italy. Tourism Economics, 5(4),
pp. 425-36.
Manente, M. and Zanette, M., 2010. Macroeconomic effects of a VAT reduction in
the Italian Hotels & Restaurants industry. Economic Systems Research, 22(4),
pp. 407-425.
Maresca, S. and Anzalone, M., 2011. Versus the first Italian Tourism Satellite
Account: The production Approach. ISTAT 36.
Miller, R.E. and Blair, P.D., 2009. “Input-output analysis: foundations and
extensions.” Cambridge: Cambridge University press.
Rasmussen, P.N., 1956. Studies in inter-sectoral relations. E. Harck, 15.
Smeral, E., 2006. Tourism Satellite Accounts: A Critical Assessment. Journal of
Travel Research, 45(1), pp. 92-98.
Soulie, J. and Valle, E., 2014. Trade Effects of Specialization in Tourism: An
Inter-regional Input-Output Model of the Balearic Islands. Tourism Economics,
20(5), pp. 961-985.
Steenge, A.E. and Steeg, V., 2010. Tourism Multipliers For A Small Caribbean Island
State; The Case Of Aruba. Economic Systems Research, 22(4), pp. 359-384.
Tantirigama, T. and Taniguchi, S., 2009. Economic Impacts of Transport & Tourism
in New Zealand An Input-output Multipliers Approach. The paper submitted to NZAE Conference.
Ten, R.T., 2005. The economics of input-output analysis. Cambridge: Cambridge
University press.
Tyrrell, T.J. and R.J. Johnston. 2001. “A framework for assessing direct economic impacts of tourist events: distinguishing origins, destinations, and causes of
expenditures.” Journal of Travel Research, 40: 94-100.
United Nations, 2008. Tourism Satellite Account: Recommended Methodological
Framework.” Eurostat, Madrid, Spain.
UNWTO, 2007. Climate change and tourism: Responding to global challenges.
Advanced Summary. Davos, Switzerland: 23.
UNWTO, 2010. Tourism Highlights. 2010 Edition: UNWTO.
WTTC, 2003. Travel and Tourism: A World of Opportunity.” available at
Appendix A: Tables
Activities ID Activities ID
Crop and animal production, hunting and related service activities
1 Air transport 33
Forestry and logging 2 Warehousing and support activities for
transportation
34
Fishing and aquaculture 3 Postal and courier activities 35
Mining and quarrying 4 Accommodation and food service
activities
36
Manufacture of food products, beverages and tobacco products
5 Publishing activities 37
Manufacture of textiles, wearing apparel and leather products
6 Motion picture, video and television programme production, sound recording and music
38
Manufacture of wood and of products of wood and cork, except furniture;
7 Telecommunications 39
Manufacture of paper and paper products 8 Computer programming, consultancy and related activities; information service activities
40
Printing and reproduction of recorded media
9 Financial service activities, except insurance and pension funding
41
Manufacture of coke and refined petroleum products
10 Insurance, reinsurance and pension funding, except compulsory social security
42
Manufacture of chemicals and chemical products
11 Activities auxiliary to financial services and insurance activities
43
Manufacture of basic pharmaceutical products and pharmaceutical preparations
12 Real estate activities (excluding imputed rent)
44
Manufacture of rubber and plastic products 13 Imputed rents of owner-occupied dwellings 45
Manufacture of other non-metallic mineral products
14 Legal and accounting activities; activities of head offices; management consultancy activities
46
Manufacture of basic metals 15 Architectural and engineering activities; technical testing and analysis
47
Manufacture of fabricated metal products, except machinery and equipment
16 Scientific research and development 48
Manufacture of computer, electronic and optical products
17 Advertising and market research 49
Manufacture of electrical equipment 18 Other professional, scientific and technical activities; veterinary activities
50
Manufacture of machinery and equipment n.e.c.
19 Rental and leasing activities 51
Manufacture of motor vehicles, trailers and semi-trailers
Activities ID Activities ID
Manufacture of other transport equipment 21 Travel agency, tour operator reservation service and related activities
53
Manufacture of furniture; other manufacturing
22 Security and investigation activities; services to buildings and landscape activities;
54
Repair and installation of machinery and equipment
23 Public administration and defence; compulsory social security
55
Electricity, gas, steam and air conditioning supply
24 Education 56
Water collection, treatment and supply 25 Human health activities 57
Sewerage; waste collection, treatment and disposal activities; materials recovery;
26 Social work activities 58
Construction 27 Creative, arts & entertainment activities;
libraries, archives, museums, cultural activities;
59
Wholesale and retail trade and repair of motor vehicles and motorcycles
28 Sports activities and amusement and recreation activities
60
Wholesale trade, except of motor vehicles and motorcycles
29 Activities of membership organisations 61
Retail trade, except of motor vehicles and motorcycles
30 Repair of computers and personal and household goods
62
Land transport and transport via pipelines
31 Other personal service activities 63
Water transport 32 Activities of households as employers; undifferentiated goods- and services-producing
64
Activities PD πj RANK SD τi RANK PD>1,
SD>1
Crop and animal production, hunting and related service activities
0.923 41 0.900 33
Forestry and logging 0.623 61 0.548 59
Fishing and aquaculture 0.793 56 0.543 61
Mining and quarrying 0.583 62 1.818 5
Manufacture of food products, beverages and tobacco products
1.221 5 1.104 20 x
Manufacture of textiles, wearing apparel and leather products
1.186 9 1.105 19 x
Manufacture of wood and of products of wood and cork, except furniture; manufacture
1.150 17 0.887 34
Manufacture of paper and paper products 1.245 4 1.298 13 x
Printing and reproduction of recorded media 1.221 6 1.049 21 x
Manufacture of coke and refined petroleum products 1.080 27 1.166 18 x
Manufacture of chemicals and chemical products 1.126 23 1.794 6 x
Manufacture of basic pharmaceutical products and pharmaceutical preparations
0.979 36 0.796 40
Manufacture of rubber and plastic products 1.221 7 1.040 22 x
Manufacture of other non-metallic mineral products 1.182 13 1.006 27 x
Manufacture of basic metals 1.168 16 1.501 9 x
Manufacture of fabricated metal products, except machinery and equipment
1.186 11 1.523 8 x
Manufacture of computer, electronic and optical products 0.854 51 1.012 25
Manufacture of electrical equipment 1.141 20 0.963 30
Manufacture of machinery and equipment n.e.c. 1.176 15 1.180 16 x
Manufacture of motor vehicles, trailers and semi-trailers 1.055 30 0.856 36
Manufacture of other transport equipment 1.143 19 0.799 39
Manufacture of furniture; other manufacturing 1.132 21 0.783 41
Repair and installation of machinery and equipment 1.112 26 0.745 42
Electricity, gas, steam and air conditioning supply 1.216 8 1.918 3 x
Water collection, treatment and supply 1.146 18 0.579 54
Sewerage; waste collection, treatment and disposal activities; materials recovery; remediation
1.180 12 0.983 28
Construction 1.186 10 1.286 14 x
Wholesale and retail trade and repair of motor vehicles and motorcycles
1.116 24 0.731 43
Wholesale trade, except of motor vehicles and motorcycles 1.055 29 2.316 1 x Retail trade, except of motor vehicles and motorcycles 0.906 43 0.926 32
Land transport and transport via pipelines 1.129 22 2.032 2 x
Water transport 1.279 3 0.619 52
Air transport 0.965 38 0.657 48
Warehousing and support activities for transportation 1.115 25 1.391 12 x
Activities PD πj RANK SD τi RANK PD>1,
SD>1 Accommodation and food service activities 1.025 32 1.028 24 x
Publishing activities 1.180 14 0.695 45
Motion picture, video and television programme production, sound recording and music
0.948 40 0.976 29
Telecommunications 0.976 37 1.229 15
Computer programming, consultancy and related activities; information service activities
0.924 42 1.181 17
Financial service activities, except insurance and pension funding
0.797 55 1.780 7
Insurance, reinsurance and pension funding, except compulsory social security
1.049 31 0.632 51
Activities auxiliary to financial services and insurance activities
0.881 48 1.008 26
Real estate activities (excluding imputed rent) 0.690 58 1.465 10
Imputed rents of owner-occupied dwellings 0.571 63 0.526 63
Legal and accounting activities; activities of head offices; management consultancy activities
0.815 54 1.855 4
Architectural and engineering activities; technical testing and analysis
0.987 35 1.033 23
Scientific research and development 0.831 53 0.675 46
Advertising and market research 1.308 2 0.873 35
Other professional, scientific and technical activities; veterinary activities
0.894 46 0.953 31
Rental and leasing activities 0.997 34 0.816 37
Employment activities 0.673 59 0.638 50
Travel agency, tour operator reservation service and related activities
1.384 1 0.812 38
Security and investigation activities; services to buildings and landscape activities; office
1.020 33 1.423 11 x
Public administration and defense; compulsory social security
0.774 57 0.543 62
Education 0.655 60 0.615 53
Human health activities 0.869 50 0.552 58
Social work activities 0.876 49 0.575 56
Creative, arts and entertainment activities; libraries, archives, museums and other cultural
0.950 39 0.722 44
Sports activities and amusement and recreation activities
1.073 28 0.651 49
Activities of membership organizations 0.893 47 0.578 55
Repair of computers and personal and household goods 0.898 45 0.569 57
Other personal service activities 0.899 44 0.545 60
Activities of households as employers; undifferentiated goods- and services-producing activities
0.526 64 0.526 64
Activities BD Rank FD Rank FD>1, BD>1
Crop and animal production, hunting and related service activities
1.155 13 1.172 9 x
Forestry and logging 0.850 51 0.773 57
Fishing and aquaculture 0.904 45 0.826 51
Mining and quarrying 0.642 62 0.791 56
Manufacture of food products, beverages and tobacco products
1.026 35 1.110 17 x
Manufacture of textiles, wearing apparel and leather products
0.563 63 0.719 61
Manufacture of wood and of products of wood and cork, except furniture
0.754 60 0.868 50
Manufacture of paper and paper products 1.067 28 1.156 11 x
Printing and reproduction of recorded media 1.241 3 1.285 4 x
Manufacture of coke and refined petroleum products 0.850 52 0.798 55
Manufacture of chemicals and chemical products 1.036 32 1.135 13 x
Manufacture of basic pharmaceutical products and pharmaceutical preparatin
0.701 61 0.751 59
Manufacture of rubber and plastic products 1.047 30 1.085 24 x
Manufacture of other non-metallic mineral products 0.846 53 0.935 45
Manufacture of basic metals 0.896 46 1.042 32
Manufacture of fabricated metal products, except machinery and equipment
1.098 22 1.170 10 x
Manufacture of computer, electronic and optical products
1.005 38 1.016 34 x
Manufacture of electrical equipment 0.845 54 0.869 49
Manufacture of machinery and equipment n.e.c. 0.944 43 0.991 38
Manufacture of motor vehicles, trailers and semi-trailers 1.094 23 1.077 26 x
Manufacture of other transport equipment 0.956 41 0.961 43
Manufacture of furniture; other manufacturing 0.842 55 0.882 48
Repair and installation of machinery and equipment 1.133 15 1.049 30 x Electricity, gas, steam and air conditioning supply 1.047 29 1.121 14 x
Water collection, treatment and supply 1.158 11 1.050 29 x
Sewerage; waste collection, treatment and disposal activities;
0.972 40 1.004 36
Construction 0.876 48 0.955 44
Wholesale and retail trade and repair of motor vehicles and motorcycles
1.106 19 1.045 31 x
Wholesale trade, except of motor vehicles and motorcycles
1.238 4 1.300 3 x
Retail trade, except of motor vehicles and motorcycles 1.175 10 1.090 22 x
Activities BD Rank FD Rank FD>1, BD>1
Water transport 1.200 8 1.114 16 x
Air transport 1.101 21 1.011 35 x
Warehousing and support activities for transportation 1.212 6 1.248 5 x
Postal and courier activities 1.072 27 0.997 37 x
Accommodation and food service activities 1.152 14 1.102 20 x
Publishing activities 1.181 9 1.109 18 x
Motion picture, video and television program production, sound recording
0.951 42 1.052 28
Telecommunications 1.156 12 1.147 12 x
Computer programming, consultancy and related activities; information serv
1.012 36 1.054 27 x
Financial service activities, except insurance and pension funding
1.130 17 1.196 8 x
Insurance, reinsurance and pension funding, except compulsory social secrty
0.787 58 0.719 62
Activities auxiliary to financial services and insurance activities
1.009 37 1.116 15 x
Real estate activities (excluding imputed rent) 1.103 20 1.109 19 x
Imputed rents of owner-occupied dwellings 0.986 39 0.888 47
Legal and accounting activities; activities of head offices; management
1.347 1 1.352 1 x
Architectural and engineering activities; technical testing and analysis
1.072 26 1.082 25 x
Scientific research and development 1.029 34 0.980 39
Advertising and market research 0.876 49 0.813 53
Other professional, scientific and technical activities; veterinary activities
1.133 16 1.102 21 x
Rental and leasing activities 1.031 33 0.966 41
Employment activities 0.834 56 0.761 58
Travel agency, tour operator reservation service and related activities
1.224 5 1.243 7 x
Security and investigation activities; services to buildings and landscape
1.341 2 1.333 2 x
Public administration and defence; compulsory social security
0.886 47 0.800 54
Education 0.789 57 0.725 60
Human health activities 0.873 50 0.817 52
Social work activities 0.924 44 0.909 46
Creative, arts & entertainment activities; libraries, archives, museums, cultre
1.110 18 1.086 23 x
Sports activities and amusement and recreation activities
Activities BD Rank FD Rank FD>1, BD>1
Activities of membership organisations 1.076 25 0.975 40
Repair of computers and personal and household goods 0.787 59 0.716 63
Other personal service activities 1.043 31 0.965 42
Activities of households as employers; undifferentiated goods- and services
0.216 64 0.195 64