NICOLA VERGARA LOPES SERÃO
ASSOCIATION OF CANDIDATE GENE EXPRESSION WITH INTRAMUSCULAR
FAT CONTENT IN THE PORCINE Longissimus dorsi MUSCLE
Dissertação apresentada à Universidade Federal de Viçosa, como parte das exigências do Programa de Pós‐Graduação em Genética e Melhoramento, para obtenção do título
de Magister Scientiae.
VIÇOSA
NICOLA VERGARA LOPES SERÃO
ASSOCIATION OF CANDIDATE GENE EXPRESSION WITH INTRAMUSCULAR
FAT CONTENT IN THE PORCINE Longissimus dorsi MUSCLE
Dissertação apresentada à Universidade Federal de Viçosa, como parte das exigências do Programa de Pós‐Graduação em Genética e Melhoramento, para obtenção do título
de Magister Scientiae.
Aprovada: de julho de .
Prof. Paulo Sávio Lopes Co‐orientador
_______________________________ Prof. José Braccini Neto
Co‐orientador
Pesqa. Jane de Oliveira Peixoto
Prof. Pedro Veiga Rodrigues Paulino
_______________________________ Profa. Simone Eliza Facioni Guimarães
ii
“The further we go And older we grow The more we know The less we show”
(Primary)
Robert Smith, Simon Gallup and Laurence Tolhurst (The Cure, 1981)
iii
AGRADECIMENTOS
À Universidade Federal de Viçosa, ao Departamento de Zootecnia e ao Programa de Pós‐Graduação em Genética e Melhoramento pela oportunidade de realização de um curso público de alta qualidade.
À Coordenação de Aperfeiçoamento de Pessoal de Nível Superior CAPES , pela concessão da bolsa de estudos que tornou minha estadia em Viçosa possível e estimulante.
Pela oportunidade de estar no LABTEC, da realização deste projeto, pelos exemplos de profissionalismo, conhecimento, ambição, dedicação, estímulo e compreensão, por saber lidar comigo nos melhores e piores momentos dos meus últimos quatro anos e pela orientação educacional e extra‐classe, agradeço a minha orientadora e professora Simone, a qual fico eternamente grato e disponível.
Ao meu co‐orientador e professor Braccini, que além dos ensinamentos estatísticos e computacionais que tornaram essa tese mais robusta, me aconselhou, ensinou e estimulou a ser um estudante mais dedicado e confiante; Pelo exemplo de pessoa.
Ao professor e co‐orientador Paulo Sávio, que ao longo da minha vida acadêmica contribuiu e participou de diversas etapas de meu ensino, mais do que pode parecer.
Aos participantes da banca, professor Pedro Veiga, pela disponibilidade e atenção, e Dra. Jane Peixoto, pelo exemplo de conquistas e conhecimento.
Ao André, pelo papel determinante na realização de diversas etapas do experimento, pela confiança, disponibilidade, amizade, atenção, curiosidade, sugestões e palpites, e por tornar os inícios de semana mais agradáveis por torcer por um time fraco, muito fraco.
À Priscila, pela ajuda, confiança, amizade e pelos ensinamentos laboratoriais e de bioquímica que tornaram a realização deste trabalho possível.
Ao Seu Zé, pelas inúmeras manhãs de abate, atenção e conselhos pessoais sempre pertinentes e emocionantes.
Aos funcionários da Granja de Melhoramento de suínos da UFV, pela ajuda, atenção e disponibilidade durante toda condução do experimento.
iv
À Renata, pela sempre eterna atenção e eficiência para resolver questões da granja; Um exemplo de pessoa.
À Karine; sem palavras.
Aos amigos do LABTEC, Marieta, Katiene, Miguel, Marcos Emo, Débora, Ana Paula, Ana Maria, Kleibe e Mayara, por terem tornado o dia‐a‐dia no laboratório extremamente agradável.
Aos professores Robledo, Adair, Bajá e Paulinho, por terem me adicionado conhecimentos essenciais para a realização desta tese.
Ao Cosme e Edenio, que além de educadores, são exemplos de professores. À Isabela e Dr. Marta Guimarães, da EMBRAPA Juiz de Fora, pelas quantificações de amostras.
À Fernanda e Mário, professores Juquinha, Domício, Théa e Brustolini, do Departamento de Zootecnia, pela atenção e carinho gratuitos ao longo desses anos.
À Viviane pelo pastel assado e suco de uva do dia‐a‐dia. Ao Edson, que sempre fortaleceu o xérox no DZO. Ao Batista sempre Batista.
Ao Jack sempre Daniels.
Ao Márcio, Henrique, Zezé, Geraldo, Fabrício Serafim e Maestro, por todas as horas estressantes, divertidas e prazerosas.
Ao Alex Sandro Schierholt, pelos incentivos acadêmicos e pessoais. Pelo amigo que foi, que é e que sempre será; Valeu Feiticeira.
Ao Carlão, pela amizade, incentivo, música e companheirismo neste último ano de Viçosa; Figura indispensável.
Ao Márcio Péla, sempre atencioso; Um amigo que transcende os limites continentais.
Ao Lagartixa, Marcos, Carlinha, Maxi, Leandro, Fabrício, Fran, Tchuca, Paty, mi , Sal, Titi, Rê, Guri, Ximitre, Reinaldo, Elisa, Eliana, Daniel, Carlão e Alex, por terem sido minha família.
À Dra. Dolores por ter me ajudado e ensinado a enfrentar cada dia.
Aos meus amigos de longe, Chabil, Dvla, Anão, Dudu, Pedro, Goodi, Rê, Ximitre, Titi, Sal, Gurizinho e Gurizão, por apenas serem eles mesmos.
v
Aos meus pais e meus irmãos, sempre presentes, sinceros, presentes, carinhosos, presentes, estimulantes, presentes e presentes. Pela diferença que uma base amorosa faz.
À minha Mariana e minha Clara. Meus principais motores. Sem vocês tudo até aqui teria sido mais difícil do que realmente foi. Por serem o meu maior querer. Pelo sentido de conquista e amor que vocês me proporcionam. Por serem a minha família.
vi
BIOGRAFIA
Nicola Vergara Lopes Serão, filho de Teresa Cristina Vergara Lopes Serão e Leopoldo Serão Júnior, nasceu no Rio de Janeiro, Rio de Janeiro, no dia de junho de . É casado com Mariana Cruz Rossoni Serão e pai de Clara Rossoni Serão.
Em maio de ingressou no curso de Zootecnia da Universidade Federal de Viçosa, Viçosa, Minas Gerais, concluindo a graduação em agosto de .
Em setembro do mesmo ano, iniciou o curso de Mestrado em Genética e Melhoramento na UFV, obtendo o título de Magister Scientea no dia de julho de
.
vii
SUMÁRIO
RESUMO viii
ABSTRACT x
1. INTRODUCTION 1
2. REVIEW 3
. . INTRAMUSCULAR FAT
. . PIAU
. . REAL‐TIME POLYMERASE CHAIN REACTION
. . CANDIDATE GENES FOR PORK INTRAMUSCULAR FAT
2.4.1. ATN1 13
2.4.2. EEF1A2 13
2.4.3. FABP3 14
2.4.4. LDLR 15
2.4.5. MGP 15
2.4.6. OBSCN 15
2.4.7. PDHB 16
2.4.8. RYR1 16
2.4.9. TRDN 17
3. MATERIALS AND METHODS 19
. . ANIMALS
. . SAMPLING
. . INTRAMUSCULAR FAT CONTENT MEASUREMENT
. . TOTAL RNA EXTRACTION AND FIRST STRAND CDNA SYNTHESIS
. . PRIMERS DESIGN FOR REAL‐TIME PCR
. . REAL‐TIME PCR REACTIONS
. . STATISTICAL ANALYSIS
3.7.1. Normality test 24
3.7.2. Analysis of covariance (ANCOVA) 24 3.7.3. Analysis of variance (ANOVA) and multiple comparison test 25
3.7.4. Correlations 25
3.7.5. Prediction equation for IMF 26
4. RESULTS AND DISCUSSION 27
. . IMF
. . ATN
. . EEF A
. . FABP
. . LDLR
. . MGP
. . OBSCN
. . PDHB
. . RYR
. . TRDN
. . CORRELATION OF IMF WITH EXPRESSION OF CANDIDATE GENES
. . PREDICTION EQUATION OF IMF
5. IMPLICATIONS 59
viii
RESUMO
SERÃO, Nicola Vergara Lopes, M.Sc., Universidade Federal de Viçosa, julho de .
Associação da expressão de genes candidatos com teor de gordura
intramuscular no músculo Longissimus dorsi de suínos. Orientadora: Simone Eliza Facioni Guimarães. Co‐orientadores: José Braccini Neto e Paulo Sávio Lopes.
ix
apresentarem maiores níveis de expressão de TRDN que suínos Comerciais P< . aos kg de peso ao abate. Usando valores preditos, os níveis de expressão de todos os genes foram correlacionados com GIM, a partir de dados de todos os animais e apenas de suínos Piau. Usando todos os dados, os níveis de expressão dos genes FABP , LDLR, TRDN, OBSCN, RYR e PDHB foram positivamente correlacionados P< . com GIM, enquanto que o gene EEF A teve correlação negativa P< . . Com os dados dos animais Piau, o gene MGP teve correlação negativa P< . com GIM e os genes LDLR, FABP , TRDN, RYR e OBSCN positiva P< . . Uma equação de predição de conteúdo de GIM, para todos os grupos genéticos, sexos e pesos ao abate, foi modelada usando valores ajustados de todos os genes. O coeficiente de determinação associado à equação foi de , %, onde os genes ATN , EEF A , MGP e PDHB atuaram diminuindo os níveis de GIM e os genes LDLR, OBSCN e TRDN aumentando a deposição de gordura no músculo longissimus dorsi. O maior potencial para deposição de GIM observado em suínos Piau indica que esta raça deve carregar genes valiosos que determinam a deposição de lipídeos no músculo. Embora alguns genes foram correlacionados com GIM e incluídos na equação de predição, o gene LDLR mostrou ter um papel importante na determinação dos níveis de GIM, devido aos seus alto valores de correlação e coeficiente de regressão, e função biológica na captação de lipídeos para dentro da célula. Além disso, mais estudos são necessários para se atribuir a este gene como gene candidato para deposição de GIM no músculo longissimus dorsi em suínos.
x
ABSTRACT
SERÃO, Nicola Vergara Lopes, M.Sc., Universidade Federal de Viçosa, July, .
Association of candidate gene expression with intramuscular fat content
in the porcine Longissimus dorsi muscle. Adviser: Simone Eliza Facioni Guimarães. Co‐advisers: José Braccini Neto and Paulo Sávio Lopes.
This work was realized with the objective to provide information about the expression pattern of candidate genes, by real‐time polymerase chain reaction qPCR , and correlate it to intramuscular fat IMF content in pigs from both sexes, of Piau, Commercial and Crossbred genetic groups, slaughtered at , , and
Kg. Longissimus dorsi muscle samples were taken for IMF measurement and
xi
from all genes were correlated to IMF content using data from all animals and only from Piau pigs. Using the whole data, expression levels of FABP , LDLR, TRDN, OBSCN, RYR and PDHB genes were positively correlated P< . with IMF content while EEF A showed negative correlation P< . . In Piau animals, MGP was negatively correlated P< . with IMF and, LDLR, FABP , TRDN, RYR and OBSCN genes positively P< . . A prediction equation for IMF content, for all genetic groups, sexes and slaughter weights, was modeled using adjusted values of all genes. The coefficient of determination associated to this equation was . %, where ATN , EEF A , MGP and PDHB genes act lowering IMF levels and LDLR, OBSCN and TRDN increasing fat deposition in longissimus dorsi muscle. The higher potential of IMF deposition observed in Piau pigs, indicates that this breed may carry valuable genes for determine lipid deposition in muscle. Although some genes were correlated and included in the prediction equation, LDLR gene showed to play an important role on the determination of IMF levels, due its high values of correlation and regression coefficient, and biological function of lipid recruitment into the cell. Thus, more studies are required to assign this gene as a candidate gene for intramuscular fat deposition in longissimus dorsi muscle in pigs.
1
1. Introduction
A lot of progress in livestock breeding has been made in the last few decades, but the process of achieving greater understanding of how to improve meat quality was slow before molecular technology markers became accessible with wide applications in breeding schemes Gao et al., . Meat quality is an economically important trait in farm animals. Quality requires analysis and classification of fat content, composition, tenderness, water‐holding capacity, color, oxidative stability and uniformity. It is influenced by several factors, including breed, genotype, gender, feeding, fasting, pre‐slaughter handling, stunning, slaughter weight, slaughter methods, chilling and storage conditions Rosenvold & Andersen, .
Pork is the most consumed meat worldwide, and its consumption is dependent on consumer satisfaction. Consequently, high pork quality stimulates consumption, which is beneficial to the meat industry. However, the term meat quality includes a variety of different aspects, and the most important of these are hygiene, toxicology, nutrition, technology function and sensory eating quality Hullberg, . For a successful pork industry, meat products must satisfy the consumer. The satisfaction of the consumers can be achieved at the point of purchase as well as at the point of consumption Fortin et al., . Once a product has been purchased, consumers respond to the smell, taste, and texture of the meat, which result in hedonic or value judgments, based upon past personal experience Jeremiah, . It is generally accepted that a higher content of intramuscular fat, or marbling, has a positive influence on the sensory experience associated with eating pork Fortin et al., .
2
data, using a broad variety of techniques such as sequencing, mutational, transgenic and expression analysis Pomp et al., .
The objective of this work is to provide information about the expression pattern of candidate genes, through real‐time polymerase chain reactions, and to correlate it with intramuscular fat IMF content in pigs of different genetic groups at four slaughter weights.
3
2. Review
2.1. Intramuscular fat
Intramuscular fat IMF refers to the chemically extractable fat in a muscle sample, predominantly from adipocytes extramyocellular lipids, EMyLs and myocytes intramyocellular lipids, IMyLs . Morphologically, IMF is the total lipid associated with all cells present in a meat sample, excluding subcutaneous fat and adipocytes from the intermuscular fat Figure . . . IMyLs localize within muscle fiber cytoplasm and EMyLs localize in adipocytes interlaced between muscle fibers Shi‐Zheng and Su‐Mei, . These lipids are sources of energy for cell metabolism, and are mainly made up of phospholipids and triacylglycerols TG . Increased TG content implies a higher IMF percentage and its concentration varies within muscles fibers Essen‐Gustavsson et al., .
Figure . . – Representation of subcutaneous fat A , intermuscular fat B and intramuscular fat
C in pork longissimus dorsi cut, and differences between intramyocellular D and
extramyocellular lipids F , within and between muscle fibers E . Source: Adapted from Shi‐Zheng
and Su‐Mei, .
Muscle fiber classification is based on the ability to cope with energy consumption due to contractile activity with adequate ATP production and the parameters of the contractile response, which are determined by the protein composition of the myofibrils and sarcoplasmic reticulum. Muscle fibers of
longissimus dorsi are classified as type IIB – fast, white and glycolytic – and present
a lower intracellular concentration of TG than type I muscle fibers Gerbens, ; Reggiani & Mascarello, .
4
mechanism that provides a higher deposition of TG in adipocytes and myocytes may be beneficial for improving pork quality.
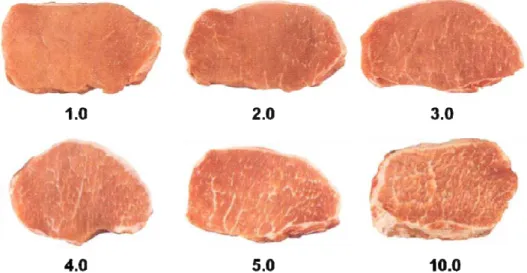
There have been numerous studies comparing sensory characteristics of different pig breeds. Intramuscular fat content is an important factor that influences sensory quality Klont et al., . The amount of visible fat is the strongest visual stimulus for the purchase decision process Fortin et al., . It may be expected that the presence of more observed marbling in a pork chop would be a positive visual cue, resulting in the purchase of that product from the retail case. In contrast, it was observed that % of consumers who had the opportunity to select packages of pork chops from a retail case containing low . % total fat , medium . % fat , and high marbled pork loin chops . % fat have chosen medium or low marbled chops Brewer et al., ; Berg, . Although lipid content is not the single source of variation in determining the sensory quality of pork Lonergan et al., , its variation explains an important part of the genetic variation in eating quality of pork. An IMF content Figure . . below the recommended optimum range of . – % diminishes eating quality, whereas a higher IMF content will not only not improve this parameter; but it may have adverse effects on consumer acceptance due to increased visibility of fat in the meat Gerbens, . Hence, many of these aspects of consumers’ acceptance, like color, appearance, juiciness, tenderness and flavor, should be taken into account to improve levels of IMF.
Figure . . – Marbling pattern from the National Pork Producers Council NPPC . Scores represent
the percentage of intramuscular fat. Source: AMSA .
5
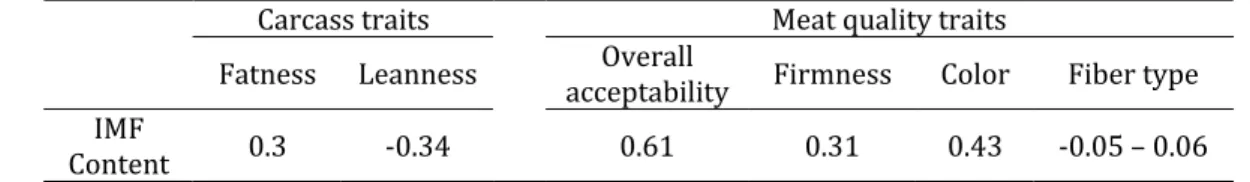
Breeding programs have resulted in genetic changes in pigs. These genetic changes are generally desired, but some of the genetic alterations made in pursuit of breeding goals seem to have unintended negative side‐effects. In order to reduce fatness in pigs, over the years many companies have begun selecting animals with lower backfat thickness BF . From the year to , BF reduced % . mm to . mm; Merks, . Genetic correlation between BF and IMF ranges from . to . de Koning et al., ; Pringle & Williams, ; Newcom et al., , and since the s, IMF content has been reduced from – % to less than % Wood, . A genetic correlation between carcass and meat quality traits has also been reported Table . . . These results indicate that genetic gain for IMF affects other meat quality traits as well, and it is feasible that in some situations these meat quality traits would be more economically attractive than production traits. Due to consumer demand, high heritability h = . , and economic value, there will still be room for genetic improvement in terms of intramuscular fat over the next few years Gerbens, .
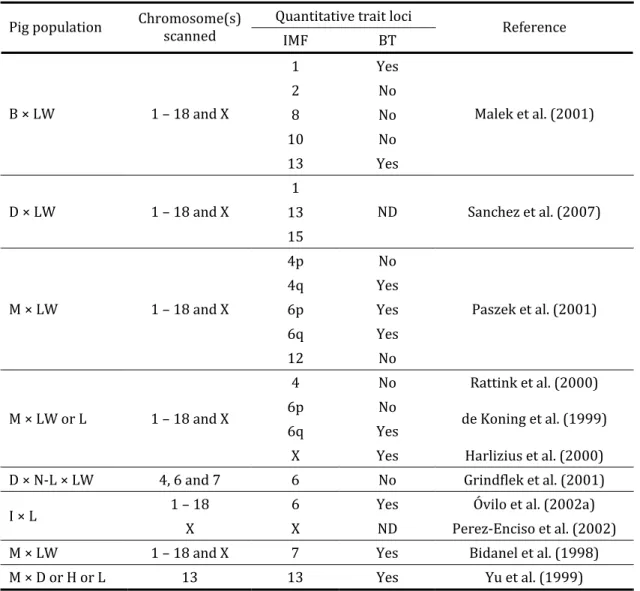
In order to detect the responsible genes underlying IMF content, many research groups have developed pig populations to identify quantitative trait loci QTL for marbling and backfat thickness Table . . . A major objective of QTL analysis in livestock is to find genetic markers that can be implemented in breeding programs by marker‐assisted selection MAS; Kim et al., . Moreover, the size of QTL regions is a major concern, since smaller QTL regions increase the genetic response from MAS Spelman & Bovenhuis, and substantially reduce the number of positional candidate genes. In addition to the positional candidate genes underlying the QTL regions affecting IMF content see section . in this review for some examples , genes may also be candidates based on existing knowledge of physiological and biochemical processes, through the candidate gene approach Gerbens, .
6
higher intramuscular fat content and rusticity Benevenuto Jr., ; Goméz Fernández, ; Renaudeau et al., ; Fan et al., ; Harcet et al., , all traits that may be interesting for genetic improvement in coming years. Thus, indigenous breeds are important resources for genetic variation.
Table . . – Average genetic correlation of intramuscular fat IMF content with carcass and meat quality traits
Carcass traits Meat quality traits
Fatness Leanness acceptability Firmness Overall Color Fiber type
IMF
Content . ‐ . . . . ‐ . – .
Source: Shi‐Zeng & Su‐Mei, .
In order to detect the responsible genes underlying IMF content, many research groups developed pig populations to identify quantitative trait loci QTL for marbling and backfat thickness Table . . . A major objective of QTL analysis in livestock is finding genetic markers that can be implemented in breeding programs by marker‐assisted selection MAS; Kim et al., . Moreover, the size of QTL regions is a major concern, since smaller QTL regions increase the genetic response from MAS Spelman & Bovenhuis, and reduce the number of positional candidate genes substantially. In addition to the positional candidate genes underlying the QTL regions affecting IMF content see section . in this review for some examples , genes may also be candidates based on existing knowledge of physiological and biochemical processes, performing the candidate gene approach Gerbens, .
7
Table . . – Reported main QTL for intramuscular fat IMF content or its related traits, total muscle lipid percentage and marbling, and backfat thickness BT in various experimental crosses of pigs
Quantitative trait loci Pig population Chromosome s scanned
IMF BT Reference
Yes
No
No
No
B × LW – and X
Yes
Malek et al.
D × LW – and X
ND Sanchez et al.
p No
q Yes
p Yes
q Yes
M × LW – and X
No
Paszek et al.
No Rattink et al.
p No
q Yes de Koning et al.
M × LW or L – and X
X Yes Harlizius et al.
D × N‐L × LW , and No Grindflek et al.
– Yes Óvilo et al. a
I × L
X X ND Perez‐Enciso et al.
M × LW – and X Yes Bidanel et al.
M × D or H or L Yes Yu et al.
B, Berkshire; D, Duroc; H, Hampshire; I, Iberian; L, Landrace; LW, Large White; M, Meishan; N‐L, Norwegian Landrace.
ND, not determined.
Source: Adapted from Gerbens, .
2.2. Piau
Farm animal genetic resources are those species that are used, or may be used, for the production of food and agriculture, and the populations within each of them. These populations within each species can be classified as wild and feral, landraces and primary populations, standardized breeds, selected lines, and any conserved genetic material FAO, .
8
concave head profiles and Iberian ear types. This Brazilian naturalized pig breed originated from other breeds introduced by Portuguese settlers in the th century, and is also influenced by Dutch and African pig breeds Vianna, . These animals are considered to be fat‐type, used to be reared in small farms, supplying farmers with meat and a large amount of fat.
Figure . . – Piau boar from the Pig Breeding Farm Universidade Federal de Viçosa, Viçosa, Minas
Gerais, Brazil .
In an agreement was signed between the Departamento Nacional de
Produção Animal National Department of Livestock Production and the
Departamento de Produção Animal da Secretaria de Agricultura do Estado de São
Paulo Livestock Production Department of the Agriculture Secretariate of the
9
Piau was the first Brazilian breed to be registered at Associação Brasileira
de Criadores de Suínos Brazilian Association of Pig Breeders or ABCS in .
Between and , , Piau pigs were registered. Since then, there has been no information about the registration of new animals. Mariante et al. a reported that the conservation status of the Piau is threatened. The last information about the population of this breed was made by Mariante et al. b . These authors reported that there were animals adult males, adult females and young in the State of Distrito Federal. Sollero et al. observed through the use of DNA microsatellite analysis, a high rate of inbreeding not only with the Distrito Federal State animals, but also in the Piau herd from Universidade Federal de Viçosa.
Since the Pig Breeding Farm at Universidade Federal de Viçosa allocates Piau pigs for research purposes. Many trials have been carried out using this breed, such as QTL mapping using divergent crosses Guimarães & Lopes, ; Pires et al., , a, b; Paixão et al., a, b; Silva et al., , , polymorphism analysis of candidate genes Soares et al., ; Figueiredo et al., ; Peixoto et al.; ; Faria et al., , meat quality, carcass and performance traits trials Band et al., a, b; Carmo et al., ; Peixoto et al., ; Faria et al., , phylogeny and genetic diversity Schierholt et al., ; Sollero et al., ; Souza et al., and expression patterns of candidate genes Moraes, . Although many Piau pigs have been used in these trials, the founder population consisted of only eight animals, which led to a high rate of inbreeding Veroneze et al., . Moreover, these animals may carry non‐ recognized valuable genes, and its conservation is an important strategy to maintain genetic diversity.
2.3. Realtime polymerase chain reaction
10
based upon hybridization e.g., Northern blotting, solution hybridization, and RNase protection assays as well as amplification of individual RNA molecules by combining reverse transcription and the polymerase chain reaction Schmittgen et al., .
Real‐time polymerase chain reaction qPCR is an in vitro technique used, simultaneously, to quantify and amplify DNA or cDNA molecules. qPCR is an efficient method for quantification of mRNA transcription levels due to its high sensitivity, reproducibility and large dynamic range; in addition, real‐time PCR is fast, easy to use and provides simultaneous measurement of gene expression in many different samples for a limited number of genes Nygard et al., .
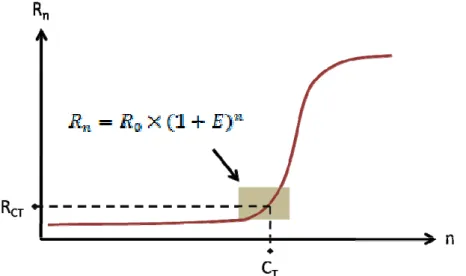
Generally, a PCR consists of four different kinetic stages. First, there is a lag phase where exponential amplification is already ongoing within the PCR tube, but no fluorescence signal above the background level is measurable. Secondly, in the logarithmic log phase an exponential growth in PCR production ideally, there is a doubling of PCR product every cycle is measurable as a fluorescent signal. Thirdly, in the retardation phase, there is an accumulation of PCR inhibiting factors and a loss of enzyme and substrates as the PCR decelerates the reaction. Fourthly, PCR reaches a steady state in the stationary phase, and no more amplicons are produced. For real‐time PCR data analysis, the second phase – log phase, with its measurable exponential growth conditions – is crucial Pannetier et al., ; Freeman et al., ; Wilhelm & Pingoud ; Schefe et al., , and its kinetics can be observed in Figure . . and described by the following equation:
The amount of fluorescence signal after n and 0 cycles is and , expressed in arbitrary units. The PCR efficiency E ≤E≤ is a major issue in qPCR data analysis. In a perfect situation, it would always achieve perfect PCR amplification. A PCR with a perfect setup would theoretically double the gene‐ specific amplicons from cycle to cycle, which would be equivalent to E= = %
11
Figure . . – qPCR amplification plot. The gray square indicates the exponential region, where the
threshold must be set. is the threshold cycle. Adapted from Schefe et al.,
Real‐time reactions are carried out in a thermocycler that permits measurement of a fluorescent detector molecule, which decreases post‐processing steps and minimizes experimental error. This is most commonly achieved through the use of fluorescence based technologies, including: probe sequences that fluoresce upon hydrolysis TaqMan® or hybridization LightCycler ; ii fluorescent hairpins; or iii intercalating dyes SYBR® Green VanGuilder et al.,
.
SYBR® Green detection methods use a dye SYBR Green I that fluoresces upon binding to double‐stranded DNA during amplification. Therefore, fluorescence enhances as amplified products amplicons accumulate. This system has the advantages of being sensitive, simple and not requiring a specific probe, only specific primers that will determine the target of amplification. Disadvantages include their indiscriminate binding to any double‐stranded DNA , which can result in fluorescence readings in the no template controls due to dye molecules binding to primer dimmers Bustin & Nolan .
12
calibrator, which is used to create a dilution series with arbitrary units. During the qPCR assay, the target threshold cycle is compared directly with the calibrator and is recorded as containing either more or less mRNA Bustin,
.
Relative quantification has the advantage of not requiring the construction of a standard curve. However, efficiencies of target and endogenous control amplifications must be approximately equal to accurate quantification. The efficiency is calculated using serial dilutions of cDNA. The results are represented in a graph and the slope is used to determine the efficiency of reaction Livak & Schimittigen, , as the following equation
Pfaffl, :
One of the critical steps in comparing transcription profiles is accurate normalization, adjusting for differences in amount and quality of starting material and differences in RNA preparation and cDNA synthesis, since the reference gene is exposed to the same preparation steps as the gene of interest. Recently a set of reference genes ACTB – actin, beta; HPRT – hypoxanthine phosphoribosyltransferase ; RPL – mitochondrial ribosomal protein L ; TBP – TATA box binding protein; TOP B – topoisomerase DNA II beta kDa have proven suitable for normalization of qPCR data in pigs Erkens et al., ; Nygard et al., .
2.4. Candidate genes for pork intramuscular fat
13
ADRP adipose differentiation‐related protein , LEPR leptin receptor , MC R, SREBP sterol regulatory element binding transcription factor , MYOD myogenic differentiation , and there are possibly others Rothschild, ; Shi‐ Zeng & Su‐Mei, .
The genes analyzed in this study were chosen from Sasaki et al. , where MGP matrix Gla protein , PDHB pyruvate dehydrogenase lipoamide beta and TRDN Triadin genes were related to changes in intramuscular fat deposition in cattle and from a Piau/Large White EST library developed at the
Universidade Federal de Viçosa Federal University of Viçosa , where ATN
atrophin , EEF A Eukaryotic translation elongation factor alpha , FABP Fatty acid binding protein , LDLR low density lipoprotein receptor and OBSCN obscurin genes were differently expressed Peixoto, . The RYR ryanodine receptor type gene was chosen due to its importance in terms of determining pork quality.
2.4.1. ATN1
In humans, unstable expansion of CAG repeat in atrophin gene ATN is responsible for Dentatorubral‐pallidoluysian atrophy DRPLA , a progressive neurodegenerative disorder Li et al., . ATN in knockout mice indicates that this gene is not essential during mouse development, because there are no differences between wild‐type and knockout mice Shen et al., . Atrophin proteins are designed to act as versatile transcriptional co‐repressors Zhang et al.,
.
2.4.2. EEF1A2
Eukaryotic translation elongation factor alpha EEF A is one of two members of the EEF A family of proteins EEF A and EEF A that bind aminoacylated tRNA and facilitate their recruitment to the ribosome during translation elongation Kulkarni et al., . EEF A proteins have other functions not related to translation such as inducing actin and tubulin cytoskeleton rearrangements Jeganathan et al., . These characteristics are consistent with the idea that the proteins regulate cytoskeletal organization Anand et al.,
14
It has been also reported that EEF A interacts with phospholipase C beta PLC‐ , a key player in the regulation of nuclear inositol lipid signaling a wide range of cellular functions, such as proliferation and differentiation Piazzi et al., . Moreover, elongation factor EEF A binds to phosphatidylinositol‐ kinase , stimulating lipid kinase activity and phosphatidylinositol‐ phosphate generation, a minor phospholipid component of cell membranes Jeganathan & Lee, .
2.4.3. FABP3
Intracellular fatty acids in intramuscular adipocytes are bounded by fatty acid‐binding proteins FABPs , which are considered to be the most important carriers of intracellular fatty acids. FABPs facilitate the transport of fatty acids from plasma membranes to the sites of fatty acid oxidation or esterification into TG or phospholipids Shi‐Zeng & Su‐Mei . FABPs have been isolated from cytosols of vertebrates and invertebrates tissues as ‐ kDa proteins. Nine FABP types have been named up to now after the first tissue from which they were isolated. They show a characteristic tissue and cellular distribution. They are postulated to be involved in fatty acid uptake and targeting, in modulation of fatty acid concentration and, in this way, in regulation of metabolism, signal transduction, gene transcription and detoxification Veerkamp & Maatman, ; Glatz & van der Vusse ; Veerkamp et al., .
Fatty acid binding protein , muscle and heart mammary‐derived growth inhibitor gene FABP is located on SSC Gerbens et al., , within or close to a QTL affecting IMF content de Koning et al., ; Grindflek et al., ; Óvilo et al., b . It is predominantly expressed in heart and skeletal muscle, although its expression is verified in other tissues, such as renal cells, testis, mammary gland, adrenal gland and brain Hertzel & Bernlohr, .
15
levels Moraes, of FABP may not affect IMF content. Thus, current information does not provide satisfactory insights to use FABP as candidate gene.
2.4.4. LDLR
The low density lipoprotein receptor gene LDLR family code for a class of structurally closely related cell surface receptors that fulfill diverse biological functions in different organs, tissues, and cell types Nykjaer & Willnow, . The role that is most commonly associated with this evolutionarily ancient family is cholesterol homeostasis maintenance of appropriate concentration of cholesterol . In humans, excess cholesterol in the blood is captured by low‐density lipoprotein LDL and removed at the liver by the endocytosis of the LDL receptor Li et al., . In pigs, elevated blood plasma cholesterol hypercholesterolemia is associated with a mutation in the low density lipoprotein receptor gene located on chromosome Hasler‐Rapacz et al., .
2.4.5. MGP
Matrix Gla protein MGP gene is located on chromosome of pigs SSC , and its mRNA was sequenced by Laize et al., . Also called Matrix Gamma‐ Carboxyclutamic Acid, the MGP is a skeletal member of the family of extracellular mineral‐binding Gla proteins Luo et al., , it is secreted by smooth vascular muscle cells and chondrocytes and accumulates in significant amounts in bone, cartilage, and dentin. MGP gene is related to tissue mineralization, and acts as a calcification inhibitor Luo et al., . Under normal circumstances, it seems that the accumulation of MGP in mineralized bone and calcified cartilage may be due its calcium‐binding properties Fraser & Price, ; Pinto et al., .
In livestock research, some investigations of MGP expression patterns indicate that this gene may act on porcine mammary gland development Su et al., , cattle adipogenesis Sasaki et al., ; Tan et al., , reproduction Ushizawa et al., and milk production Ron et al., .
2.4.6. OBSCN
16
RhoGEF gene OBSCN is located on bovine chromosome and chicken
chromosome , but has not yet been mapped on porcine genome.
This protein is part of the family of giant sarcomeric signaling proteins, along with titin and nebulin, and appears to mediate interactions between the sarcoplasmic reticulum and myofibrils. Furthermore, it binds to the sarcoplasmic reticulum by interaction with small ankyrin‐ and to the contractile myofibril via titin and sarcomeric myosin Price et al., . Unlike titin, which is an integral component of sarcomeres, obscurin intimately surrounds myofibrils at the level of the Z‐disk and M‐band, where it is appropriately positioned to participate in their assembly and integration with elements of the sarcoplasmic reticulum
Kontrogianni‐Konstantopoulos et al., .
The precise functional role of obscurin in muscle tissue is still poorly characterized, and its importance for progression of myofibrillogenesis, stability of structural organization and integrity of myofibrils remains unclear Borisov et al.,
.
2.4.7. PDHB
The mammalian mitochondrial pyruvate dehydrogenase complex PDC catalyzes an oxidative decarboxylation of pyruvate Koike et al., , transforming pyruvate into acetyl‐CoA, an important substrate in metabolism. This complex is composed of three enzymes: pyruvate dehydrogenase PDH , dehydrolipoate transacetylase, and dihydrolipoate dehydrogenase. PDH is composed of two and units. The pyruvate dehydrogenase lipoamide beta gene PDHB is located at HSA p ‐q Olson et al., , and is responsible for the two –units Ciszak et al., .
Expression of PDHB is related to energy expenditure due to its role in metabolism, and lower levels of expression are observed in high‐marbled steers
Sasaki et al., .
2.4.8. RYR1
17
proteins, and finally induces contraction Bers, . The amount of Ca + released from the sarcoplasmic reticulum is determined by the efficiency of communication between voltage‐dependent Ca + channels/dihydropyridine receptors and Ca + release channels/ryanodine receptors. Intrinsic alteration in these proteins, or in the environment that promotes their functional coupling, is known to cause contractile dysfunction and/or the pathological remodeling of cellular structures Benkusky et al., . In pigs, the ryanodine receptor type skeletal gene RYR is located at SSC q . Harbitz et al., and a single missense mutation Fuji et al., , where a cytosine is replaced by a thymine at nucleotide C T changing amino acid sequence from Arg to Cys , results in increased cytosolic Ca + levels in muscles, leading to an increased rate of muscle metabolism and lactic acid accumulation Bowker at al. .
RYR gene, also called Halothane gene HAL , is responsible for malignant hyperthermia or porcine stress syndrome PSS , a genetic disorder that results in a pale, soft and exudative meat PSE meat . This disorder may be triggered by stressful conditions, such as transportation, mating, pre‐slaughter handling, or halothane anesthesia in homozygous halothane positive HALnn pigs Fisher et al., . PSE meat is characterized by a pale, lean, soft texture and a low water‐ binding capacity Bowker et al., , and is a problematic issue for the pork industry. These adverse affects result in poor meat appearance which is unacceptable for consumers , reduced production yield of cooked ham and increased seasoning loss of dry‐cured hams Davoli & Braglia, . Although HALnn pigs result in low‐quality meat products, they provide desirable carcass traits, with leaner, shorter and heavier carcasses than halothane negative pigs Zhang et al., . Worldwide, the frequency of this defective allele has decreased to nearly zero, though some lines maintain the gene, in order to capture the increased lean meat produced from heterozygous pigs Davoli & Braglia,
.
Although many surveys have demonstrated the effect of Halothane genotypes on intramuscular fat content Zhang et al., ; Hamilton et al., ; Brewer et al., ; Band et al., , insights on how RYR gene expression patterns affect pork quality traits are scarce.
18
In skeletal muscle, depolarization‐initiated calcium release, and the subsequent muscle contraction, depends on the direct interaction between the slow voltage‐gated L‐type Ca + channel dihydropyridine receptor, DHPR and the sarcoplasmic reticulum Ca + release channel RYR in the triad junction. Release of Ca + from sarcoplasmic reticulum is also influenced by a key Ca + binding protein, calsequestrin CSQ . However, an increasing number of other proteins associated with RYRs have been identified in the triadic region and have emerged as important regulators of the Ca + release mediated by these two channels Shen et al., ; Goonasekera et al., . Expressed both in heart and skeletal muscle, triadin TRDN is a major membrane protein that is specifically localized in the junction sarcoplasmic reticulum of skeletal muscle and is thought to play an important role in muscle excitation‐contraction coupling Guo & Campbell, . In mice, it has been reported that altered binding properties of RYR channels and a triadin isoform Trisk reduce sarcoplasmic reticulum calcium release, indicating that triadin is crucial for RYR function Goonasekera et al., . Moreover, decreased calcium release from the sarcoplasmic reticulum is associated with overexpression of TRDN, indicating that triadin negatively regulates RYR opening Fodor et al., . In contrast, triadin knock‐out mice survived to adulthood, indicating that excitation‐contraction coupling does not require this protein.
Although effects of this gene on pork quality are not well documented, low‐ marbled steers exhibit higher expression of TRDN than high‐marbled steers
Sasaki et al., .
19
3. Materials and Methods
3.1. Animals
Seventy‐two pigs from the Granja de Melhoramento de Suínos Pig Breeding Farm of Universidade Federal de Viçosa Federal University of Viçosa, Viçosa, Minas Gerais, Brazil were used in this trial. These animals consisted of three genetic groups: the Brazilian naturalized breed Piau, the Commercial Line Landrace x Large White x Pietrain; Com and a Crossbred group produced from Piau males and Commercial Line females; CrB . For each genetic group, animals boars and gilts were slaughtered by electrical stunning at four slaughter weights: , , and Kg. Therefore, for each combination of genetic group and slaughter weight, six animals three males and three females were harvested Table . . . For Piau pigs at and kg of slaughter weight, four boars and two gilts were used. The pigs were fed with a recommended diet ad libitum twice daily with free access to water.
Table . . – Number of replicates of each source of variation
Piau Crossbred Crb Commercial Com
Slaughter weight Kg
B G B G B G
Total
Total
B, boars; G, gilts
3.2. Sampling
After slaughter, samples from muscle longissimus dorsi were collected at the P site between the th and th rib for intramuscular fat IMF measurement and RNA extraction. Samples used for IMF measurements were taken with approximately g, fat trimmed, identified, wrapped in aluminum foil, stored in plastic bags and kept frozen at ‐ oC until analysis.
20
materials used were sprayed with RNase Exterminator BioAgency . Afterwards, samples were kept at ‐ oC until RNA extraction.
In order to correct the data, slaughter age in days from each animal was recorded to be tested as a covariate.
3.3. Intramuscular fat content measurement
Samples were thawed overnight oC then processed using a tissue homogenizer Homogeneizador de Tecidos Tipo Turrax CT‐ , CIENTEC . Fat content was determined by the ether extract method AOAC, and expressed as a percentage of IMF in fresh meat.
3.4. Total RNA extraction and first strand cDNA synthesis
Frozen samples were thawed at oC one hour before total RNA extraction. Afterwards, samples were disrupted using TissueRuptor QIAGEN and total RNA was isolated from skeletal muscle tissue with RNeasy® Mini Kit QIAGEN . As indicated for fibrous tissues, a Proteinase K Fungal – Invitrogen step was added in the protocol, to enhance cell lyses. On column DNase digestion was performed using RNase‐Free DNase Set QIAGEN . Total RNA concentration was estimated by NanoDrop ND‐ Thermo Fisher Scientific Inc. spectrophotometer and quality analyzed by . % agarose gel electrophoresis. RNA samples were kept at ‐ oC until being used for reverse transcriptase reactions.
First‐strand cDNA synthesis was performed using SuperScriptTM III First‐ Strand kit invitrogenTM and its concentration was estimated through spectrophotometry. Afterwards, cDNA samples were kept at ‐ oC until real‐time PCR reactions.
3.5. Primers design for Realtime PCR
21
Piau/Large White Expressed Sequence Tags Library developed at Universidade
Federal de Viçosa Peixoto, .
3.6. Realtime PCR reactions
All reactions were performed in an SDS ABI PRISM thermocycler Applied Biosystems . The relative quantification method and the SYBR® Green detection system were used. Before expression profile analysis, each gene had its efficiency calculated Livak & Schmittgen, using different serial concentrations of primers , and nM and cDNA , , and ng . A cDNA pool of twelve animals, one from each treatment genetic group x slaughter weight interaction , was used for the efficiency calculation.
Each reaction consisted of . µL of Power SYBR® GREEN PCR Master Mix Applied Biosystem , . µL of each primer forward and reverse , µL of cDNA and nuclease‐free water to complete µL, and was performed following this program: oC for min, cycles of oC for sec and oC for . After cycles, all
samples were submitted to a dissociation curve analysis for validation of non‐ specific products; for that, samples were heated oC per sec, from oC until
oC. Each reaction was performed in replicate. Data from relative quantification
was transformed using the ‐ ∆Ct method, according to Livak & Schmittgen .
22
Table . . – Primers designed from GenBank sequences, based on Sasaki et al findings for bovines
Gene name Gene symbol Primer sequence ’‐ ’ Tm oC NCBI access code Species
F–TAAACCGGGAAGCTTGCGATGACT .
Matrix Gla protein MGP
R–GCGCTGCCGGAAATAACGATTGTA . AF Sus scrofa
F–TCTGCTTGGAGAAGAAGTTGCCCA .
Pyruvate dehydrogenase lipoamide beta PDHB
R–CAGCAATTCCAGCAAAGCCCATCT . NM_ Homo sapiens
F–GGCGATTGTTTCCGCAAGCAGTAT .
Ryanodine receptor skeletal * RYR
R–TTTCTCCACTGCATGGTCACCTCT . NM_ Sus scrofa
F–GTCAGCTGTGGCCGTTGTTATGTT .
Triadin TRDN
R–AAAGAAGCCATAGACCCAGTCCGT . NM_ Homo sapiens
F–GAAGCATGTGGGCAACCAGCAATA .
Beta‐actin ACTB
R–CCAATTTCACGGCCCAGAACGTAA . AY Sus scrofa
‐Endogenous control; * RYR was not analyzed by Sasaki et al., , but it was included in the present work due to its relevance in pork production.
23
Table . . – Primers designed from a Piau/Large White Expressed Sequence Tags Library developed at Universidade Federal de Viçosa
Gene name Gene symbol Primer sequence ’‐ ’ Tm oC
F–TAAACCGGGAAGCTTGCGATGACT .
Atrophin ATN
R–GCGCTGCCGGAAATAACGATTGTA .
F–TCTGCTTGGAGAAGAAGTTGCCCA .
Eukaryotic translation elongation factor alpha EEF A
R–CAGCAATTCCAGCAAAGCCCATCT .
F–GGCGATTGTTTCCGCAAGCAGTAT .
Fatty acid binding protein , muscle and heart FABP
R–TTTCTCCACTGCATGGTCACCTCT .
F–GTCAGCTGTGGCCGTTGTTATGTT .
Low density lipoprotein receptor LDLR
R–AAAGAAGCCATAGACCCAGTCCGT .
F–GAAGCATGTGGGCAACCAGCAATA .
Obscurin, cytoskeletal calmodulin and titin‐interacting RhoGEF OBSCN
R–CCAATTTCACGGCCCAGAACGTAA .
24
3.7. Statistical analysis
All statistical procedures were performed using SAS . for Windows Statistical Analysis System Institute, Inc., Cary, NC, USA .
3.7.1. Normality test
The UNIVARIATE procedure was used to verify normal distribution of IMF expressed as percentage , slaughter age A; expressed as days and expression of each gene expressed as ‐ ∆Ct . Although IMF and SA showed a normal distribution, none of the expression of studied genes showed a normal distribution. Therefore, the gene expression data was transformed using ln x+ as proposed by Vogel et al., and normal distribution was verified. The transformed gene expression for each gene is called EXPGENE expressed as arbitrary units; a.u. , where GENE is the gene symbol.
3.7.2. Analysis of covariance (ANCOVA)
In order to check the influence of the quantitative variable slaughter age A on IMF and transformed gene expressions EXPGENE , an analysis of covariance ANCOVA was performed. The ANCOVA is a method by which the influence of the covariates on the treatment means is reduced Ott & Longnecker, . Moreover, a covariate must be correlated to the dependent variable and cannot be influenced by independent variables. Therefore, the covariate slaughter age was tested within genetic group x slaughter weight interaction.
The ANCOVA was performed using the GLM procedure, according to the following statistical model:
Where:
25
weight regression coefficient associated to the covariate A; is the slaughter age of the lth observation at the ith level of genetic group and the jth level of slaughter weight, l= to ; is the average slaughter age; and is the random error.
Using a significance level of %, the covariate slaughter age A had no effect on IMF and EXPGENE. Therefore, slaughter age was removed from the model.
3.7.3. Analysis of variance (ANOVA) and multiple comparison test
Using a significance level of %, the ANOVA was performed using the GLM procedure, according to the following statistical model:
Where:
is the observed trait; is the general constant; is the ith level of genetic group, i= , or Piau, CrB or Com ; is the jth level of slaughter weight, j= , , or , , or Kg ; is the kth level of sex, k= or male or female ; is the interaction of the ith level of genetic group and the jth level of slaughter weight; and is the random error.
Genetic group and sex‐adjusted means were obtained by LSMEANS statement and adjusted Tukey‐Kramer multiple comparison tests were performed at a % level of significance. When the slaughter weight effect was significant, regression equations were adjusted.
3.7.4. Correlations
Using the option PREDICTED of the OUTPUT statement from GLM procedure, predicted values of IMF and EXPGENE were obtained and the Pearson’s product‐moment correlation coefficient and the partial correlation between these two traits were calculated. These values were analyzed using two sets of data: the whole population and Piau pigs only. A % level of significance was used in these analyses.
26
3.7.5. Prediction equation for IMF
In order to adjust a multiple regression equation of intramuscular fat content with all genes, using predicted values, the STEPWISE method of the SELECTION option at the MODEL statement from the REG procedure was used. In the stepwise method, variables are added one by one to the model, and the statistic for a variable to be added must be significant. After a variable is added, the stepwise method looks at all the variables already included in the model and deletes any variable that does not produce a significant statistic. This process ends when none of the variables outside the model have a significant
statistic and every variable in the model is significant. The default significance level of % was used Copyright c , SAS Institute Inc., Cary, NC, USA. All Rights Reserved. Reproduced with permission of SAS Institute Inc., Cary, NC .
27
4. Results and Discussion
The average OD /OD ratio from the total RNA samples was . ± . . Presence of S and S bands indicates good RNA quality Figure . .
Figure . – Total RNA from five samples of longissimus dorsi muscle in a . % agarose gel stained with ethidium bromide.
The amplified efficiency of target and endogenous genes were similar. Concentration of primers and cDNA are displayed in Table . .
Table . – Concentration of primers, cDNA and reaction efficiency E for analyzed genes
Gene symbol Primer nM ng/reaction cDNA E %
ATN .
EEF A .
FABP .
LDLR .
MGP .
OBSCN .
PDHB .
RYR .
TRDN .
ACTB .
‐Endogenous control
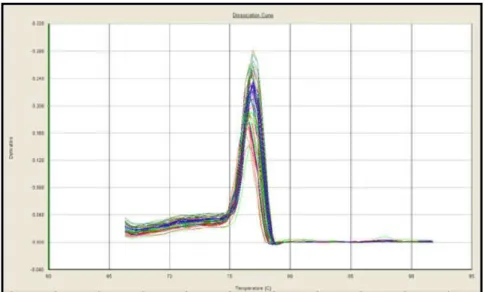
Dissociation curves were generated after amplification cycles and showed that only one fragment was amplified, lacking unspecified amplification and primer dimmers for all genes. Figure . illustrates dissociation curves from OBSCN gene.
28
Figure . – OBSCN gene dissociation curve.
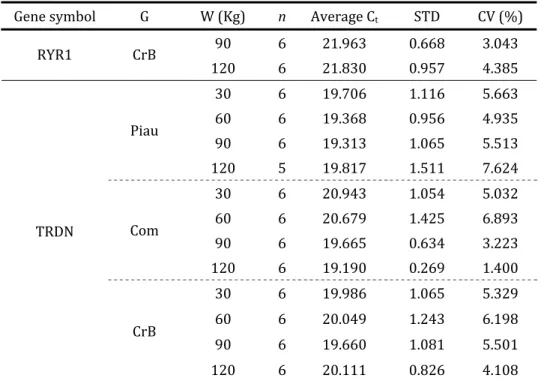
The coefficient of variation CV of Cycle Threshold Ct from replicates within each sample was low at less than %, indicating precision and reproducibility data not shown . However, for some genes, higher CV values of Ct for different slaughter weights W within genetic groups G were observed, indicating individual variation between animals Table . .
Table . – Number of animals n , Average Ct, Ct standard deviation STD and Ct coefficient of
variation CV for each target gene in different slaughter weights W within genetic groups G
Gene symbol G W Kg n Average Ct STD CV %
. . .
. . .
. . .
Piau
. . .
. . .
. . .
. . .
Com
. . .
. . .
. . .
. . .
ATN
CrB
. . .
. . .
. . .
. . .
EEF A Piau
29
Cont.
Gene symbol G W Kg n Average Ct STD CV %
. . . . . . . . . Com . . . . . . . . . . . .
EEF A
CrB . . . . . . . . . . . . Piau . . . . . . . . . . . . Com . . . . . . . . . . . . FABP CrB . . . . . . . . . . . . Piau . . . . . . . . . . . . Com . . . . . . . . . . . . LDLR CrB . . . . . . . . . . . . Piau . . .
Com . . .
. . .
MGP
. . .
30
Cont.
Gene symbol G W Kg n Average Ct STD CV %
Com . . .
31
Cont.
Gene symbol G W Kg n Average Ct STD CV %
. . .
RYR CrB
. . .
. . .
. . .
. . .
Piau
. . .
. . .
. . .
. . .
Com
. . .
. . .
. . .
. . .
TRDN
CrB
. . .
An overall Analysis of Variance ANOVA table is illustrated below Table . . Genetic group x slaughter weight interaction G*W was significant P< . for six traits, genetic group G for two traits, slaughter weight W for three traits and sex S was only significant for intramuscular fat content IMF .
Table . – Overall ANOVA for all studied traits, with genetic group x slaughter weight interaction G*W , genetic group G , slaughter weight W and sex S as sources of variation
Sources of variation Trait
G*W G W S
IMF ** N/A N/A *
EXPATN *
EXPEEF A **
EXPFABP **
EXPLDLR * N/A N/A
EXPMGP ** N/A N/A
EXPOBSCN ** N/A N/A
EXPPDHB ** **
EXPRYR ** N/A N/A
EXPTRDN * N/A N/A
IMF, intramuscular fat content; EXPGENE, expression of studied gene;
**, P< . ; *, P< . ; N/A, not applicable; Empty spaces, P> . .