BGD
11, 10203–10228, 2014
Seasonal variations in concentration and
composition of dissolved organic carbon in Tokyo Bay
A. Kubo et al.
Title Page
Abstract Introduction
Conclusions References
Tables Figures
◭ ◮
◭ ◮
Back Close
Full Screen / Esc
Printer-friendly Version
Interactive Discussion
Discussion
P
a
per
|
Discus
sion
P
a
per
|
Discussion
P
a
per
|
Discussion
P
a
per
Biogeosciences Discuss., 11, 10203–10228, 2014 www.biogeosciences-discuss.net/11/10203/2014/ doi:10.5194/bgd-11-10203-2014
© Author(s) 2014. CC Attribution 3.0 License.
This discussion paper is/has been under review for the journal Biogeosciences (BG). Please refer to the corresponding final paper in BG if available.
Seasonal variations in concentration and
composition of dissolved organic carbon
in Tokyo Bay
A. Kubo1, M. Yamamoto-Kawai2, and J. Kanda1
1
Department of Ocean Sciences, Tokyo University of Marine Science and Technology, Konan, Minato, Tokyo, Japan
2
Center for Advanced Science and Technology, Tokyo University of Marine Science and Technology, Konan, Minato, Tokyo, Japan
Received: 9 June 2014 – Accepted: 16 June 2014 – Published: 1 July 2014 Correspondence to: A. Kubo ([email protected])
BGD
11, 10203–10228, 2014
Seasonal variations in concentration and
composition of dissolved organic carbon in Tokyo Bay
A. Kubo et al.
Title Page
Abstract Introduction
Conclusions References
Tables Figures
◭ ◮
◭ ◮
Back Close
Full Screen / Esc
Printer-friendly Version
Interactive Discussion
Discussion
P
a
per
|
Discus
sion
P
a
per
|
Discussion
P
a
per
|
Discussion
P
a
per
|
Abstract
Concentrations of recalcitrant and bioavailable dissolved organic carbon (DOC) and their seasonal variations were investigated at three stations in Tokyo Bay, Japan, and in two freshwater sources flowing into the bay to evaluate the significance of DOC degradation for the carbon budget in coastal waters and carbon export to the open
5
ocean. Recalcitrant DOC (RDOC) was differentiated from bioavailable DOC (BDOC) as a remnant of DOC after 150 days of bottle incubation. On average, RDOC accounted for 78 % of the total DOC in Shibaura sewage treatment plant (STP) effluent, 67 % in the upper Arakawa River water, 66 % in the lower Arakawa River water, and 78 % in surface bay water. RDOC concentrations were higher than BDOC at all stations. In freshwater
10
environments, RDOC concentrations were almost constant throughout the year. In the bay, RDOC was higher during spring and summer than during autumn and winter. The relative abundance of RDOC in the bay derived from phytoplankton, terrestrial, and open oceanic waters was estimated to be 9 %, 33 %, and 58 %, respectively, by multiple regression analysis of RDOC, salinity, and chla. In addition, comparison with previous
15
data from 1972 revealed that concentrations of RDOC and BDOC have decreased by 33 % and 74 % at freshwater sites and 39 % and 76 % at Tokyo Bay, while the ratio of RDOC to DOC has increased. The change in DOC concentration and composition was probably due to increased amounts of sewage treatment plant effluent entering the system. Tokyo Bay exported DOC, mostly RDOC, to the open ocean because of
20
remineralization of BDOC.
1 Introduction
Dissolved organic carbon (DOC) is the largest organic carbon reservoir in the ocean. The DOC pool in the ocean contains 662 Pg of carbon, which is roughly equivalent to that stored in the atmosphere in the form of carbon dioxide (Hansell et al., 2009).
25
BGD
11, 10203–10228, 2014
Seasonal variations in concentration and
composition of dissolved organic carbon in Tokyo Bay
A. Kubo et al.
Title Page
Abstract Introduction
Conclusions References
Tables Figures
◭ ◮
◭ ◮
Back Close
Full Screen / Esc
Printer-friendly Version
Interactive Discussion
Discussion
P
a
per
|
Discus
sion
P
a
per
|
Discussion
P
a
per
|
Discussion
P
a
per
Carlson, 2002). Conversely, DOC in coastal waters consists of a diverse mixture of car-bon formed by primary production and of terrestrial origin. Riverine DOC export to the open ocean has been estimated to range from 0.21 to 0.25 Pg C yr−1(Meybeck, 1993;
Ludwig et al., 1996; Hedges et al., 1997; Cauwet, 2002). Coastal waters are typically considered passive conduits in regional and global carbon budgets (Cole et al., 2007;
5
Aufdenkampe et al., 2011; Regnier et al., 2013), and most studies have attempted to estimate DOC flux from land to the open ocean without considering loss or gain of DOC in coastal waters. However, degradation of terrestrial DOC and biological production of DOC in coastal regions can significantly modify the flux of DOC to the open ocean. Re-cently, Dai et al. (2012) reported that riverine DOC export to the open ocean would be
10
reduced to 0.17 Pg C yr−1 if 10 % was degraded in coastal waters. However, their
as-sumption of 10 % was based on the results of only a few bottle incubation experiments (Amon and Benner, 1996; Raymond and Bauer, 2000; Moran et al., 1999). Therefore, to better understand DOC export to the open ocean, experimental data describing DOC composition, preferably from different environmental locations and in different seasons,
15
are needed.
In this study, we observed seasonal variations in the concentration and composition of DOC in Tokyo Bay, Japan. The bay is semi-enclosed, with an area of about 922 km2 and a mean water depth of 19 m. The residence time of water in the bay is estimated to be about 50 days (Takada et al., 1992). The bay is located in central Japan and
20
surrounded by metropolitan areas, with a total human population of about 26 million. Tokyo Bay represents typical highly urbanized coastal waters, which are rapidly ex-panding worldwide (Nellemann et al., 2008). We also compared our results with those obtained by Ogura (1975), who carried out an investigation of Tokyo Bay in the 1970s and found that DOC in coastal waters could be divided into bioavailable DOC (BDOC)
25
BGD
11, 10203–10228, 2014
Seasonal variations in concentration and
composition of dissolved organic carbon in Tokyo Bay
A. Kubo et al.
Title Page
Abstract Introduction
Conclusions References
Tables Figures
◭ ◮
◭ ◮
Back Close
Full Screen / Esc
Printer-friendly Version
Interactive Discussion
Discussion
P
a
per
|
Discus
sion
P
a
per
|
Discussion
P
a
per
|
Discussion
P
a
per
|
2 Materials and methods
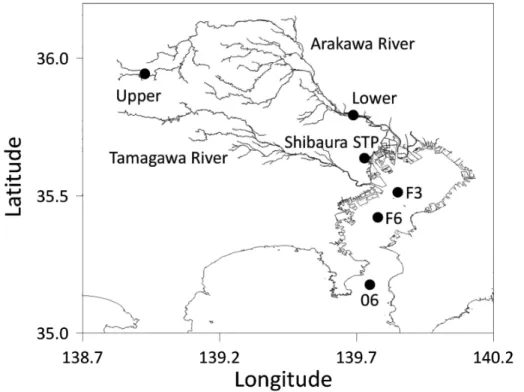
Freshwater samples were collected two and eight times from the upper and lower Arakawa River, respectively, and five times from effluent of Shibaura sewage treat-ment plant (STP; Fig. 1) between December 2011 and October 2013. Water samples were collected using a bucket, transferred into HCl acid-washed 1 L polyethylene
bot-5
tles and kept in the dark until being processed in the laboratory. The bucket and sample bottles were rinsed three times with sample water before being filled. Surface seawater of Tokyo Bay was collected in 8 L Niskin bottles mounted on a CTD rosette on the R/V Seiyo-maru of Tokyo University of Marine Science and Technology from January 2012 to December 2012 monthly at three stations (Fig. 1). Both freshwater and seawater
10
samples were filtered through GF/F filters that had been precombusted at 450◦C for
3 h, then transferred to 500 mL amber glass bottles and stored at room temperature (20◦C) in total darkness until analysis. The degradation experiments were conducted
based on a total of seven incubations (0, 5, 10, 20, 50, 100, and 150 days) per each field sampling event. After incubation, samples were dispensed into glass vials that
15
had been pre-washed with HCl. Freshwater samples were preserved with 6 mol L−1
HCl at a concentration corresponding to 1 % of the volume, then stored in a refrigera-tor (5◦C). Tokyo Bay samples were frozen (
−25◦C) without adding HCl. DOC samples
were measured at least in triplicate with a TOC analyzer (TOC-VCSH, Shimadzu, Kyoto, Japan).
20
RDOC is defined as the concentration of DOC remaining at 150 days and BDOC is obtained by subtracting the RDOC from the initial DOC (Lønborg et al., 2009). The degradation rate of DOC is described by a first-order exponential decay model taking a RDOC pool into account:
DOC(t)=BDOC·exp(−k·t)+RDOC (1)
25
where DOC(t) is the amount of DOC remaining at time t (day), k is the degradation rate constant (day−1), and BDOC and RDOC are the concentrations of BDOC and
BGD
11, 10203–10228, 2014
Seasonal variations in concentration and
composition of dissolved organic carbon in Tokyo Bay
A. Kubo et al.
Title Page
Abstract Introduction
Conclusions References
Tables Figures
◭ ◮
◭ ◮
Back Close
Full Screen / Esc
Printer-friendly Version
Interactive Discussion
Discussion
P
a
per
|
Discus
sion
P
a
per
|
Discussion
P
a
per
|
Discussion
P
a
per
RDOC (µmol L−1). Using BDOC and RDOC concentrations obtained from 150 days of
incubation,kcan be estimated by fitting the observed DOC(t) values to the exponential model using Matlab 2012a. For comparison with the results reported by Lønborg and Álvarez-Salgado (2012), we used the following equation to normalize the degradation rate to the rate at 15◦C,
5
k(15◦C)=k(T) ·(Q10)
T−15
10 (2)
wherek(15◦C) and k(T) are the degradation rate constants at 15◦C andT◦C (20◦C
for our experiment).Q10 is the temperature coefficient. In this study, we used a value
of 2.2 based on Lønborg and Álvarez-Salgado (2012).
Temperature and salinity were measured in the field using a YSI EC 300
10
(YSI/Nanotech Inc., Yellow Springs, OH, USA) at freshwater sites and using a CTD (Falmouth Scientific Inc., Bourne, MA, USA) for sites in the bay. Water samples for chlorophyll a (chl a) measurement were filtered through precombusted (450◦C, 3 h)
Whatmann GF/F filters. After filtration, chlorophyllous pigments were extracted using N,N-dimethylformamide (DMF), and concentrations of chl a were determined by the
15
fluorometric method (Suzuki and Ishimaru, 1990) using a fluorometer (TD-700, Turner Designs, Sunnyvale, CA, USA). Samples for particulate organic carbon (POC) were filtered through precombusted (450◦C, 3 h) Whatmann GF/F filters, after which the
fil-ters were stored at−80◦C until analysis. The samples for POC analyses were dried at
60◦C and acidified with vapor at 12 mol L−1HCl to remove carbonate before analysis.
20
BGD
11, 10203–10228, 2014
Seasonal variations in concentration and
composition of dissolved organic carbon in Tokyo Bay
A. Kubo et al.
Title Page
Abstract Introduction
Conclusions References
Tables Figures
◭ ◮
◭ ◮
Back Close
Full Screen / Esc
Printer-friendly Version
Interactive Discussion
Discussion
P
a
per
|
Discus
sion
P
a
per
|
Discussion
P
a
per
|
Discussion
P
a
per
|
3 Results and discussion
3.1 Composition and sources of freshwater DOC flowing into Tokyo Bay
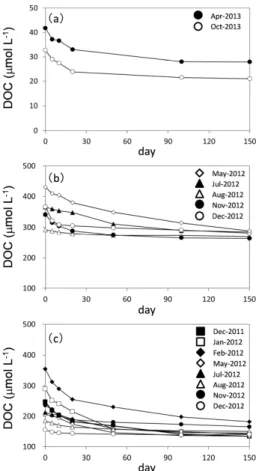
The lowest chla, DOC, and POC were observed at the upper Arakawa River station, which is considered to be pristine (Table 1). The average concentration of DOC was 38 µmol L−1 at the upper Arakawa River station. The results of the DOC degradation
5
experiments at the upper Arakawa River station are shown in Fig. 2a. Rapid degrada-tion of the labile pool was observed within the first 20 days of incubadegrada-tion. Addidegrada-tionally, the mean concentration of RDOC was 25 µmol L−1, and its mean contribution to total
DOC was 67 %. At the upper Arakawa River station, the concentrations of DOC and RDOC were very low.
10
At Shibaura STP, relatively high temperatures and DOC values were observed, while seasonal variations in chl a and POC were relatively small (Table 1). The av-erage concentration of DOC was 359 µmol L−1, which was about nine times higher
than the value at the upper Arakawa River station. The annual mean concentration of RDOC was 278 µmol L−1, while the mean contribution of RDOC to total DOC was 78 %
15
(Fig. 2b). The RDOC concentrations did not vary greatly between observation months, and a good linear relationship between BDOC and DOC was observed (R2=0.976,
p <0.001, slope=1.16), indicating that the seasonal variation of DOC was mostly due to variations in the bioavailable fraction. Typically, STP effluents have high organic car-bon concentrations and a large bioavailable fraction (Servais et al., 1995; Servais et al.,
20
1999; Kaushal and Belt, 2012). In contrast, effluent of Shibaura STP showed a high pro-portion of RDOC (67–93 %). These findings suggest that most of the BDOC were de-graded before being discharged, probably because STPs in Japan conduct secondary treatment.
A relatively high chla and POC were observed at the lower Arakawa River station
25
(Table 1). The maximum concentrations of chl a, DOC, and POC were observed in spring. The average concentration of DOC was 235 µmol L−1, while the annual mean
concentration of RDOC was 149 µmol L−1 and the mean contribution of RDOC to
BGD
11, 10203–10228, 2014
Seasonal variations in concentration and
composition of dissolved organic carbon in Tokyo Bay
A. Kubo et al.
Title Page
Abstract Introduction
Conclusions References
Tables Figures
◭ ◮
◭ ◮
Back Close
Full Screen / Esc
Printer-friendly Version
Interactive Discussion
Discussion
P
a
per
|
Discus
sion
P
a
per
|
Discussion
P
a
per
|
Discussion
P
a
per
tal DOC was 66 % (Fig. 2c). The concentrations of DOC were more than six times those at the upper Arakawa River station, probably because of inputs of DOC from STPs between observation sites. The RDOC concentrations did not show large dif-ferences between observation months, and a good linear relationship between BDOC and DOC was observed (R2=0.942,p <0.001, slope=1.12), indicating that the
sea-5
sonal variations of DOC at the lower Arakawa River station were due to variations in the bioavailable fraction.
Freshwater flowing into Tokyo Bay primarily consists of a mixture of river water and STP effluent. The total discharge ratio of river water to STP effluent in the bay is about 1:1 (Japan Sewage Works Association, 2010; Bureau of Sewerage, 2013). Assuming
10
that the ratio of river water to STP effluent is 1 : 1 and that data collected at the upper Arakawa River station and Shibaura STP represent these two sources, the average concentrations of RDOC and BDOC in freshwater would be 152 and 47 µmol L−1,
re-spectively. These values are comparable with those observed at the lower Arakawa River station (149, 86 µmol L−1, respectively). Arakawa River, which is the largest river
15
flowing into the bay, accounts for about 30 % of the freshwater discharge (Nihei et al., 2007a). Most rivers flowing into the bay have similar water quality because of similar land use of the drainage basin (Nihei et al., 2007b); accordingly, we can reasonably assume that observed RDOC and BDOC concentrations at the lower Arakawa River station represent concentrations of total river water flowing into Tokyo Bay.
20
Table 2 summarizes the first-order decay constants obtained by fitting the exponen-tial degradation of DOC with time. The annual average degradation constant normal-ized to 15◦C at the lower Arakawa River station was 0.031, which was lower than that
observed in other coastal waters (0.066; Lønborg and Álvarez-Salgado, 2012). These findings indicate that freshwater DOC flowing into Tokyo Bay is more recalcitrant than
25
in other coastal systems.
In 1972, the average concentrations of DOC and RDOC were 561 and 224 (40 % of the total DOC) µmol L−1 in the freshwater environment of the lower Tamagawa River,
con-BGD
11, 10203–10228, 2014
Seasonal variations in concentration and
composition of dissolved organic carbon in Tokyo Bay
A. Kubo et al.
Title Page
Abstract Introduction
Conclusions References
Tables Figures
◭ ◮
◭ ◮
Back Close
Full Screen / Esc
Printer-friendly Version
Interactive Discussion
Discussion
P
a
per
|
Discus
sion
P
a
per
|
Discussion
P
a
per
|
Discussion
P
a
per
|
centrations at the lower Arakawa River station are lower than those reported by Ogura (1975). During our calculations, we took into account the fact that the amount of fresh-water discharge into the bay has increased by 24 % (Okada et al., 2007), the amount of RDOC and BDOC flowing into the bay would have decreased by 17 % and 68 %, respectively. Ogura (1975) also estimated a degradation constant of 0.087, which is
5
much higher than that observed in the present study (Table 2). The proportion of treated wastewater to the total freshwater inflow to the bay increased from 11 % to 28 % from 1970 to 2000 (National Institute for Land and Infrastructure Management, 2004). Overall, these results indicate that the quantity of DOC flowing into the bay has decreased, and the quality of DOC has become more recalcitrant because of an
10
increase of sewage treatment plant effluent.
3.2 Tokyo Bay
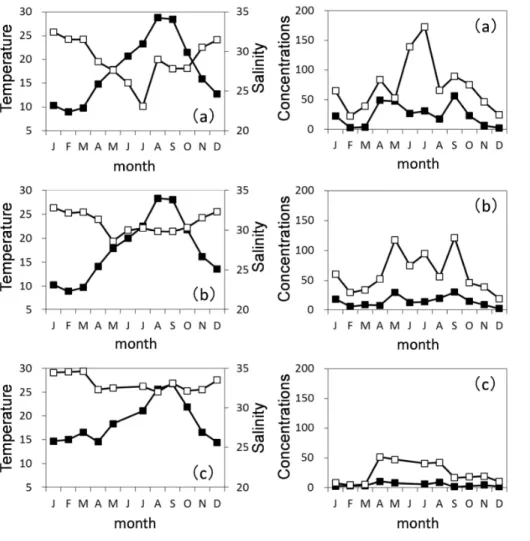
The seasonal variations of temperature, salinity, chla, and POC at the three stations in Tokyo Bay are presented in Fig. 3. High temperature, chla, and POC were observed during spring and summer, while low values were observed during autumn and winter.
15
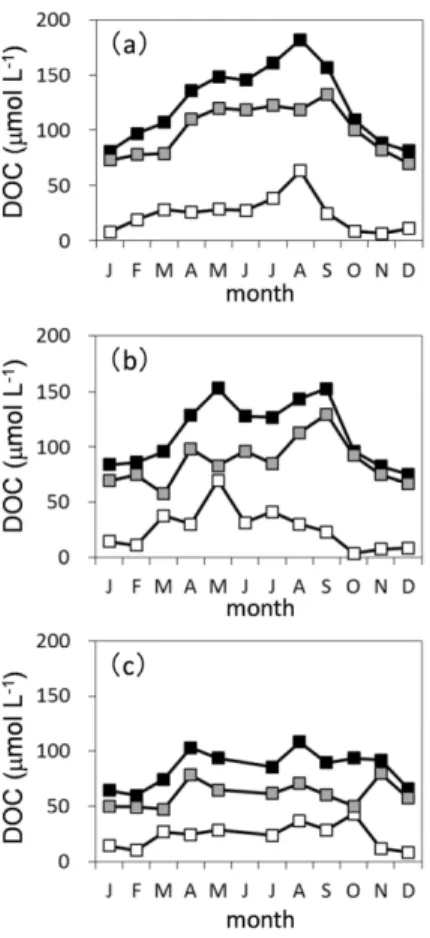
Salinity was higher during autumn and winter than spring and summer. Salinity showed the opposite seasonal pattern of temperature, chl a, and POC. DOC concentrations ranged from 81 to 182, 76 to 153, and 60 to 108 µmol L−1 at stations F3, F6, and 06
stations, respectively (Fig. 4), with higher values being observed in spring and summer. DOC occurred in the order of F3>F6>06. The concentrations of DOC at station F3
20
decreased from 287 µmol L−1 in 1972 (Ogura, 1975) to 124 µmol L−1 in 2012, most
likely because of a decrease of DOC discharge from rivers and a decrease in primary production in the bay (Yamaguchi and Shibata, 1979; Yamaguchi et al., 1991; Bouman et al., 2010).
BGD
11, 10203–10228, 2014
Seasonal variations in concentration and
composition of dissolved organic carbon in Tokyo Bay
A. Kubo et al.
Title Page
Abstract Introduction
Conclusions References
Tables Figures
◭ ◮
◭ ◮
Back Close
Full Screen / Esc
Printer-friendly Version
Interactive Discussion
Discussion
P
a
per
|
Discus
sion
P
a
per
|
Discussion
P
a
per
|
Discussion
P
a
per
3.2.1 Composition of DOC
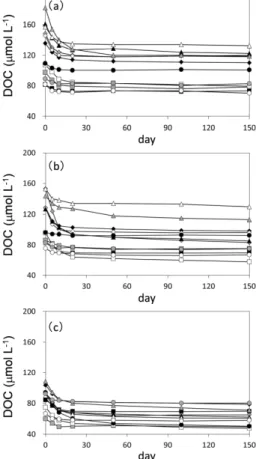
The results of DOC degradation experiments at Tokyo Bay are shown in Fig. 4. Rapid degradation of the labile pool occurred within the first 20 days of incubation, indicat-ing that BDOC were remineralized durindicat-ing the residence time of the bay water. The seasonal variations in DOC, RDOC, and BDOC concentrations at the three stations in
5
Tokyo Bay are shown in Fig. 5. RDOC ranged between 70 and 120 µmol L−1at F3, 58
and 130 µmol L−1 at F6 and between 48 and 80 µmol L−1 at 06. The mean
contribu-tions of RDOC to DOC were 81 % at F3, 77 % at F6 and 72 % at 06. Both RDOC and BDOC showed similar seasonal variation to DOC, with high variations being observed in spring and summer and low in autumn and winter. The contribution of RDOC to DOC
10
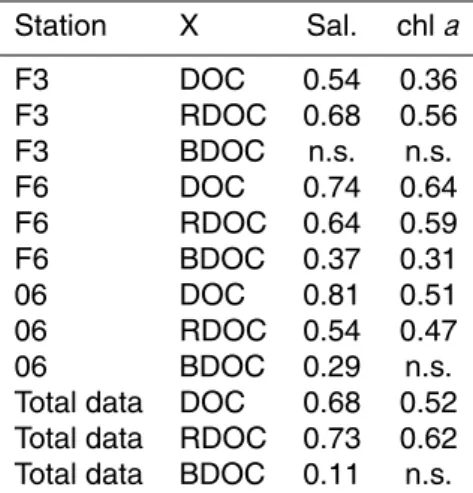
was higher than that of BDOC at all stations for the entire observation period. RDOC in Tokyo Bay was negatively correlated with salinity and positively correlated with chla
(Table 3).
When the seasonal change of RDOC is due to fluctuations in allochthonous input, a significant negative relationship between RDOC and salinity would be expected.
Al-15
ternatively, when RDOC is produced directly by phytoplankton, a positive relationship between RDOC and chlais expected (Kragh and Søndergaard, 2009). However, pre-vious studies in coastal areas revealed no significant correlations between RDOC and salinity or chla(Lønborg and Søndergaard, 2009; Lønborg et al., 2009; Lønborg et al., 2010). RDOC in Tokyo Bay was well correlated with salinity and chla, indicating that
20
allochthonous input and phytoplankton are major sources of RDOC in the bay.
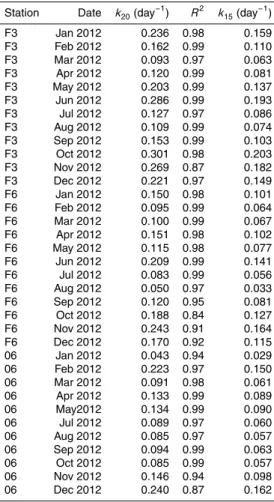
Table 4 summarizes the degradation constants of DOC for the surface bay waters. The annual average degradation constants normalized to 15◦C at F3, F6, and 06 were
0.128, 0.094, and 0.083, respectively. Most values of degradation constants for the bay water were higher than those of freshwater (Tables 2 and 4). The half-lives of
25
BGD
11, 10203–10228, 2014
Seasonal variations in concentration and
composition of dissolved organic carbon in Tokyo Bay
A. Kubo et al.
Title Page
Abstract Introduction
Conclusions References
Tables Figures
◭ ◮
◭ ◮
Back Close
Full Screen / Esc
Printer-friendly Version
Interactive Discussion
Discussion
P
a
per
|
Discus
sion
P
a
per
|
Discussion
P
a
per
|
Discussion
P
a
per
|
the half-lives of BDOC were about five times faster than the residence time of the bay water. The degradation constants were higher than those observed in other coastal waters (0.066; Lønborg and Álvarez-Salgado, 2012).
3.2.2 RDOC sources
To estimate the sources of RDOC in Tokyo Bay, multiple linear regression analysis with
5
salinity and chla as independent variables was applied to all RDOC data observed at three stations in Tokyo Bay using the method described by Ogawa and Ogura (1990), which gave the following multiple regression equation:
[RDOC (µmol L−1)]=259
−5.96×[Sal]+0.597×[Chla(µg L−1)] (3)
r2=0.79, P <0.001, n=35
10
where [RDOC] is the RDOC concentration, [Sal] is salinity, and [Chl a] is the chl a
concentration of each sample. Based on the results of multiple regression analysis, we estimated the contributions of RDOC from different sources (RDOC from phytoplank-ton, RDOC from the open ocean, and terrestrial RDOC).
15
The equation describing RDOC derived from phytoplankton [RDOCphyto] is as
fol-lows:
[RDOCphyto]=0.597×[Chla] (4)
The concentrations of RDOC in the open ocean [RDOCocean] can be estimated by
assuming that chlain the open ocean is 0 µg L−1using the following equation:
20
[RDOCocean]=259−5.96×
Salocean
(5) where [Salocean] is the salinity of the open ocean water flowing into the bay. When
[Salocean]=35.0 (Ogawa and Ogura, 1990),
[RDOCocean]=50.4 (µmol L−1) (6)
BGD
11, 10203–10228, 2014
Seasonal variations in concentration and
composition of dissolved organic carbon in Tokyo Bay
A. Kubo et al.
Title Page
Abstract Introduction
Conclusions References
Tables Figures
◭ ◮
◭ ◮
Back Close
Full Screen / Esc
Printer-friendly Version
Interactive Discussion
Discussion
P
a
per
|
Discus
sion
P
a
per
|
Discussion
P
a
per
|
Discussion
P
a
per
Here, concentrations of RDOC in the bay that originated from the open ocean [RDOCocean origin] can be estimated from:
RDOCocean origin
=50.4×[Sal]/35 (7)
The concentration of RDOC derived from terrestrial origin [RDOCterr] is estimated as:
RDOCterr
=(259−5.96×[Sal])−50.4×[Sal]/35 (8)
5
The [RDOCocean] of 50.4 (standard error=73) µmol L− 1
was comparable to the an-nual average RDOC concentration of the bottom water at 06 (see Table S1 in the auxiliary material). The terrestrial end-member of RDOC was 259 (standard er-ror=39) µmol L−1. The annual mean concentration of RDOC at the lower Arakawa
River station (149 µmol L−1) was within three times the standard error of the
terres-10
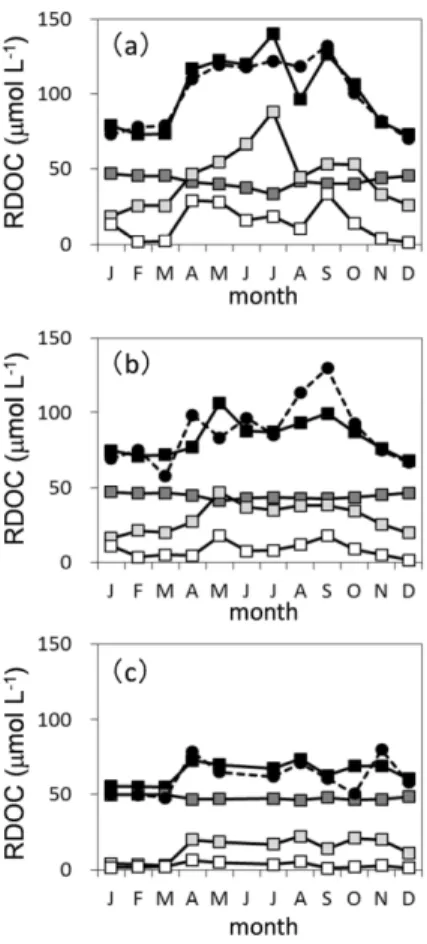
trial end-member (99 % confidence interval). The seasonal variations in RDOC derived from phytoplankton, terrestrial, and open oceanic waters at the three stations are pre-sented in Fig. 6. The results show that [RDOCocean origin] is the major source of RDOC in Tokyo Bay. At station F3, which is located close to land, [RDOCterr] was comparable to
[RDOCocean origin]. Both RDOCterrand RDOCphytowere found to be higher during spring
15
and summer than autumn and winter. The relative abundance of RDOC derived from phytoplankton, terrestrial, and open oceanic waters was estimated to be 9 %, 33 %, and 58 %, respectively. The concentration of terrestrial RDOC was higher than that of RDOC derived from phytoplankton at all stations throughout the year, even at the bay mouth. Accordingly, Tokyo Bay exported DOC, mostly terrestrial RDOC, to the open
20
ocean because of the high concentration of terrestrial RDOC and remineralization of BDOC.
3.2.3 Change of DOC in four decades
The concentrations of RDOC and BDOC observed in this study (100 µmol L−1 and
BGD
11, 10203–10228, 2014
Seasonal variations in concentration and
composition of dissolved organic carbon in Tokyo Bay
A. Kubo et al.
Title Page
Abstract Introduction
Conclusions References
Tables Figures
◭ ◮
◭ ◮
Back Close
Full Screen / Esc
Printer-friendly Version
Interactive Discussion
Discussion
P
a
per
|
Discus
sion
P
a
per
|
Discussion
P
a
per
|
Discussion
P
a
per
|
(165 µmol L−1and 100 µmol L−1, respectively). The contribution of RDOC to total DOC
in this study (80.6 %) is higher than the value in 1972 (57.5 %; Ogura, 1975). The con-centrations of RDOC and BDOC in Tokyo Bay have decreased because of a decrease in DOC load from the land, especially for BDOC. As a result, the composition of DOC has become more recalcitrant. In addition, decreasing nutrient loads into the bay have
5
caused decreasing primary production in the bay (Yamaguchi and Shibata, 1979; Yam-aguchi et al., 1991; Bouman et al., 2010). Therefore, autochthonous DOC should also have decreased.
4 Summary
A rapid degradation of the labile pool was observed at freshwater sites and Tokyo Bay
10
within the first 20 days of incubation. BDOC are remineralized during the residence time of the bay water. The contribution of RDOC to DOC was higher than that of BDOC at all stations for the entire observation period, and accounted for 77 % of the total. In ad-dition, RDOC sources (RDOCphyto, RDOCocean origin, and RDOCterr) could be estimated
by multiple regression analysis between RDOC, salinity, and chla. The concentration
15
of terrestrial RDOC was higher than that of RDOC derived from phytoplankton at all stations throughout the year. Accordingly, Tokyo Bay exported DOC, mostly terrestrial RDOC, to the open ocean because of the high concentration of terrestrial RDOC and faster half-lives of BDOC relative to the residence time of the bay water. The concen-trations of RDOC and BDOC have decreased in the last 40 years at freshwater sites
20
and Tokyo Bay, during which time the composition of DOC has become more recal-citrant because of sewage improvement. Since organic carbon degradation occurs at STPs before being discharged, DOC flowing into the bay has decreased, especially the BDOC.
BGD
11, 10203–10228, 2014
Seasonal variations in concentration and
composition of dissolved organic carbon in Tokyo Bay
A. Kubo et al.
Title Page
Abstract Introduction
Conclusions References
Tables Figures
◭ ◮
◭ ◮
Back Close
Full Screen / Esc
Printer-friendly Version
Interactive Discussion
Discussion
P
a
per
|
Discus
sion
P
a
per
|
Discussion
P
a
per
|
Discussion
P
a
per
The Supplement related to this article is available online at doi:10.5194/bgd-11-10203-2014-supplement.
Acknowledgements. We thank Ms. Chinatsu Oouchida, as well as other scientists, officers and crewmembers on board the R/V Seiyo-maru, for their help in sampling. This work was supported by a Grant-in-Aid for Scientific Research (C) (24510009) from the Ministry of the
5
Education, Culture, Sports, Science and Technology, Japan, and by a Canon Foundation grant.
References
Amon, R. M. W. and Benner, R.: Photochemical and microbial consumption of dissolved organic carbon and dissolved oxygen in the Amazon River system, Geochim. Cosmochim. Ac., 60, 1783–1792, 1996.
10
Aufdenkampe, A. K., Mayorga, E., Raymond, P. A., Melack, J. M., Doney, S. C., Alin, S. R., Aalto, R. E., and Yoo, K.: Riverine coupling of biogeochemical cycles between land, oceans, and atmosphere, Front. Ecol. Emviron., 9, 53–60, 2011.
Bouman, H. A., Nakane, T., Oka, K., Nakata, K., Kurita, K., Sathyendranath, S., and Platt, T.: Environmental controls on phytoplankton production in coastal ecosystems: a case study
15
from Tokyo Bay, Estuar. Coast. Shelf S., 87, 63–72, 2010.
Bureau of Sewerage: Management plan 2013, Bureau of Sewerage, Tokyo Metropolitan Gov-ernment, 117 pp., 2013 (in Japanese).
Carlson, C. A.: Production and removal processes, in: Biogeochemistry of Marine Dissolved Organic Matter, edited by: Hansell, D. A. and Carlson, C. A., Academic Press, San Diego,
20
91–151, 2002.
Cauwet, G.: DOM in the coastal zone, in: Biogeochemistry of Marine Dissolved Organic Matter, edited by: Hansell, D. A.,and Carlson, C. A., Academic Press, San Diego, 579–609, 2002. Cole, J. J., Prairie, Y. T., Caraco, N. F., McDowell, W. H., Tranvik, L. J., Striegl, R. G.,
Duarte, C. M., Kortelainen, P., Downing, J. A., Middelburg, J. J., and Melack, J.: Plumbing the
25
global carbon cycle: integrating inland waters into the terrestrial carbon budget, Ecosystems, 10, 171–184, 2007.
BGD
11, 10203–10228, 2014
Seasonal variations in concentration and
composition of dissolved organic carbon in Tokyo Bay
A. Kubo et al.
Title Page
Abstract Introduction
Conclusions References
Tables Figures
◭ ◮
◭ ◮
Back Close
Full Screen / Esc
Printer-friendly Version
Interactive Discussion
Discussion
P
a
per
|
Discus
sion
P
a
per
|
Discussion
P
a
per
|
Discussion
P
a
per
|
Hansell, D. A., Carlson, C. A., Repeta, D. J., and Schlitzer, R.: Dissolved organic matter in the ocean: a controversy stimulates new insights, Oceanography, 22, 202–211, 2009.
Hedges, J., Keil., R. G., and Benner, R.: What happens to terrestrial organic matter in the ocean?, Org. Geochem., 27, 195–212, 1997.
Japan Sewage Works Association: Sewage statistics, 2010 (in Japanese).
5
Kaushal, S. S. and Belt, K. T.: The urban watershed continuum: evolving spatial and temporal dimensions, Urban Ecosys., 15, 409–435, 2012.
Kragh, T. and Søndergaard, M.: Production and decomposition of new DOC by marine plankton communities: carbohydrates, refractory components and nutrient limitation, Biogeochemistry, 96, 177–187, 2009.
10
Lønborg, C. and Álvarez-Salgado, X. A.: Recycling versus export of bioavailable dissolved or-ganic matter in the coastal ocean and efficiency of the continental shelf pump, Global Bio-geochem. Cy., 26, GB3018, doi:10.1029/2012GB004353, 2012.
Lønborg, C. and Søndergaard, M.: Microbial availability and degradation of dissolved organic carbon and nitrogen in two coastal areas, Estuar. Coast. Shelf S., 81, 513–520, 2009.
15
Lønborg, C., Davidson, K., Álvarez-Salgado, X. A., and Miller, A. E. J.: Bioavailability and bac-terial degradation rates of dissolved organic matter in a temperate coastal area during an annual cycle, Mar. Chem., 113, 219–226, 2009.
Lønborg, C., Álvarez-Salgado, X. A., Martíinez-García, S., Miller, A. E. J., and Teira, E.: Stoi-chiometry of dissolved organic matter and the kinetics of its microbial degradation in a coastal
20
upwelling system, Aquat. Microb. Ecol., 58, 117–126, 2010.
Ludwig, W., Probst, J. L., and Kempe, S.: Predicting the oceanic input of organic carbon by continental erosion, Global Biogeochem. Cy., 10, 23–41, 1996.
Meybeck, M.: C, N, P and S in rivers: from sources to global inputs, in: Interactions of C, N, P and S Biogeochemical Cycles and Global Change, edited by: Wollast, R., Mackenzie, F. T.,
25
and Chou, L., Springer-Verlag, Berlin, 163–193, 1993.
Moran, M. A., Sheldon Jr, W. M., and Sheldon, J. E.: Biodegradation of riverine dissolved or-ganic carbon in five estuaries of the southeastern United States, Estuaries, 22, 55–64, 1999. National Institute for Land and Infrastructure Management: Information of port environment,
available at: http://www.nilim.go.jp/ (last access: 25 June 2013).
30
Nellemann, C., Hain, S., and Alder, J.: Rapid response assessment in dead water: merging of climate change with pollution, over-harvest, and indestations in the world’s fishing grounds, United Nations Environment Programme, 61 pp., 2008.
BGD
11, 10203–10228, 2014
Seasonal variations in concentration and
composition of dissolved organic carbon in Tokyo Bay
A. Kubo et al.
Title Page
Abstract Introduction
Conclusions References
Tables Figures
◭ ◮
◭ ◮
Back Close
Full Screen / Esc
Printer-friendly Version
Interactive Discussion
Discussion
P
a
per
|
Discus
sion
P
a
per
|
Discussion
P
a
per
|
Discussion
P
a
per
Nihei, Y., Takamura, T., and Watanabe, N.: Issues on discharge monitoring in main influence rivers into Tokyo Bay, J. Jpn. Soc. Civil Eng., 54, 1226–1230, 2007a (in Japanese with En-glish abstract).
Nihei, Y., Ehara, K., Usuda, M., Sakai, A., and Shigeta, K.: Water quality and pollutant load in the Edo River, Ara River and Tama River, J. Jpn. Soc. Civil Eng., 54, 1221–1225, 2007b (in
5
Japanese with English abstract).
Ogawa, H. and Ogura, N.: Sources and behavior of organic carbon of seawater in Tokyo Bay, Geochemistry, 24, 27–41, 1990 (in Japanese with English abstract).
Ogura, N.: Further studies on decomposition of dissolved organic matter in coastal seawater, Mar. Biol., 31, 101–111, 1975.
10
Okada, T., Takao, T., Nakayama, K., and Furukawa, K.: Change in freshwater discharge and residence time of seawater in Tokyo Bay, J. Jpn. Soc. Civil Eng., 63, 67–72, 2007 (in Japanese with English abstract).
Raymond, P. A. and Bauer, R.: Bacterial consumption of DOC during transport through a tem-perate estuary, Aquat. Microb. Ecol., 22, 1–12, 2000.
15
Regnier, P., Friedlingstein, P., Ciais, P., Mackenzie, F. T., Gruber, N., Janssens, I. A., Laruelle, G. G., Lauerwald, R., Luyssaert, S., Andersson, A. J., Arndt, S., Arnosti, C., Borges, A. V., Dale, A. W., Gallego-Sala, A., Goddéris, Y., Goossens, N., Hartmann, J., Heinze, C., Ilyina, T., Joos, F., LaRowe, D. E., Leifeld, J., Meysman, F. J. R., Munhoven, G., Raymond, P. A., Spahni, R., Suntharalingam, P., and Thullner, M.: Anthropogenic
perturba-20
tion of the carbon fluxes from land to ocean, Nat. Geosci., 6, 597–607, 2013.
Servais, P., Barillier, A., and Garnier, J.: Determination of the biodegradable fraction of dissolved and particulate organic carbon in waters, Ann. Limnol., 31, 75–80, 1995.
Servais, P., Garnier, J., Demarteau, N., Brion, N., and Billen, G.: Supply of organic matter and bacteria to aquatic ecosystems through waste water effluents, Water Res., 33, 3521–3531,
25
1999.
Suzuki, R. and Ishimaru, T.: An improved method for the determination of phytoplankton chloro-phyll using N, N-Dimethylformamide, J. Oceanogr. Soc. Jpn., 46, 190–194, 1990.
Takada, H., Ishiwatari, R., and Ogura, N.: Distribution of linear alkylbenzenes (LABs) and linear alkylbenzene sulphonates (LAS) in Tokyo Bay sediments, Estuar. Coast. Shelf S., 35, 141–
30
156, 1992.
BGD
11, 10203–10228, 2014
Seasonal variations in concentration and
composition of dissolved organic carbon in Tokyo Bay
A. Kubo et al.
Title Page
Abstract Introduction
Conclusions References
Tables Figures
◭ ◮
◭ ◮
Back Close
Full Screen / Esc
Printer-friendly Version
Interactive Discussion
Discussion
P
a
per
|
Discus
sion
P
a
per
|
Discussion
P
a
per
|
Discussion
P
a
per
|
Yamaguchi, Y., Satoh, H., and Aruga, Y.: Seasonal changes of organic carbon and nitrogen production by phytoplankton in the estuary of river Tamagawa, Mar. Pollut. Bull., 23, 723– 725, 1991.
5
BGD
11, 10203–10228, 2014
Seasonal variations in concentration and
composition of dissolved organic carbon in Tokyo Bay
A. Kubo et al.
Title Page
Abstract Introduction
Conclusions References
Tables Figures
◭ ◮
◭ ◮
Back Close
Full Screen / Esc
Printer-friendly Version
Interactive Discussion
Discussion
P
a
per
|
Discus
sion
P
a
per
|
Discussion
P
a
per
|
Discussion
P
a
per
Table 1. Temperature (◦C), salinity, chl a (µg L−1) concentrations, DOC (µmol L−1)
concen-trations, and POC (µmol L−1) concentrations at the upper Arakawa River (upper AR), lower
Arakawa River (lower AR), and Shibaura STP stations.
BGD
11, 10203–10228, 2014
Seasonal variations in concentration and
composition of dissolved organic carbon in Tokyo Bay
A. Kubo et al.
Title Page
Abstract Introduction
Conclusions References
Tables Figures
◭ ◮
◭ ◮
Back Close
Full Screen / Esc
Printer-friendly Version
Interactive Discussion
Discussion
P
a
per
|
Discus
sion
P
a
per
|
Discussion
P
a
per
|
Discussion
P
a
per
|
Table 2.Degradation constants for DOC (k20) and normalized degradation constants at 15◦C
(k15) at the upper Arakawa River (upper AR), lower Arakawa River (lower AR), and Shibaura
STP stations.R2indicates coefficient of determination.
Station Date k20(day−1) R2 k
15(day− 1
) upper AR Apr 2013 0.072 0.99 0.049 upper AR Oct 2013 0.053 0.98 0.036 lower AR Dec 2011 0.038 0.97 0.025 lower AR Jan 2012 0.040 0.99 0.027 lower AR Feb 2012 0.038 0.96 0.026 lower AR May 2012 0.028 0.99 0.019 lower AR Jul 2012 0.025 0.99 0.017 lower AR Aug 2012 0.045 0.99 0.031 lower AR Nov 2012 0.052 0.97 0.035 lower AR Dec 2012 0.110 0.97 0.071 Shibaura STP May 2012 0.019 0.99 0.013 Shibaura STP Jul 2012 0.021 0.99 0.014 Shibaura STP Aug 2012 0.040 0.97 0.027 Shibaura STP Nov 2012 0.062 0.99 0.042 Shibaura STP Dec 2012 0.110 0.92 0.072
BGD
11, 10203–10228, 2014
Seasonal variations in concentration and
composition of dissolved organic carbon in Tokyo Bay
A. Kubo et al.
Title Page
Abstract Introduction
Conclusions References
Tables Figures
◭ ◮
◭ ◮
Back Close
Full Screen / Esc
Printer-friendly Version
Interactive Discussion
Discussion
P
a
per
|
Discus
sion
P
a
per
|
Discussion
P
a
per
|
Discussion
P
a
per
Table 3.Correlation coefficients (R2) of the significant (p <0.05) linear regressions between DOC and hydrological data in Tokyo Bay (F3, F6, 06, and total data). n.s. indicates not signifi-cant.
Station X Sal. chla
F3 DOC 0.54 0.36
F3 RDOC 0.68 0.56
F3 BDOC n.s. n.s.
F6 DOC 0.74 0.64
F6 RDOC 0.64 0.59
F6 BDOC 0.37 0.31
06 DOC 0.81 0.51
06 RDOC 0.54 0.47
06 BDOC 0.29 n.s.
BGD
11, 10203–10228, 2014
Seasonal variations in concentration and
composition of dissolved organic carbon in Tokyo Bay
A. Kubo et al.
Title Page
Abstract Introduction
Conclusions References
Tables Figures
◭ ◮
◭ ◮
Back Close
Full Screen / Esc
Printer-friendly Version
Interactive Discussion
Discussion
P
a
per
|
Discus
sion
P
a
per
|
Discussion
P
a
per
|
Discussion
P
a
per
|
Table 4.Degradation constants for DOC (k20) and normalized degradation constants at 15◦C
(k15) in F3, F6, and 06.R2indicates coefficient of determination.
Station Date k20(day−1) R2 k 15(day−1)
F3 Jan 2012 0.236 0.98 0.159
F3 Feb 2012 0.162 0.99 0.110
F3 Mar 2012 0.093 0.97 0.063
F3 Apr 2012 0.120 0.99 0.081
F3 May 2012 0.203 0.99 0.137
F3 Jun 2012 0.286 0.99 0.193
F3 Jul 2012 0.127 0.97 0.086
F3 Aug 2012 0.109 0.99 0.074
F3 Sep 2012 0.153 0.99 0.103
F3 Oct 2012 0.301 0.98 0.203
F3 Nov 2012 0.269 0.87 0.182
F3 Dec 2012 0.221 0.97 0.149
F6 Jan 2012 0.150 0.98 0.101
F6 Feb 2012 0.095 0.99 0.064
F6 Mar 2012 0.100 0.99 0.067
F6 Apr 2012 0.151 0.98 0.102
F6 May 2012 0.115 0.98 0.077
F6 Jun 2012 0.209 0.99 0.141
F6 Jul 2012 0.083 0.99 0.056
F6 Aug 2012 0.050 0.97 0.033
F6 Sep 2012 0.120 0.95 0.081
F6 Oct 2012 0.188 0.84 0.127
F6 Nov 2012 0.243 0.91 0.164
F6 Dec 2012 0.170 0.92 0.115
06 Jan 2012 0.043 0.94 0.029
06 Feb 2012 0.223 0.97 0.150
06 Mar 2012 0.091 0.98 0.061
06 Apr 2012 0.133 0.99 0.089
06 May2012 0.134 0.99 0.090
06 Jul 2012 0.089 0.97 0.060
06 Aug 2012 0.085 0.97 0.057
06 Sep 2012 0.094 0.99 0.063
06 Oct 2012 0.085 0.99 0.057
06 Nov 2012 0.146 0.94 0.098
06 Dec 2012 0.240 0.87 0.162
BGD
11, 10203–10228, 2014
Seasonal variations in concentration and
composition of dissolved organic carbon in Tokyo Bay
A. Kubo et al.
Title Page
Abstract Introduction
Conclusions References
Tables Figures
◭ ◮
◭ ◮
Back Close
Full Screen / Esc
Printer-friendly Version
Interactive Discussion
Discussion
P
a
per
|
Discus
sion
P
a
per
|
Discussion
P
a
per
|
Discussion
P
a
per
|
Figure 2.Changes in dissolved organic carbon (µmol L−1
) in surface water of(a)upper Arakawa River,(b)Shibaura STP, and(c)lower Arakawa River.
BGD
11, 10203–10228, 2014
Seasonal variations in concentration and
composition of dissolved organic carbon in Tokyo Bay
A. Kubo et al.
Title Page
Abstract Introduction
Conclusions References
Tables Figures
◭ ◮
◭ ◮
Back Close
Full Screen / Esc
Printer-friendly Version
Interactive Discussion
Discussion
P
a
per
|
Discus
sion
P
a
per
|
Discussion
P
a
per
|
Discussion
P
a
per
|
□ ∎
Figure 3. Seasonal variation of salinity (), temperature (◦C; ), particulate organic carbon
(µmol L−1;), and chlorophylla(µg L−1;) at station(a)F3,(b)F6, and(c)06.
BGD
11, 10203–10228, 2014
Seasonal variations in concentration and
composition of dissolved organic carbon in Tokyo Bay
A. Kubo et al.
Title Page
Abstract Introduction
Conclusions References
Tables Figures
◭ ◮
◭ ◮
Back Close
Full Screen / Esc
Printer-friendly Version
Interactive Discussion
Discussion
P
a
per
|
Discus
sion
P
a
per
|
Discussion
P
a
per
|
Discussion
P
a
per
|
Figure 4.Changes in dissolved organic carbon (µmol L−1) in surface water of(a)F3,(b)F6, and
(c)06. Black square: January 2011; gray square: February 2011; white square: March 2011; black diamond: April 2011; gray diamond: May 2011; white diamond: June 2011; black trian-gle: July 2011; gray triantrian-gle: August 2011; white triantrian-gle: September 2011; black circle: Octo-ber 2011; gray circle: NovemOcto-ber 2011; white circle: DecemOcto-ber 2011.
BGD
11, 10203–10228, 2014
Seasonal variations in concentration and
composition of dissolved organic carbon in Tokyo Bay
A. Kubo et al.
Title Page
Abstract Introduction
Conclusions References
Tables Figures
◭ ◮
◭ ◮
Back Close
Full Screen / Esc
Printer-friendly Version
Interactive Discussion
Discussion
P
a
per
|
Discus
sion
P
a
per
|
Discussion
P
a
per
|
Discussion
P
a
per
∎ □
Figure 5.Seasonal variation of DOC (), bioavailable DOC (BDOC;), and Recalcitrant DOC (RDOC;
∎
□
BGD
11, 10203–10228, 2014
Seasonal variations in concentration and
composition of dissolved organic carbon in Tokyo Bay
A. Kubo et al.
Title Page
Abstract Introduction
Conclusions References
Tables Figures
◭ ◮
◭ ◮
Back Close
Full Screen / Esc
Printer-friendly Version
Interactive Discussion
Discussion
P
a
per
|
Discus
sion
P
a
per
|
Discussion
P
a
per
|
Discussion
P
a
per
|
□ ∎
∎ ∎
●
Figure 6.Seasonal variation of RDOC derived from phytoplankton (
□
), terrestrial (ial (
∎
),
∎
∎
●
), and open oceanic waters (
∎
□
C;
∎
). The black square ()
) represents the total RDOC (µmol L−1) estimated bymultiple regression analysis. The black circle (•) with the dashed line represents the RDOC
(µmol L−1) determined by the incubation experiment.