DEPARTAMENTO DE ECONOMIA
PROGRAMA DE PÓS-GRADUAÇÃO EM ECONOMIA
TeachersŠ grading patterns and student learning:
evidence from São Paulo state public schools
Padrão de avaliação dos professores e aprendizado dos alunos:
evidências das escolas estaduais de São Paulo
Fernando Amaral Carnaúba
Orientador: Prof. Dr. Marcos de Almeida Rangel
Prof. Dr. Marco Antonio Zago Reitor da Universidade de São Paulo
Prof. Dr. Adalberto Américo Fischmann
Diretor da Faculdade de Economia, Administração e Contabilidade
Prof. Dr. Hélio Nogueira da Cruz Chefe do Departamento de Economia
Prof. Dr. Márcio Issao Nakane
TeachersŠ grading patterns and student learning:
evidence from São Paulo state public schools
Padrão de avaliação dos professores e aprendizado dos alunos:
evidências das escolas estaduais de São Paulo
Dissertação apresentada ao Departamento de Economia da Faculdade de Economia, Ad-ministração e Contabilidade da Universidade de São Paulo como requisito parcial para a obtenção do título de Mestre em Ciências.
Orientador: Prof. Dr. Marcos de Almeida Rangel
Versão Corrigida
(versão original disponível na Faculdade de Economia, Administração e Contabilidade)
FICHA CATALOGRÁFICA
Elaborada pela Seção de Processamento Técnico do SBD/FEA/USP
Carnaúba, Fernando Amaral
Teacher’s grading patterns and student learning: evidence from São Paulo state public schools / Fernando Amaral Carnaúba. -- São Paulo, 2015.
55 p.
Dissertação (Mestrado) – Universidade de São Paulo, 2015. Orientador: Marcos de Almeida Rangel.
1. Rendimento escolar 2. Teoria de resposta ao ítem 3. Avaliação da aprendizagem 4. Econometria I. Universidade de São Paulo. Fa-
culdade de Economia, Administração e Contabilidade. II. Título.
Agradeço à Fundação de Amparo à Pesquisa do Estado de São Paulo (FAPESP), à Coordenação de Aperfeiçoamento de Pessoal de Nível Superior (CAPES), à Fundação Instituto de Pesquisas Econômicas (FIPE), e à Fundação Lemann pelo apoio Ąnanceiro e institucional prestados durante a realização deste trabalho.
Aos professores Ricardo Madeira, Fernando Botelho, Eric Bettinger e Martin Carnoy, e ao colega Luan Paciencia pelas numerosas discussões que me ajudaram a compreender melhor as principais questões levantadas durante o trabalho.
Agradeço em especial ao professor Marcos Rangel, meu orientador neste trabalho, pela paciência, pela disponibilidade e pelos inúmeros conselhos oferecidos ao longo do percurso.
Neste trabalho propomos um novo método para a medição do padrão de avaliação dos professores, fundamentado na Teoria de Resposta ao Item. Investigamos, com base no novo método, a relação entre o padrão de avaliação do professor e o aprendizado do aluno. Nós simulamos os potenciais resultados de uma política de aprovação de alunos baseada exclusivamente em um teste padronizado (Saresp), que implicaria em um padrão de avaliação único para cada série e disciplina, em substituição à política atual em que os professores são responsáveis pela deĄnição sobre a aprovação de seus alunos. Estimamos os padrões de avaliação ótimos sob esta política, do ponto de vista da maximização do aprendizado dos alunos, e comparamos estes valores com os padrões de avaliação estimados para cada professor. Nossas estimativas indicam que os professores utilizam atualmente padrões de avaliação que são, em média, mais lenientes do que o padrão de avaliação ótimo estimado para a nova política.
We propose a new method for measuring teacher grading standards that is based on the Item Response Theory framework, and investigate the relationship between teacher grading standards and student learning in São Paulo State public schools in light of this new approach. We simulate a policy in which student achievement in a standardized examination (Saresp) is used as the passing grade criterion, setting a unique grading standard for each grade and subject that would substitute the current teacher-deĄned grading. We estimate the optimal standards that maximize student achievement under this policy, and compare them with the standards estimated for each individual teacher. Our estimates indicate that teachers currently apply standards that are, on average, more lenient than the optimal policy standards.
1 Introduction . . . 13
2 Previous literature on teacher grading patterns and student efort . . . 17
3 Data . . . 21
4 Theoretical framework . . . 23
4.1 Measuring teacher grading patterns with IRT . . . 23
4.2 Student behavior . . . 25
5 Empirical strategy . . . 29
5.1 Teacher grading patterns . . . 29
5.2 Student behavior . . . 30
6 Results . . . 33
6.1 Teacher grading patterns . . . 33
6.2 Student behavior . . . 34
7 Counterfactual analysis. . . 39
7.1 Optimal grading standards for some reference classrooms . . . 39
7.2 Optimal unique grading standards and policy discussion . . . 41
8 Relation to the previous literature . . . 45
9 Conclusion . . . 47
Bibliography . . . 49
1 Introduction
The impact of teachersŠ observable characteristics on the learning trajectories of students is a recurring theme in the economics of education literature. Several studies have uncovered empirical associations between teacher variables such as age, gender, experience, and the possession of professional degrees on student learning (Chetty, Friedman and Rockof (2011), Darling-Hammond (2010), Hanushek and Rivkin (2006), Bettinger and Long (2010)). But a main obstacle faced by this literature remains - that many important characteristics of teachers are, in fact, unobservable to the researcher.
It has also been shown by the recent empirical literature in quasi-experimental settings that the provision of performance feedback to students inĆuences achievement. Using data on high-school students in the Basque Country, Azmat and Iriberri (2010) Ąnd that the provision of feedback information leads to an average 5% increase in student scores. Similar conclusions are drawn by Bandiera, Larcinese and Rasul (2012), based on student records in a leading university in the United Kingdom. They estimate that the provision of feedback increases student performance by 13% on average. Moreover, the authors show how feedback works as an incentive mechanism that elicits heterogeneous responses across students. Their results indicate that while high-achieving students apply more efort when they receive feedback, low achieving students tend not to change efort levels.
The combined results of those two strands in the literature raise the point that an important unobserved characteristic of teachers is the method and rigor of evaluation used in the classroom, as well as the method of disclosure of achievement to students. While several choices involved in teaching are imposed as an external decision by the state-level authority and are fairly veriĄable - such as curriculum and classes schedules - grading is mostly an unveriĄable action and arguably constitutes the major incentive tool to be used in the classroom at the instructorŠs discretion.
14
improve student outcomes (Haz, 2012, Figlio and Lucas, 2004, Betts and Grogger, 2003, and Betts, 1997). As described in more detail in the next section, this literature has focused on a univariate measure of teacher grading patterns based on the diference between mean achievement of students in the classroom and in external evaluations.
We propose a new method to quantify teachersŠ grading patterns that difers slightly from this literature. Our new strategy relies on an established solution to an analogous problem faced by the Test Theory literature: the measurement of scoring patterns of items in multiple choice tests. Test Theory has tackled the issue of item scoring characterization with Item Response Theory (IRT) models.
In light of this new approach, we analyze a rich database of public schools from the state of São Paulo in Brazil to investigate the impact of teacher grading patterns on student learning trajectories. We shed light on possible policy implications, including the simulation of a policy that centralizes student grading, by substituting a central standardized examination for the current teacher-based grading. Our contribution to the literature is twofold: (i) we are the Ąrst paper to analyze the relationship between student efort and teacher grading patterns for the Brazilian case, and (ii) we argue that through a more interpretable modelling of the relationship between student efort and teacher grading patterns, our new approach allows for more precise policy recommendations.
Nevertheless, several caveats should be noted and we recommend that our results be interpreted with caution. First, our analysis is restricted to the cognitive dimension of student abilities and focuses only on the maximization of mean test scores. Several other objectives should be taken into account in any policy decision such as noncognitive abilities, retention rates and distributional efects, to name a few. Second, we Ąnd evidence that our empirical approach may sufer from endogeneity problems which may lead to biased estimates. As a result, we suggest that our study be interpreted only as a starting point to further discussion about how to improve grading in Brazil and point out to some possible directions for future research.
2 Previous literature on teacher grading patterns and
student effort
The major obstacle to the investigation of the impact of grading patterns on student learning is that grading patterns are not directly observable to the researcher. It is necessary, thus, to recur to an indirect form of measurement. Albeit with some minor variations, the existing literature shares a common method for measuring grading patterns (Haz, 2012, Figlio and Lucas, 2004, Betts and Grogger, 2003, and Betts, 1997). Their main strategy is to compare the average scores of students in school with their scores in external standardized exams. With minor variations, in those studies the grading patterns are computed as the teacher Ąxed-efects coeicients in a regression of student standardized scores (�����) on classroom marks (�����_����)1. This empirical procedure leads to the
following estimation equation:
�����i =
Nteachers
︁
j=1
[Ðj����ℎ��ij] +Ñ�����_����i+�ij (2.1)
Where�indexes students,� indexes teachers,����ℎ��ij are teacher dummy variables and Ðj are teacher grading pattern coeicients. In this deĄnition, the higher the value of a teacher grading pattern, the more rigorous he is in assigning marks to his students. The intuition behind the estimation is that the teacher-Ąxed efect can be interpreted as a shift in students �����, given his classroom mark. A large positive Ąxed efect for teacher
�, thus indicates that his students are expected to present higher standardized scores for
any given classroom mark.
To investigate the relationship between grading patterns and student efort, the existing literature also resorts to a common framework with minor variations. It consists of a linear regression of students score gains in standardized exams on teacher grading
1
In order to avoid confusion, we use the termclassroom mark ormarkto refer to grades obtained by students in the school, as assigned by their teachers, and save the term grade for references to curriculum years (1�� grade, 2��grade, and so forth). Student achievement in standardized external
18
standards, as described in the following equation:
Δ�����i,t =Ñ��������ij,t+��s,t+�ij,s,t (2.2)
Where � indexes students, � teachers, � schools and � time, ��������ij,t is the grading standard faced by the student (i.e. coeicients Ðj estimated in equation 1), and
�s,t is a vector of controls for school observable characteristics.
In the Ąrst known empirical study on the subject, Betts (1997) analyzed school-level grading patterns. Using data from the Longitudinal Study of American Youth (LSAY), he found higher grading standards to be associated with higher average achievement. Furthermore, he Ąnds grading standards to have larger efects among high-achieving students.
Also measuring grading patterns at the school level, Betts and Grogger (2003) use data from the High School and Beyond survey to point out to likewise conclusions - higher grading patterns are associated with higher student scores, and larger efects are present among high achievers.
Figlio and Lucas (2004) were the Ąrst to measure grading standards at the teacher level. Analyzing data from a large school district in Florida, they also Ąnd higher grading standards to be associated with larger student score gains and larger efects among high-achieving students.
Haz (2012) estimates grading standards at the subject-school level, using a national database of 4th graders in Chile. As in Figlio and Lucas (2004), she Ąnds higher grading standards to be positively associated with student score gains. In her study, though, larger gains are found among students at the bottom of the distribution of baseline scores. A main empirical advancement in Haz (2012) is that she corrects for the endogeneity in equation (2.2) by using past standards as an instrument to current standards.2
2
Equation (2.2) is endogenous because the currentscoreappears on both sides of the equation. On the left-hand sidescore�,� composes the measurement of student achievement gain, ∆score�,�. On the
right-hand side, it takes part in the calculation ofstandards��,�. This endogeneity results on a positive
for both ∆score�,� andstandards��,�. Conversely, the effect of a negative random shock inscore�,� is
negative for both ∆score�,� andstandards��,�. Measurement error inscore�,� thus forces a positive
3 Data
This research makes use of three databases: (i) administrative records of student achievement in school (marks assigned by teachers); (ii) a standardized and blindly corrected examination administered by the state-level authority (Saresp); and (iii) administrative records of teacher-classroom assignments1. The databases cover the years between 2008 and 2011.
StudentsŠ administrative records include marks assigned by teachers and attendance records for all students enrolled in the schools directly administered by São Paulo State Secretary of Education. Marks are subject-speciĄc, assigned quarterly and summarized in a Ąnal mark that represents overall achievement through the year2.
The standardized tests database consists of a statewide assessment, the São PauloŠs Performance Evaluation System (Sistema de Avaliação de Rendimento Escolar do Estado de São Paulo Ű Saresp). The Saresp examination covers math, language and science3, and is taken by students in the public system of education in grades 2 and 4 (elementary school), 6 and 8 (middle school), and 11 (high school). Student scores are calculated separately for each subject available using the Three Parameter Logistic Model of Item Response Theory, with the same scale of the nationwide exam Prova Brasil, which was set to have mean 250 and standard deviation 50 for the population in 8th grade that took this exam in in 1997. The scale used in Saresp is invariant from 4th to 11th grades, which allows scores to be comparable not only across years but also across most grades. The exam is also accompanied by a comprehensive socioeconomic survey. The scale is mapped into a set of learning standards for each grade and classiĄed into proĄciency levels, which are reproduced in Appendix A.
The teachersŠ administrative database consists of unique codes to identify assign-ments of teachers to classes. Teacher codes are consistent longitudinally, allowing for the
1
All databases were shared with Prof. Marcos Rangel by São Paulo’s Secretary of Education, under cooperation and confidentiality agreements.
2
Only the final marks are used in this study. 3
22
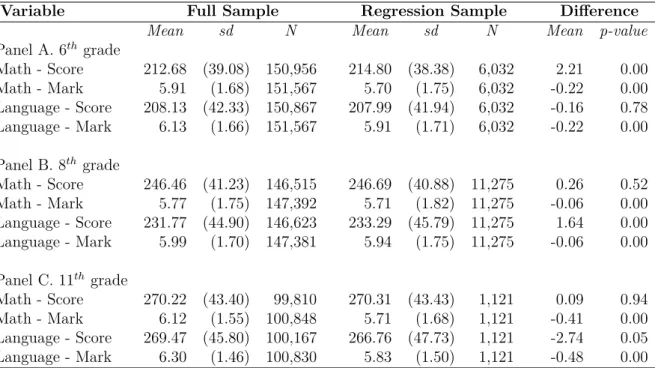
Table 1 Ű Descriptive statistics
Variable Full Sample Regression Sample Difference Mean sd N Mean sd N Mean p-value
Panel A. 6th grade
Math - Score 212.68 (39.08) 150,956 214.80 (38.38) 6,032 2.21 0.00 Math - Mark 5.91 (1.68) 151,567 5.70 (1.75) 6,032 -0.22 0.00 Language - Score 208.13 (42.33) 150,867 207.99 (41.94) 6,032 -0.16 0.78 Language - Mark 6.13 (1.66) 151,567 5.91 (1.71) 6,032 -0.22 0.00
Panel B. 8thgrade
Math - Score 246.46 (41.23) 146,515 246.69 (40.88) 11,275 0.26 0.52 Math - Mark 5.77 (1.75) 147,392 5.71 (1.82) 11,275 -0.06 0.00 Language - Score 231.77 (44.90) 146,623 233.29 (45.79) 11,275 1.64 0.00 Language - Mark 5.99 (1.70) 147,381 5.94 (1.75) 11,275 -0.06 0.00
Panel C. 11thgrade
Math - Score 270.22 (43.40) 99,810 270.31 (43.43) 1,121 0.09 0.94 Math - Mark 6.12 (1.55) 100,848 5.71 (1.68) 1,121 -0.41 0.00 Language - Score 269.47 (45.80) 100,167 266.76 (47.73) 1,121 -2.74 0.05 Language - Mark 6.30 (1.46) 100,830 5.83 (1.50) 1,121 -0.48 0.00
Note: All variables are presented in levels.Score refers to the Saresp examination, and is measured using IRT.M arkrefers to final yearly classroom marks assigned by teachers, on a scale 0-10.
yearly identiĄcation of teacher-student assignment.
Summary statistics for our full dataset and our main sample of interest are shown in Table 1. The sample of interest is restricted to students for whom we have information on all variables necessary for our Ąnal estimations4. Even though several variables show a signiĄcant diference in means, the magnitudes of the diferences are small in terms of standard deviations of the full sample. The largest relative diferences are present in language and math marks, with respective sample diferences of .33 and .27 standard deviations in 11th and .13 and .13 standard deviations in 6th grade. For all other variables, mean diferences between the full and restricted samples are smaller than .05 standard deviations.
4
4 Theoretical framework
4.1
Measuring teacher grading patterns with IRT
We propose a new approach to quantifying teacher grading patterns that difers slightly from the framework used in the previous literature. Our approach draws from the test measurement theory, which has established Item Response Theory modelling as a standard method for measuring grading patterns of items. The core underlying assumption of IRT is that the probability of a student correctly answering a given item of an examination is a monotone and increasing function of his (latent) ability level. Each item is thus characterized by a particular function that maps latent ability levels of students into probabilities of correctly answering the item, called the Item Characteristic Curve (ICC). Therefore, the characterization an itemŠs scoring pattern amounts to the complete speciĄcation of its ICC (Baker, 1992). For example, if an item � assigns a lower
probability of correctly answering than item � for all possible levels of latent abilities,
than item � is unequivocally more ��� � �����than item �. We transpose this idea to the
measurement of teacher grading patterns Ű so we model the probability of scoring above a threshold in the classroom marks as a monotone function of student ability.
Thus, in order to quantify teacher grading patterns under the IRT framework, a Ąrst necessary step is to dichotomize marks, for example, into pass/fail or high/low achievement1. The highest category is then interpreted analogously to a Şcorrect answerŤ, or a ŞsuccessŤ in a standard IRT model. As a result, the characterization of a teacherŠs grading pattern amounts to the complete speciĄcation of his ICC. A second step is to choose the functional form of the ICC. We adopt the Two-Parameter Logistic Model
1
24
(2PLM)2.
�(�������i|�i;�j;�j) =
1
1 +�⊗aj(θi⊗bj) (4.1)
As the name suggests, in this model the ICC of each teacher� is fully characterized
by two parameters, which we describe using the conventional notation in the literature and the pass/fail dichotomization example. Parameter �, called ��� � ������ (or location)
provides a measurement of the overall diiculty imposed by the teacher. More precisely, �
is the latent ability level required for a student to have exactly 50% chance of receiving a passing grade from his teacher. Parameter�, called �����, deĄnes the rate of transformation
of latent abilities into probabilities of receiving a passing grade, and is directly proportional to the steepness of the ICC at point �. Figure 1illustrates a general 2PLM characteristic
curve.
Figure 1 Ű Item Characteristic Curve (ICC)
In standard IRT models it is usual to jointly estimate item parameters and student
2
abilities using a Maximum-Expectation algorithm (Schilling and Bock, 2005, Bock and Aitkin, 1981)3. But if reliable estimates of student abilities are available and only the item parameters are left to be estimated, a simple maximum likelihood estimation can be run separately for each item.
4.2
Student behavior
We assume students derive diferent utility levels from obtaining a������� or � ���
grade in the classroom, and that studying is costly4.
�(�i) = ︁ ︁ ︁ ︁ ︁ ︁ ︁
�(�������i)−�(�i), if �����_����i ≥�
�(� ���i)−�(�i), if �����_����i < �
(4.2)
Where �(�������i)−�(� ���i) > 0, �i ≥ 0 and �(�i) is a continuous and twice diferentiable function, with �′(�
i)>0 and �′′(�i)<0. Using an aine transformation to normalize�(�������i) = 1 and�(� ���i) = 0, and assuming students are risk-neutral, utility is given by5:
�(�i) = �j(�������ij|�i)−�(�i) s.t. �i =�0i +�i (4.3)
Where�j(�������ij|�i) is a teacher-speciĄc function that maps efort and baseline scores (�i) into probabilities of obtaining�������. Taking advantage of the IRT framework used to model teacher grading patterns, the probability of success is given by the 2PLM characteristic curve set by each teacher, represented in equation (4.4). We use a quadratic polynomial form to characterize the convexity of the cost function, as expressed in equation
3
There are several other methods for the estimation of IRT models. See Wirth and Edwards (2007) for a comprehensive review.
4
Our model draws, in part, from Haz (2012). 5
26
(4.5).
�j(�������ij|�i) =
1
1 +�⊗aj(θi⊗bj) (4.4)
�(�i) =
Ò
2(�i)2 (4.5)
Substituting equations (4.4) and (4.5) in (4.3) and framing the student decision on his choice of score � leads to the following individual maximization problem:
�1 =������θ
⎦ 1
1 +�⊗a(θ⊗b) −
Ò
2(�−�0)
2⎢ s.t. �
i ≥�0i (4.6)
with Ąrst and second-order conditions:
FOC: ��
⊗a(θ⊗b)
(1 +�⊗a(θ⊗b))2 −Ò(�−�0) = 0 (4.7)
SOC: 2��
⊗2a(θ⊗b)−�2�⊗a(θ⊗b)(1 +�⊗a(θ⊗b))2
(1 +�⊗a(θ⊗b))4 −Ò <0 (4.8)
Note that the studentŠs optimal choice of efort is always positive, or, equivalently
�i > �0i. This results from the fact that the marginal cost�′(�) is zero at �i =�0i, while the marginal gain in utility from the increase in the probability of success, �′
j(�) is positive at this (and any) point. Thus, there exists �1 > �0i such that�(�1)> �(�0i).
Figure2 illustrates the choice of the optimal score gain (or analogously, efort) for students with diferent baseline scores. As exempliĄed in Panel 1, students with scores far below the diiculty parameter (�) will exert very low efort, because�′
j(�) is very low for values of� around the student initial level of ability (note that���θ⊃⊗∞�
′
j(�) = 0)). Those are the students that will start the year with a low probability of�������, and will not try
with scores far above the diiculty parameter (�) will also chose to exert very low efort,
because �′
j(�) is also very low at their baseline scores (note that ���θ⊃+∞� ′
j(�) = 0). This is the case of students that already begin the year with a probability of ������� that is
close to 1, letting almost no room for gains from exerting efort.
Students with baseline scores closer to the diiculty parameter will be the ones who will exert lager efort, since they will be able to beneĄt from the section where the payof �′
j(�) is the highest. Panel 3 illustrates this situation.
28
5 Empirical strategy
5.1
Teacher grading patterns
As described in Section 4.1, our measure of grading patterns requires classroom marks to be dichotomized into two categories (success/fail). We estimate grading patterns for every possible threshold, starting at the passing mark (below/above or equal 5) and going up to the highest available mark (below/equal 10) and analyze which of them provides the best Ąt to the data. For each threshold �, the ICC of teacher � is thus given
by the 2PLM:
�(�����_�����≥�|������;�jk, �jk) =
1
1 +�⊗ajk(saresp⊗bjk) (5.1)
A key fact to understanding the estimation procedure adopted is that we use student latent ability values that were already estimated externally to the context of the study. Those latent ability values are the very studentsŠ scores provided in their Saresp examinations, which, as we have mentioned, are calculated using IRT. With known student abilities, estimation of teacher ICC parameters amounts to maximizing a simple likelihood function, in which the likelihood associated with each observation is given by the probability of occurrence of the studentŠs outcome (success/fail), conditionally on his latent ability. Furthermore, the two parameters of each teacher will only appear in the individual likelihoods associated with his respective students, allowing for the maximization procedure to be run separately for each teacher (and threshold).
Thus, we estimate teacher grading parameters through the maximization of the following log-likelihood for each teacher � and threshold �:
( ^�jk,�^jk) = ������a,b ︁
i∈Nj {�i
1
1 +�⊗ajk(sarespi⊗bjk) + (1−�i)(1−
1
1 +�⊗ajk(sarespi⊗bjk))}
30 where: ︁ ︁ ︁ ︁ ︁ ︁ ︁
�i = 1, if �����_����i ≥�
�i = 0, if �����_����i < �
This is numerically equivalent to running one logit regression for each teacher and threshold, in which the running variable is the latent ability of her students (Saresp scores), and the dependent variable is the dichotomous success/fail variable.
5.2
Student behavior
Since we have estimated teacher grading patterns (�j and �j) and observe both baseline scores (������j,t⊗2) and current scores (������j,t), the student cost coeicientÒ is the only unknown parameter left to be estimated in order to fully characterize the student decision problem in equation (4.6). This parameter has a very speciĄc interpretation: it is the rate of growth of the marginal cost of studying (measured in gains in the probability
�������), in terms of acquired ability (measured in the Saresp scale). Moreover, the
underlying theoretical framework informs us that Ò should be positive. We estimate Ò
using a non-linear least squares estimation framework.
Consider the student maximization problem in equation (4.6). Even though the problem admits no closed-form solution for �1, we can deĄne a function (to be estimated
numerically) that maps student input variables �0, �ij, �ij and the parameter Ò into the chosen level of ability �:
�(�0, �ij, �ij, Ò) =������θ
⎦ 1
1 +�⊗aij(θ⊗bij) − Ò
2(�−�0)
2⎢ s.t.� ≥�
The non-linear least squares estimator for Ò can then be deĄned as:
^
Ò =������γ ⎟
︁
i∈N
(�(�0, �ij, �ij, Ò)−�1)2 ⟨
(5.4)
Substituting (5.3) in (5.4) and writing the equation in terms of our data, we arrive at the following NLS estimation:
^
Ò =������γ ︁
︁
i∈N
{������θ
⎦ 1
1 +�⊗aij(θ⊗bij) − Ò
2(�−�0)2 ⎢
−������i,t}2 ︀
(5.5)
which we estimate numerically using brute-force algorithms for both the inner maximization of the student utility and the outer minimization of squared residuals1.
1
6 Results
6.1
Teacher grading patterns
Tables 2 and 3 present descriptive statistics for parameters � and � estimated
from equation (5.2). The fact that our standardized score is measured on a common scale for all grades in the data allows us to run a validity check of our measured grading standards: in theory, as students advance to further grades in school, teachers are expected to require increasing levels of knowledge from students in order to reward them with a given classroom mark. Taking the pass/fail dichotomization as an example (≥5), teachers
are expected to require an increasing level of knowledge in order to reward students with a passing grade, which should be reĆected as higher estimated � parameters for higher
grades. We show in Table 3 that the estimated standards follow this pattern Ű that is, for every dichotomization (from ≥5 to≥10), the median value of � across teachers increases
as students move up to higher grades.
The only exception to this is the threshold 5 (passing grade) for 11th grade, which is lower than that of 8th grade for both math and language. This may be related to the fact that 11th grade is the last in secondary school. As such, passing 11th grade leads to the attainment of an important labor market signal which is a formal and informal reference in hiring. Secondary degree completion is required, for example, in the vast majority of civil servant positions. As a result, teachers may be reluctant to retain students.
When we compare the estimates of � with proĄciency levels deĄned by Saresp
(reproduced in Appendix A), a general pattern emerges that median coeicients for the passing grade (≥5) are always lower than the below basic reference score. This implies
that there are students with ability level below basic who have more than 50% chance of
receiving a passing grade. This is especially pronounced in 11th grade, in which the median
� (166.1 for math and 144.2 for language) is more than two standard deviations below the
below basic threshold (275 and 250, respectively).
34
is in general very close to the advanced threshold. This suggests that students who are
considered advanced in Saresp tend to also be rewarded with the highest possible mark in their classrooms.
Another general pattern is that the slope parameter�increases for higher thresholds,
in any given grade and subject. At Ąrst, this could indicate that teachers may interpret increases in the Saresp scale diferently at diferent points of the scale. As we have pointed out, higher thresholds are associated with higher � parameters, so when we compare �
coeicients across diferent thresholds we are actually comparing the rate of transformation of Saresp scores into classroom grades at diferent points of the scale. The pattern would then imply that teachersŠ scales are, in general, more granular for higher levels of ability. If this were the case, we would expect � to also be increasing in grades, because the �
parameter is also increasing in grades for any given threshold. The data shows a diferent pattern, though, with �decreasing in higher grades. A second possible explanation Ű which
we are not able to asses from the available data - is that for lower thresholds, teachers take more into account factors external to the cognitive ability level measured in Saresp such as class participation and group work.
6.2
Student behavior
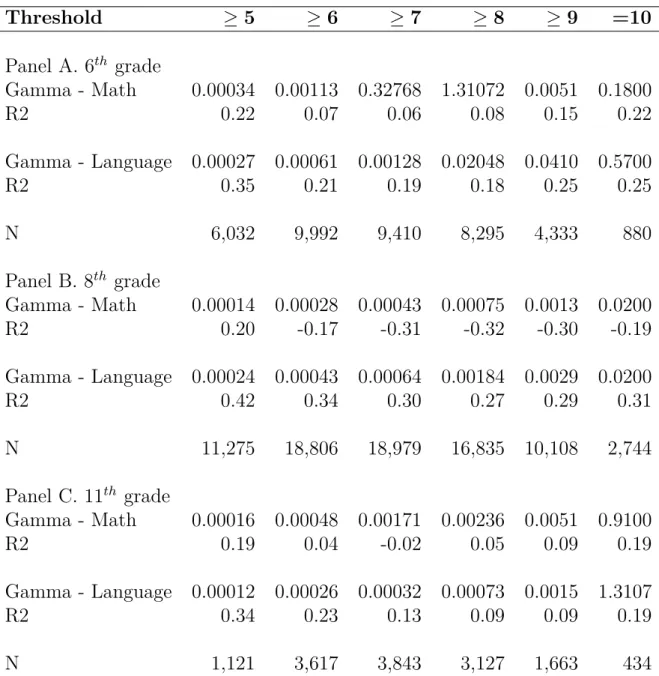
We estimate equation (5.5) by NLS for each possible threshold, separately by grade and subject. Results are show in table 4. Consistently with the theoretical model, estimates of the cost parameter Ò are positive for all thresholds and grades.
As in the case of parameter�, we observe a pattern of increasing values of Ò for
higher thresholds, for any given grade and subject. That raises the same possibility that have explored for �Ű that the scale of Saresp may be ŞcompressedŤ for in the higher end of
Table 2 Ű Estimates of teacherŠs grading parameters a (slope)
Math Language
Median Mean sd N Median Mean sd N
Panel A. 6th grade Threshold
≥5 0.034 0.119 0.470 57,599 0.035 0.200 0.699 48,946 ≥6 0.035 0.042 0.026 83,169 0.034 0.041 0.027 74,403 ≥7 0.039 0.069 0.204 83,096 0.036 0.051 0.092 74,504 ≥8 0.047 0.335 1.022 76,552 0.039 0.243 0.803 69,314 ≥9 0.057 0.895 1.945 55,898 0.045 0.679 1.614 49,431 ≥10 0.074 1.265 2.213 24,096 0.051 1.073 2.031 19,911
Panel B. 8th grade Threshold
≥5 0.028 0.050 0.148 60,215 0.030 0.133 0.519 54,284 ≥6 0.028 0.032 0.019 80,733 0.028 0.033 0.020 72,432 ≥7 0.031 0.038 0.028 80,743 0.030 0.037 0.027 72,464 ≥8 0.038 0.256 0.814 74,254 0.035 0.173 0.603 67,085 ≥9 0.046 0.702 1.576 55,400 0.043 0.640 1.530 47,592 ≥10 0.061 1.063 1.849 25,853 0.054 0.929 1.756 18,787
Panel C. 11th grade Threshold
≥5 0.022 0.035 0.060 21,823 0.022 0.046 0.159 16,859 ≥6 0.020 0.022 0.013 44,237 0.019 0.023 0.015 37,615 ≥7 0.022 0.026 0.016 45,092 0.022 0.026 0.017 39,818 ≥8 0.026 0.084 0.305 41,306 0.028 0.080 0.316 35,665 ≥9 0.035 0.449 1.116 29,558 0.037 0.459 1.258 23,628 ≥10 0.048 0.868 1.561 13,585 0.044 0.777 1.667 8,707
Note: Estimates are run separately for each teacher, grade and threshold. Sample size N refers to the number of students.
values ofÒ across grades, though, we Ąnd that the parameter assumes its lowest values in
36
Table 3 Ű Estimates of teacherŠs grading parameters b (diiculty)
Math Language
Median Mean sd N Median Mean sd N
Panel A. 6th grade Threshold
≥5 152.9 140.1 57.1 57,599 140.6 127.8 58.0 48,946 ≥6 210.6 208.9 28.8 83,169 192.9 191.1 30.3 74,403 ≥7 240.5 241.1 26.8 83,096 228.7 229.2 29.1 74,504 ≥8 264.1 268.0 30.7 76,552 259.2 263.7 35.7 69,314 ≥9 282.1 287.7 34.2 55,898 283.4 291.1 43.3 49,431 ≥10 293.7 298.5 32.3 24,096 294.7 304.7 46.3 19,911
Panel B. 8th grade Threshold
≥5 177.4 159.5 70.0 60,215 154.1 137.2 66.8 54,284 ≥6 251.3 250.3 35.3 80,733 220.4 218.4 35.9 72,432 ≥7 283.9 285.8 34.7 80,743 261.1 262.9 35.9 72,464 ≥8 308.1 314.1 40.6 74,254 293.5 299.3 42.3 67,085 ≥9 325.4 332.1 39.7 55,400 314.9 323.7 45.2 47,592 ≥10 339.9 347.5 44.2 25,853 326.1 334.2 41.1 18,787
Panel C. 11th grade Threshold
≥5 166.1 120.9 128.8 21,823 144.2 114.6 106.8 16,859 ≥6 261.1 256.1 66.6 44,237 238.0 229.7 68.2 37,615 ≥7 308.8 312.1 56.3 45,092 297.5 296.4 55.0 39,818 ≥8 343.6 352.2 57.6 41,306 338.1 344.0 57.0 35,665 ≥9 361.6 378.3 65.5 29,558 356.7 373.0 63.6 23,628 ≥10 372.6 381.6 53.6 13,585 367.6 379.2 55.0 8,707
Table 4 Ű Non-linear Least Squares estimates of studentsŠ gamma parameters (cost)
Threshold
≥
5
≥
6
≥
7
≥
8
≥
9
=10
Panel A. 6
thgrade
Gamma - Math
0.00034 0.00113 0.32768 1.31072 0.0051 0.1800
R2
0.22
0.07
0.06
0.08
0.15
0.22
Gamma - Language 0.00027 0.00061 0.00128 0.02048 0.0410 0.5700
R2
0.35
0.21
0.19
0.18
0.25
0.25
N
6,032
9,992
9,410
8,295
4,333
880
Panel B. 8
thgrade
Gamma - Math
0.00014 0.00028 0.00043 0.00075 0.0013 0.0200
R2
0.20
-0.17
-0.31
-0.32
-0.30
-0.19
Gamma - Language 0.00024 0.00043 0.00064 0.00184 0.0029 0.0200
R2
0.42
0.34
0.30
0.27
0.29
0.31
N
11,275
18,806
18,979
16,835 10,108
2,744
Panel C. 11
thgrade
Gamma - Math
0.00016 0.00048 0.00171 0.00236 0.0051 0.9100
R2
0.19
0.04
-0.02
0.05
0.09
0.19
Gamma - Language 0.00012 0.00026 0.00032 0.00073 0.0015 1.3107
R2
0.34
0.23
0.13
0.09
0.09
0.19
N
1,121
3,617
3,843
3,127
1,663
434
7 Counterfactual analysis
7.1
Optimal grading standards for some reference classrooms
Consider the decision problem of a teacher who wants to choose his grading parameters in order to maximize the mean achievement of his �j students in the Saresp examination. Students have a common cost parameter Ò and individual baseline abilities �0i, which are all observable to the teacher:
(�*
j, �
*
j) = ������a,b ︁
i∈Nj
�1j s.t.
��⊗a(θ1j⊗b)
(1 +�⊗a(θ1j⊗b))2 =Ò(�1i−�0i) (7.1)
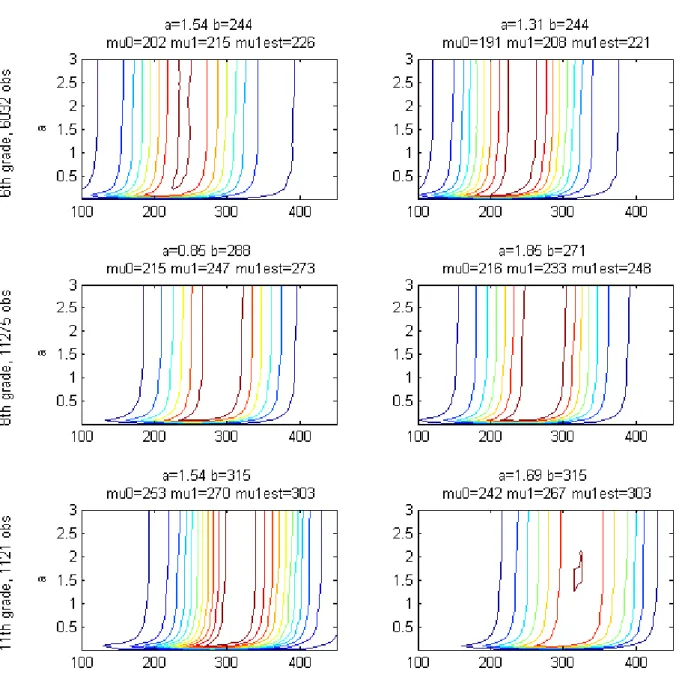
We study the solution to (7.1) for simulated classroom settings that aim to represent general patterns of 6th grade language classrooms. Results are shown in Table 5 and illustrated in Figure 3. We set the classroom size to 30 and test 9 combinations of mean and variance of baseline scores, using the parameter Ò estimated for 6th grade language. The classroom mean increases from row 1 to rows 2 and 3 - we add 50 and 100 points1 on each subsequent row, and set row 2 to match the mean of 6th graders in language. As for variances, we start with a constant distribution (column 1), on which we perform two mean preserving spreads, the Ąrst with the imposition of a uniform distribution of range 150 (column 2), and the second with the imposition of a uniform distribution of range 300 (column 3)2.
As expected, increases in the mean baseline scores lead the optimal� parameter
to increase by the same amount, while the optimal � remains unchanged. Increases in
variance, on the other hand, imply a lower optimal �. This results from the fact that
students optimal choice of efort is asymmetrical in relation to the distance between their baseline score and �. Students with baseline scores below � exert more efort than students
with scores above �, for any given distance. Thus, when we perform a mean preserving
1
The standard deviation of 6th grade language scores in our full sample is 42.33. 2
40
Table 5 Ű Mean Student Achievement Under Diferent Class Setting an Grading Parameters
mean(�0) = 158 mean(�0) = 208 mean(�0) = 308
mean(�1) a b mean(�1) a b mean(�1) a b sd(�0) = 0 242 0.66 237 292 0.5 286 392 0.59 387 sd(�0) = 46 185 0.49 197 233 0.62 254 333 0.41 367 sd(�0) = 91 187 0.33 197 225 0.42 197 321 0.24 262
spread in the classroom distribution of baseline scores, the loss in efort from students that shift further from � is larger for students below � than for students above �. As a result, it
is optimal for the teacher to lower the chosen diiculty parameter.
Our analysis of the optimal grading pattern for diferent classroom settings leads thus to two conclusions. First, holding classroom variance of baselines scores Ąxed, grading standards should be set higher for higher average baseline scores. Second, holding classroom average baseline scores Ąxed, grading standards should be set lower in classrooms with higher baseline score variance.
7.2
Optimal unique grading standards and policy discussion
Consider the decision problem of a policy maker who wants to choose a unique grading pattern to be used by all teachers that maximizes the mean achievement of all �
students in Saresp. Students share a common cost parameter Ò and individual baseline
abilities �0i, which are all observable to the policy maker:
(�*
j, �
*
j) = ������a,b ︁
j∈J ︁
i∈Nj
�1j s.t.
��⊗a(θ1j⊗b)
(1 +�⊗a(θ1j⊗b))2 =Ò(�1i−�0i) (7.2)
It is important to emphasize that this problem characterizes a policy that substi-tutes Saresp for the current grading pattern. That is, it simulates a situation in which Saresp would be used as the passing grade criterion, replacing students classroom marks. Alternatively, it can be interpreted as the upper-bound estimate of the expected results of merely disclosing Saresp scores to students.
Interestingly, there is no unambiguous theoretical prediction as to whether the optimal unique standard policy should lead to higher average achievement than the current teacher autonomy policy. On one hand, setting a unique standard could guarantee that the (unique) optimal standard is implemented in every classroom. This could lead to an improvement in efort of several students who may currently be assigned to a teacher whose standards are sub-optimal. On the other hand, setting a unique standard is a very strong restriction in comparison to the teacher-deĄned current grading policy, in which several diferent standards can be used to efectively adapt for the optimal setting at each classroom. This loss in degrees of freedom could lead to an overall decrease in student efort if teachers are currently applying grading standards that do not depart much from the optimum.
We solve the problem numerically3 for the passing grade threshold, using our estimates of Ò for each grade and subject, and our data on student baseline levels of ability.
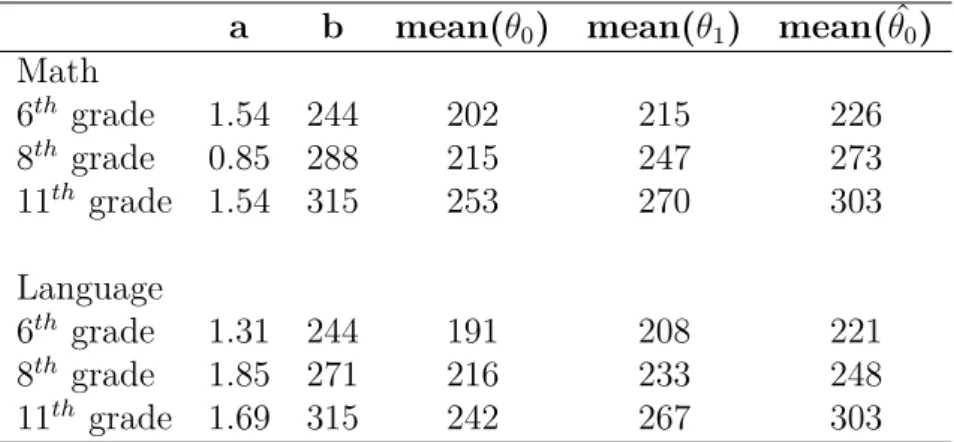
Results are shown in Table 6 and illustrated in Figure 4.
3
42
Figure 4 Ű Mean Student Achievement Under Unique Standards Policy
Our estimates of the impact of the new policy in mean student achievement are positive for all grades and subjects. The implied increases in mean scores ranges are fairly large, ranging from .28 (11 points in 6th grade math) to .99 (43 points in 11th grade language) standard deviations of the respective grade and subject full sample scores.
All estimated�* coeicients are fairly higher than the range of median estimates
Table 6 Ű Mean Student Achievement Under Unique Standards Policy
a b mean(�0) mean(�1) mean(�^0) Math
6th grade 1.54 244 202 215 226
8th grade 0.85 288 215 247 273
11th grade 1.54 315 253 270 303
Language
6th grade 1.31 244 191 208 221
8th grade 1.85 271 216 233 248
11th grade 1.69 315 242 267 303
would have probability of passing close to one.
Estimates for �* are signiĄcantly higher than the estimates of teacher grading
patterns - for all grades and subjects, �* is more than one standard deviation above the
correspondent median teachers. In all cases, our estimates of passing-grade �* are closer to
teachers median values of thresholds 7 and 8 Ű in fact, for all grades and subjects �* is
between the correspondent median b for thresholds 7 and 8 of estimated for teachers.
As discussed in Section 6.1, a main motivation for teachers to implement passing grade patterns with � coeicients that are sub-optimal may be the reduction of retention
rates. If this is the case, we should expect the observed grading patterns to be further from the optimum in grades 8th and 11th than in 6th, because São Paulo State public schools were under a policy of automatic approval for students in this grade. We have also pointed out that stakes involved in graduation in 11th are arguably the highest across the three grades we analyze, suggesting that the � should be the furthest from�* in this
grade. Our results match this description. Math median teacher estimates are found to be further from �* as we move from 6th to 8th and 11th grades (91.1, 110.6 and 148.9 points, respectively), as well as language estimates (103.4 , 116.9 and 170.8, respectively).
This pattern raises the point that retention rates are an important dimension related to grading, and should be taken into account in actual policy-making. We suggest this as an important venue to be explored in future studies.
44
8 Relation to the previous literature
We now replicate the empirical strategy used in the previous literature with our data. Teacher grading patterns are estimated by taking the diference in mean student achievement in standardized test scores and in the classroom, which is one of the variations of equation (2.1) used in the literature. Imposing Ñ = 1 in equation (2.1), estimates of
grading patterns simplify to:
�����i =
Nteachers
︁
j=1
[Ðj����ℎ��ij] +�����_����i+�ij (8.1)
We then analyze the relationship between grading standards with the same linear regression speciĄcation used in previous studies. Two diferent dependent variables are tested: current scores (equation (8.2)) and gains in scores (equation (8.3)).
������j,t =Ð+Ñ���������k,t+�j,t (8.2)
Δ������j,t,t⊗2 =Ð+Ñ���������k,t+�j,t (8.3)
We also replicate the identiĄcation strategy of Haz (2012), using lagged standards as instruments for current standards. Estimates are presented in Table 7. Columns (1) and (2) show results for Math for equations (8.2) and (8.3), respectively, while columns (3) and (4) introduce lagged standards as instruments for current standards. Columns (5-8) mirror
columns (1-4) for language.
46
Table 7 Ű Regressions of Scores on Teacher Grading Patterns
Math Language
OLS IV OLS IV
(1) (2) (3) (4) (5) (6) (7) (8) Panel A. 6thgrade
Standards 0.458*** 0.152*** 0.316*** 0.052 0.407*** 0.0558* 0.309*** -0.0781 (0.0316) (0.0271) (0.0514) (0.0409) (0.0392) (0.0314) (0.0519) (0.0446)
N 6,032 6,032 4,685 4,685 6,032 6,032 4,474 4,474 R-squared 0.040 0.007 0.038 0.003 0.029 0.001 0.031 0.00
Panel B. 8th grade
Standards 0.527*** 0.151*** 0.429*** 0.000 0.457*** 0.0974*** 0.348*** -0.003 (0.0275) (0.0211) (0.0407) (0.0320) (0.0294) (0.0212) (0.0437) (0.0293)
N 11,275 11,275 9,235 9,235 11,275 11,275 8,750 8,750 R-squared 0.045 0.005 0.043 0.000 0.032 0.002 0.028 0.00
Panel C. 11thgrade
Standards 0.396*** 0.0498 0.309*** -0.052 0.450*** 0.159*** 0.295*** 0.152** (0.0635) (0.0545) (0.0750) (0.0706) (0.0594) (0.0453) (0.0804) (0.0692)
N 1,121 1,121 1,024 1,024 1,121 1,121 1,015 1,015 R-squared 0.033 0.001 0.029 0.00 0.062 0.011 0.044 0.012
Student FE yes yes yes yes
Note: Standard-errors are clustered at teacher level. *** significant at 1%.
speciĄcation that controls for both sorting and endogeneity estimates are inconclusive at the 5% signiĄcance level.
9 Conclusion
In this study we have proposed the use a of new method for measuring teacher grading patterns based on the IRT framework, which is widely used in test theory but to our best knowledge has not yet been applied to teacher grading. We argue that this method allows for a more interpretable measurement of grading patterns.
Comparing our estimates of teacher grading patterns with standards published by São Paulo state-level education authority, we Ąnd that the median teacher tends to reward students who are graded at the highest category of the Saresp scale (excellent)
with the highest possible classroom mark (10). This matching in scales on the higher end of the ability scope is reassuring, especially when we take into account that teachers do not observe studentŠs Saresp scores. This matching is not replicated, however, in the lower end of the ability scope. We Ąnd that the median teacher has a high probability of assigning passing grade scores for students below the lowest category in the Saresp scale (below basic).
We simulate a policy in which the Saresp scores is used as the passing grade criterion, setting unique grading standards for each grade and subject that would substitute the current teacher-deĄned grading. The estimated efects of the policy are fairly high, suggesting an increase in mean scores that ranges from .28 to .99 standard deviations across the grades and subjects analyzed. Our optimal diiculty parameters (�) are signiĄcantly
above the parameters estimated for the median teacher, which implies that retention rates would be increased under the new policy.
48
Bibliography
ANDRADE, D. F. de; TAVARES, H. R.; VALLE, R. da C. Teoria da resposta ao item: conceitos e aplicações. ABE, Sao Paulo, 2000.
ARROW, K. J. Models of job discrimination. Racial discrimination in economic life,
Lexington, Mass.: Lexington Books, v. 83, 1972.
AZMAT, G.; IRIBERRI, N. The importance of relative performance feedback information: Evidence from a natural experiment using high school students. Journal of Public Economics, Elsevier, v. 94, n. 7, p. 435Ű452, 2010.
BAKER, F. B. Item response theory: Parameter estimation techniques. Marcel Dekker New York, 1992.
BAKER, F. B.; KIM, S. Item response theory: Parameter estimation techniques. [S.l.]:
CRC Press, 2004.
BANDIERA, O.; LARCINESE, V.; RASUL, I. Blissful ignorance? a natural experiment on the efect of feedback on studentsŠ performance. Labour Economics, Elsevier, v. 34, p.
13Ű25, 2015.
BECKER, G. S. The economics of discrimination. [S.l.]: University of Chicago press,
2010.
BETTINGER, E.; LONG, B. T. Do college instructors matter? The effects of adjuncts and graduate assistants on students’ interests and success. [S.l.], 2004.
BETTINGER, E.; LONG, B. T. Do faculty serve as role models? the impact of instructor gender on female students. American Economic Review, JSTOR, p. 152Ű157, 2005.
BETTINGER, E.; LONG, B. T. Does cheaper mean better? the impact of using adjunct instructors on student outcomes. The Review of Economics and Statistics, MIT Press,
v. 92, n. 3, p. 598Ű613, 2010.
BETTS, J. R. Do grading standards afect the incentive to learn? UCSD Economics Discussion Paper 97-22, 1997.
BETTS, J. R.; GROGGER, J. The impact of grading standards on student achievement, educational attainment, and entry-level earnings. Economics of Education Review, Elsevier, v. 22, n. 4, p. 343Ű352, 2003.
BOCK, R. D.; AITKIN, M. Marginal maximum likelihood estimation of item parameters: Application of an em algorithm.Psychometrika, Springer, v. 46, n. 4, p. 443Ű459, 1981. BOTELHO, F.; MADEIRA, R.; RANGEL, M. Discrimination goes to school? racial diferences in performance assessments by teachers. Unpublished Manuscript. Department of Economics, University of Sao Paulo, 2010.
50
CHETTY, R.; FRIEDMAN, J. N.; ROCKOFF, J. E. The long-term impacts of teachers: Teacher value-added and student outcomes in adulthood. nber working paper no. 17699.
National Bureau of Economic Research, ERIC, 2011.
DARLING-HAMMOND, L. Teacher quality and student achievement. Education policy analysis archives, v. 8, p. 1, 2000.
FIGLIO, D. N.; LUCAS, M. E. Do high grading standards afect student performance?
Journal of Public Economics, Elsevier, v. 88, n. 9, p. 1815Ű1834, 2004.
GROSSMAN, P. et al. Measure for measure: The relationship between measures of instructional practice in middle school English language arts and teachers’ value-added scores. [S.l.], 2010.
HANNA, R. N.; LINDEN, L. L. Discrimination in grading. American Economic Journal: Economic Policy, American Economic Association, v. 4, n. 4, p. 146Ű168, 2012.
HANUSHEK, E. A.; RIVKIN, S. G. Teacher quality. Handbook of the Economics of Education, Elsevier, v. 2, p. 1051Ű1078, 2006.
HAZ, V. A. P. Essays on the economics of education. 2012.
KANE, T. J.; STAIGER, D. O. Estimating teacher impacts on student achievement: An experimental evaluation. [S.l.], 2008.
KLEIN, R. Utilização da teoria de resposta ao item no sistema nacional de avaliação da educação básica (saeb). Revista Meta: Avaliação, v. 1, n. 2, p. 125Ű140, 2009.
KLUEGER, A. N.; DENISI, A. Efects of feedback intervention on performance: A historical review, a meta-analysis, and a preliminary feedback intervention theory.
Psychological Bulletin, v. 119, n. 2, p. 254Ű284, 1996.
PHELPS, E. S. The statistical theory of racism and sexism. The American Economic Review, JSTOR, p. 659Ű661, 1972.
RANGEL, M. Is parental love colorblind? human capital accumulation within mixed families. The Review of Black Political Economy, Springer, v. 42, n. 1-2, p. 57Ű86, 2015.
SCHILLING, S.; BOCK, R. D. High-dimensional maximum marginal likelihood item factor analysis by adaptive quadrature. psychometrika, Springer, v. 70, n. 3, p. 533Ű555,
2005.
SOARES, T. M. InĆuência do professor e do ambiente em sala de aula sobre a proĄciência alcançada pelos alunos avaliados no simave-2002. Estudos em Avaliação Educacional, n. 28, p. 103Ű124, 2013.
SPERLING, M.; FREEDMAN, S. W. Research on writing. Handbook of Research on Teaching, v. 4, p. 370Ű389, 2001.
THORNDIKE, E. L. Human learning. The Century Co, 1931.
WIRTH, R. J.; EDWARDS, M. C. Item factor analysis: current approaches and future directions. Psychological methods, American Psychological Association, v. 12, n. 1, p. 58,
Appendix A
Table 8 Ű ProĄciency level classiĄcation on Saresp scale
Panel A. Proficiency Level Thresholds
Language Math
Proficiency
Level 6
th grade 8th grade 11th grade 6th grade 8thgrade 11th grade
Below basic <175 <200 <250 <200 <225 <275
Basic 175 to <225 200 to <275 250 to <300 200 to <250 225 to <300 275 to <350
Adequate 225 to <275 275 to <325 300 to <375 250 to <300 300 to <350 350 to <400
Advanced ≥275 ≥325 ≥375 ≥300 ≥350 ≥400
Panel B. Description of Proficiency Levels
Classification Proficiency
Level Description
Insuicient Below basic Students demonstrate insuĄcient proĄciency on content, competenciesand abilities desirable for their current grade/year.
Suicient Basic
Students demonstrate minimal proĄciency of content, competencies and abilities, but have the structures required to interact with the curriculum of the subsequent grade/year.
Adequate Students demonstrate full proĄciency of content, competencies andabilities desirable for their current grade/year.