FUNDAÇÃO GETULIO VARGAS
ESCOLA DE ADMINISTRAÇÃO DE EMPRESAS DE SÃO PAULO
BENY SCHINAZI
IN CASH WE TRUST:
Cash Holdings in the Brazilian Equity Fund Industry
IN CASH WE TRUST:
Cash Holdings in theBrazilian Equity Fund Industry
Dissertação apresentado à Escola de Administração de Empresas de São Paulo, da Fundação Getulio Vargas, como requisito parcial para obtenção do título de Mestre em Administração Empresas.
Campo de conhecimento: Finanças
Schinazi, Beny
In Cash We Trust: Cash Holdings in the Brazilian Equity Fund Industry / Beny Schinazi. - 2015
37 f.
Orientador: João Amaro Matos
Dissertação (MPA) - Escola de Administração de Empresas de São Paulo.
1. Mercado financeiro. 2. Fundos de investimento. 3. Investimentos. 4. Ações (Finanças). I. Matos, João Amaro. II. Dissertação (MPA) - Escola de Administração de Empresas de São Paulo. III. Título.
IN CASH WE TRUST:
Cash Holdings in the Brazilian Equity Fund Industry
Projeto de dissertação apresentado à Escola de Administração de Empresas de São Paulo, da Fundação Getulio Vargas, como requisito parcial para obtenção do título de Mestre em Administração Empresas.
Campo de conhecimento: Finanças
Data da aprovação:
18 / 11 / 2015
Banca examinadora:
_____________________________
Prof. Dr. João Amaro Matos FGV-EAESP
_____________________________
Prof. Dr. Antonio Gledson de Carvalho FGV-EAESP
_____________________________
ACKNOWLEDGMENT
Foremost, I would like to express my sincere gratitude to my advisor Dr. João Amaro Mattos for his unwavering support throughout the writing of this thesis. I would also like to thank my professors and fellow colleagues at FGV for the stimulating discussions we have had in the last two years.
To all my friends at Pragma Patrimônio, thank you, for your patience, insightful comments and encouragement.
níveis de retorno ajustado (não explicado por fatores de risco a que estão expostos) entre gestores de renda variável. Para isto, exploramos a indústria de fundos de ações não indexados no Brasil no período entre janeiro de 2006 e fevereiro de 2015, avaliando a capacidade de alocação de caixa pela observação do seu nível e variação, utilizando tanto abordagens baseadas em retorno quanto abordagens baseadas em carteiras para explorar um banco de dados mensal de ativos e retornos. Concluímos que habilidades de market timing (tempo de mercado) são raras na indústria, mas a flexibilidade para manter níveis elevados de caixa desempenhou um papel importante para os gestores com altos níveis de retorno
ajustado.
ABSTRACT
We study cash allocation ability as a possible explanatory factor that allows equity fund managers to produce high levels of adjusted returns (not explained by the risk factors they are exposed to). In order to do so, we explore the non-indexed Brazilian equity fund industry during the period of January 2006 to February 2015, evaluating cash allocation ability by level and effectiveness of cash deployment using return-based and holding-based approaches to explore a database of monthly invested assets and returns. We found that even though market timing is a rare skill in the industry, the flexibility to hold high levels of cash played a significant role in the result of over performing managers.
Keywords:
AUM – Assets under Management BACEN – Brazilian Central Bank BDRs - Brazilian Depositary Receipts BOVESPA – São Paulo Stock Exchange CDI - Interbank Deposit Rate
CETIP – Largest Brazilian Custody and Settlement Chamber CVM – Brazilian Securities and Exchanges Commission ETF - Exchange Traded Funds
IBGE - Brazilian Institute of Geography and Statistics
SUMMARY
1 INTRODUCTION ... 6
2 LITERATURE REVIEW ... 9
2.1 Performance Evaluation ... 9
2.1.1 Risk Factor Models ... 10
2.2 Abnormal Returns ... 11
2.2.1 The Brazilian Experience ... 12
2.2.2 Cash as an Strategy ... 12
3 METHODOLOGY ... 14
3.1 Return – Based Method ... 14
3.2 Holding Based Approach ... 15
3.3 Mixed Approach ... 15
3.3.1 Cash Holdings and Future Fund Performance ... 16
3.3.2 Cash Holdings and Excess Return ... 16
4 DATA ... 18
4.1 Equity Fund Data ... 18
4.2 Holding Classification ... 19
4.3 Risk Factor Data and Benchmark ... 19
5 RESULTS ... 22
5.1 Return Based Method ... 22
5.2 Holdings Based Method ... 23
5.3 Mixed Approach ... 24
1 INTRODUCTION
As the saying goes “cash is king”, for Brazilian Equity fund managers, this seems to be especially true. This project analyzes the role and effectiveness of cash management as a resource to differentiate manager’s performance. It aims to contribute to the literature of evaluation of performance of investment managers - exploring as the main research question “Does cash allocations contribute to equity manager’s performance?”
The research question is going to be discussed using a comprehensive database of equity fund’s monthly returns and holdings from January 2006 to February 2015. Different methods are employed in order to explore the hypothesis derived from this research question: H1: “Equity managers exhibit market timing abilities in shifting form equity to cash” (using return based and holding based approaches), H2: “Managers carry high excess cash in anticipation of future investment opportunities” and H3: “Managers with superior skills employ more cash than underperformers” (using a mixed approach).
We believe the Brazilian fund industry is a particularly interesting setting for analysis: large number of asset managers, a mandatory high level of transparency (monthly disclosure of allocations is mandatory for all funds) and a challenging long period for equity fund managers (e.g. equity benchmark’s underperforming fixed income returns).
The market for investment managers in Brazil has been growing and developing over the past 20 years. According to Brazilian Association of Financial and Capital Market Entities (ANBIMA), over the last 20 years the number of funds has increased from 632 to 14.097 and net assets under management (AUM ) from R$ 171 billion to R$ 2,478 billion (in real terms). From this total, the AUM of dedicated public equity funds represent 8.6%, significantly lower than the world average of 43% (ICI).
7
Figure 1 - Evolution of the Brazilian Active Equity Fund Industry
Source: Quantum Axis and IBGE Note: Funds of Funds, Indexed and restricted funds were excluded.
We presented evidence concerning that the active equity fund industry in Brazil presents persistence in returns but with relatively low levels of risk-adjusted returns and that a higher than expected number of winners and losers can be identified. The main contribution proposed in this work is to shed some light upon the importance of cash allocation and rebalancing on the relative performance of active managers.
The ability to balance the cash portion of portfolios has been described in the American market as a possible explanation for the abnormal performance of top managers (SIMUTIN, 2013). During the period from 2006 to 2014, Brazil presented a unique opportunity to test this hypothesis in an environment where the short-term default-free debt has been significantly higher than the equity market index, respectively 10.8% and 7.8% per year (BACEN). Taking into account this low cash drag environment, the effect tested is expected to be even more significant for the Brazilian industry. If so, being able to correctly identify cash allocation as an ability of outperforming managers could potentially help fund investors and investment consultant to do better evaluations.
9
2 LITERATURE REVIEW
2.1Performance Evaluation
A proper assessment of the ability of fund managers starts with the understatement of the realized returns and risks. This allows, as described by Fama (1970), to (a) determine whether general fund managers are able to explore some special information that allows them to generate abnormal returns, and (b) determine if some funds are better than others at uncovering and exploring such special information.
This exploration of special information is referred by Merton (2008) as forecasting skills, and can be partitioned into two subsets: (a) macro forecasting: forecasts of price movements of the general stock market as a whole and (b) micro forecasting: forecasts of price movements of selected individual stocks.
Macro forecasting can be associated with “market timing”, that is, identifying the right moments where equities (as an asset class) will overperform or underperform other asset classes (e.g. government and corporate bonds). Examples can be found in Treynor and Mazuy (1966) where the authors look for macro forecasting skills in 57 mutual funds and find no evidence of such skill.
Micro forecasting can be related to the research on individual companies aiming to uncover assets mispriced on capital markets. Equity managers use different approaches to microforecast, such as (a) the estimation of under/over evaluation of stock according to the predictions of the Capital Asset Pricing Model (CAPM) developed by Sharpe (1964), Lintner (1965) and Mossin (1966) or (b) the estimation of discount/premium of stock in relation to its intrinsic value, as described by Graham and Dodd (1934):
The essential point (of intrinsic value) is that security analysis does not seek to determine exactly what is the intrinsic value of a given security. It needs only to establish either that the value is adequate …or considerable lower than the market price. For such purposes an indefinite and approximate measure of the intrinsic value may be sufficient (GRAHAM AND DODD, 1934, p. 22):
.
each individual market risk exposure (i.e. beta) is accounted for. The disadvantages of the method are related to the fragilities of CAPM.
According to CAPM, return expectations should be determined only by market risk exposure (beta), with no influence from other security characteristics. Yet, many examples of systematic characteristic premia appear on the literature. One of the early examples of those premia is size, as identified by Banz (1981), it happens, for example in small capitalization companies overperforming large ones. As a response to a number of empirical failures (or premia) documented in CAPM, new models to cope with those findings were developed, of which Risk Factor models is one example.
2.1.1 Risk Factor Models
Studying different empirical failures on the CAPM, Fama and French (1992) concluded that asset pricing models should be multidimensional in risk, also they indicated that two other sources of risk (i.e. undiversifiable risks) should be accounted for: size (SMB - Small minus Big companies), and value (HML - High minus Low book-to-market ratio companies). Furthermore, Fama and French (1993) proposed a model that includes these two risk factors in addition to the market premium (i.e. CAPM’s beta), commonly referred as to Fama-French Three Factor Model. In order to represent the two additional risk dimensions the authors constructed mimicking passive portfolios.
Other two empirical failures described by Jegadeesh and Titman (1993) and Carhart (1997) as persistent are momentum and reversal. Differently from SMB and HML, momentum and reversal are related to trading strategies – such as buying past winner and selling past loser – not security characteristic.
This study is going to employ the Carhart (1997) four-factor model, an extension of the Fama–French three-factor model including a momentum factor, as the excess return measurement methodology.
11
negative) observed is therefore abnormal. For the market efficiency hypothesis to hold, abnormal absolute return should be very low in the aggregate level (e.g. fund industry) nor persistently different from zero in the individual level.
2.2Abnormal Returns
The literature on the aggregate value of the equity fund industry is quite pessimistic about the existence of abnormal returns. After controlling for equity style characteristics the fund industry provides no evidence of any relevant abnormal return; in fact Carhart (1997a) shows that it could be slightly negative. Studies using holding based approaches by Kosowski et al. (2006) arrive to similar conclusions.
One explanation for the lack of evidence on positive abnormal returns is the cost structure (BOGLE, 2014; FAMA; FRENCH, 2010). As William Sharpe (1966) described:
Differences in performance are thus likely to be due to either differences in the ability of management to find incorrectly priced securities or to differences in expense ratios. If the market is very efficient, the funds spending the least should show the best (net) performance. . .all other things being equal a, the smaller a fund’s expense ratio, the better the results obtained by its stockholders” (SHARPE, 1966, p.137)
All this evidence tends to support the idea that, after fees, the equity fund industry underperforms passive strategies, for example, as it happens in/ with vehicles with lower costs. Even though the industry may lack skill in the aggregate level, there are some findings suggesting that (i) a minority of funds present abnormal returns and (ii) managers are skillful in picking their stocks -unfortunately the outcome of this talent does not reach the fund investor due to cost.
One example regarding the fact that managers may exhibit individual talent when picking their stocks is presented by Verbeek and Wang (2013). According to the current SEC disclosure rules, in effect after May 2004, funds are required to disclose their positions quarterly, within a 60 day maximum delay window. The authors demonstrated that simulated copycat funds (e.g. free riders of all costs but transactions fees) that mimicked manager’s portfolio holdings could produce better returns than the vast majority of the fund’s industry.
2.2.1 The Brazilian Experience
Regarding to the skill of Brazilian fund managers, Rochman and Eid (2006) found evidence of abnormal returns in Brazilian active equity managers – using Jensen Alpha - in a comprehensive sample of funds for the period of 2001 to 2006.
More recently, two studies applied the methodology of Fama and French (2010), with some variations, to the local industry. Bahia (2012) found evidence of abnormal returns (return not attributed to luck) in the industry when controlling net and gross returns by CAPM (market beta). Kanai (2013) controlled returns for the three Fama and French risk factors and found that the industry generate excess returns in gross returns but not in net returns and only few individual mangers appear to show persistence in skill.
In regard to holdings profiles, Holloway (2013) demonstrated that there are common stock selection strategies employed by selected active equity managers (i.e. value investor) in Brazil.
2.2.2 Cash as an Strategy
13
study he introduced the concept of excess cash: the amount of cash that cannot be attributed to a set of portfolio characteristics.
Equity portfolios tend to hold cash position for several reasons (YAN, 2006): (i) to meet fund flows (redemptions to be paid or subscriptions not allocated yet) (ii) to meet expense needs (e.g. management fees) (iii) to anticipate future stock downturn (i.e. market timing).
The idea that cash can be used to increase performance in not unimportant. Cash is associated to opportunity cost, since historically the average return on the stock market indexes has far exceeded the average return on cash like instruments (short-term virtually, default-free debt) (MEHRA; PRESCOTT, 1985). Also, holding cash in attempt to macro forecast the market is likely to be futile and costly, since the lack of evidence on market timing skills (TREYNOR; MAZUY, 1966).
Holding high cash balances can indeed impose a significant cost on performance. Wermers (2000) for example, estimated that funds on average hold stocks that outperform the market by 1.3% per year, but their net returns to investors actually underperform one percent. About such a difference, non-stock holdings (i.e. cash) represented a drag fund of 0.7% per year, the remaining 1.6% is due to expenses and transactions costs.
According to Simutin (2013) this cash drag justifies why unskilled managers may prefer to remain with low allocation to cash. However, the author finds evidence that when excess cash is employed by managers with high stock-selection skills, it can be a valuable tool. This could be true because skilled managers may carry high excess cash in anticipation of future investment opportunities or because of gradual implementation of investment position, all of which is expected to have an outcome that will compensate lower cash return.
3 METHODOLOGY
In order to investigate the influence of cash holdings and management skill we have used three different models (a) Return Based Approach (b) Holding Based Approach using the change of proportion of the asset class (c) A mixed model, comparing the generated during the period and the cash level.
3.1Return – Based Method
The Return Based Approach tests if there is indication of timing abilities when choosing between equities and non-equities (cash equivalents). The model is similar Treynor and Mazuy (1966).. For this model we have used the fund`s monthly returns, a broad equity index (IBX) and a risk free return index (CDI, a proxy for cash return).
− = + − +
Where is the return of the fund at time , is the risk free rate, the market return, is an intercept term and the residual term. In the original model other betas (such as government bonds and corporate bonds exposure) are also employed, but those terms are not necessary for this study, given that we want to focus only on the equity and cash (non-equity) relation.
The model assumes that is to be conditional under the anticipated next period return of the equity market. What is to say that managers may adjust their risk exposure (i.e. equity allocation) in anticipation of their market forecast.
= + −
Incorporating this assumption in the first equation will result in:
− = + − + − +
15
The relevant indicators to be accessed by this model are and its significance (p-value).
3.2Holding Based Approach
The Holding Based Approach tests the ability to balance equity and cash using the proportion of what was invested in each of those two classes, similarly to Clare et al. (2015). This methodology tries to stablish if the proportion allocated to equities changes in anticipation of positive return in the market. In order to do so, the model tests if the proportion invested in equities (dependent variable) can be explained by the return on the equity market (independent variable), as such:
∆% = + +
Where is the market return (IBX) at time t+1, is an intercept term and the residual term. is the coefficient that indicates the degree of the ability of a manager to time the correct allocation to equities.
The relevant indicators to be accessed by this model are and its significance (p-value). A positive and significant value for is an indicative that a manager increase (or decrease) his exposures to the equities at a time when the stocks are rising (or falling).
3.3Mixed Approach
The mixed approach, is a two-step approach, in which we use the return information to evaluate the excess return of each fund using the Carhart (1997) four-factor model, and holdings information to compare cash level among funds, using this information to access the influence of cash holdings on performance. First, excess returns are calculated for each fund:
− = + − + + ℎ " # + $ % # +
momentum and , ℎ and $, respectively their sensitivity parameters (coefficients); is the return (i.e. excess return) not explained by the model and the residual term.
For each month, funds were divided into quintiles based on the relative level of cash (i.e. non-equity investments) compared to the other (existing) funds at that month. This information is going to be used for two additional tests: one to verify if managers carrying more cash benefit from it in the subsequent period and the other to test an attribution of excess return based on the average amount of cash.
3.3.1 Cash Holdings and Future Fund Performance
A large allocation to cash could be explained by a manager’s tactical need of flexibility to implement his strategy, something that should impact its future performance. In order to test this influence, we have measured the relation of cash level and returns in the subsequent periods, following a methodological approach similar to Simutin (2013). Using the monthly quintile classification previously calculated, we have constructed five portfolios based on the relative cash allocation (1 to 5), allocating each month , the average return of all the funds classified to a quintile in − & ' to the portfolio with the same quintile label; & ' representing the difference, in months, between portfolio construction and return calculation.
We calculate the excess return for the five portfolios as:
() * +, - − = .+ . − + . + ℎ." # + $.% # + .
() * +, - is the excess return at month of a the excess cash quintile / (for / = 1 … 5) portfolio defined in − & ' . The comparison of . between the five different quintile should indicate if the additional amount of cash (i.e. flexibility) contributes to the average equity manager.
17
In order to further analyze the impact of cash, we have focused on the average cash allocation profile of funds whose excess returns (positive or negative) could not be explained by the risk exposure (i.e. ≠ 0 .
First, we have defined for each fund two binary variables and 5 :
6 1 7 89:+), ≤ < /= ≥ 0
0 ? ℎ@A$ @
5 6 1 7 89:+), ≤ < /= ≤ 0
0 ? ℎ@A$ @
We initially assume that z, the 89:+), celling, is 0.05. As a sensibility analysis we also presented the results for different values of z.
Next, we have ranked all the existing funds on a given month in terms of the percentage of cash holdings owned (in relation to the fund AUM) and categorize the results in quintiles (in relations to the other existing funds at that month). We have continued this process for each month in our analyzed period. Finally for each fund we have calculated the frequency of quintile cash allocation (% 1 to % 5). For example, for quintile 1, we have calculated
% 1 as:
% 1 = E? & /BC @A ?7 C?/ ℎ F & &@ 7?A 7B/= /BC @A ?7 C?/ ℎ $ ℎ 1 &&?D ?/
Finally, we have calculated the average profile of funds with positive and negative , using an equally weighted average of all the funds with significant . For example, we have constructed the indicator % 1 (likewise % 15 for negative ) – representing the relative frequency of positive (negative) belonging to that quintile. The same procedure was repeated for the other quintiles as described below:
G% 1 % 2 % 3 % 4 % 5% 15 % 25 % 35 % 45 % 55K
LM
= G 5 K
L ∗ O% 1 % 2 % 3 % 4 % 5 P L M
4 DATA
We have used several sources for this study in order to construct a database spanning from January 2006 to February 2015 with monthly frequency. This database includes, as follows:
4.1Equity Fund Data
Our equity fund database comprises of 1215 non-index equity funds registered in Brazil’s CVM obtained through Quantum Axis Software. One important characteristic of this group is that in order to maintain the tributary equity denomination (equity funds have tax benefits) equity holdings should not be lower than 67%.
19
4.2Holding Classification
We have used basically two classification labels for this study. “Equities” and “Cash”. This classification is not exhaustive, but is sufficient for the purposes of this study.
One of the main challenges was the fact that despite our exclusion of funds classified as FoF, we have encountered many instances in which other funds were invested.
For the “Equities”, we have included all the equity like assets (Ordinary, Preferential, Units, ETF) in the local market and abroad (BDRs or Offshore Equity), equity derivatives (options and futures) as well as Equity Funds.
For “Cash”, we have included Private and Public Bonds. We have also included Fixed Income, Money Market and Multimarket funds in this category. Even though Multimarket funds are not properly “cash” equivalent, there is no directional equity exposure (as opposed to Equity funds). We included an adjustment considering the allocation to Multimarket funds as Cash.
4.3Risk Factor Data and Benchmark
The Market Factor − , SMB, HML and WML risk factors were calculated by the Center for Research in Financial Economics (NEFIN). The detailed explanation of the computation for the Brazilian factors is available on their webpage.
The authors replicated Fama and French (1993) and Carhart (1997) methodology with a few adjustments for the Brazilian market, such as (i) a filter for liquidity, excluding each year stocks, presents less than 80% of the days in year t-1 and with daily volume inferior to R$ 500.000,00, and (ii) in case of multiple classes (such as Ordinary ON and Preferential PN), the stock considered is the most traded stock of the firm and the capitalization of company is considered as the weighted sum of the representativeness of each class.
During this period, the four premia presented a positive mean (mean of all the presented periods). Market Factor Risk (mean of 4.1%), HML (5.6%), SMB (1.4%) and WML (10.7%).
Figure 2 - Market Factor Risk −
Note: The Market Factor is the difference between the value-weighted daily return of the market portfolio and the daily free rate. The daily risk-free rate is computed from the 30-day DI Swap. Data Source: Nefin
Figure 3: Value Risk Premium (HML)
Note: The High Minus Low Factor (HML) is the return of a portfolio long on stocks with high book-to-market ratio and short on stocks with low book-to-market ratio. Data Source: Nefin
21
Note: The Small Minus Big Factor (SMB) is the return of a portfolio long on stocks with low market capitalization (small) and short on stocks with high market capitalization (big). Data Source: Nefin
Note: The Winners Minus Losers Factor (WML) is the return of a portfolio long on stocks with high past returns and short on stocks with low past returns. Data Source: Nefin
5 RESULTS
In this section we are going to demonstrate the results of the models delineated in the Methodology using our database introduced in our Data, presenting the findings for both the full dataset (including funds with at least 8 months of return) and the long dataset (only funds present throughout the full period of Jan 2006 to Feb 2015). Unless otherwise indicated we use a 5% significance level on all tests.
5.1 Return Based Method
In Table 1 we present the main empirical findings for the Return Based Approach. When we use the full dataset, 2 or the coefficient for timing ability, has an average value of -.52, indicating that managers, on average, destroy value trying to time the market. The same conclusion holds if we consider for the long dataset, an average value of -.32. Both means are negative with a p-value lower than 0.01.
On the individual fund level, only 3.5% of funds present a positive and significant
2 (at least 5% were expected) whereas 9.5% exhibit a significant negative coefficient. For the long dataset, we have found a greater number of statistically significant funds (indicating a distribution with fatter tails), 9.4% (positive) and 15.1% (negative).
23
Table 1- Return Based Approach
Note: the first two rows present the cross-sectional average and standard deviation of the coefficients. The other rows represent, respectively, proportion of positive coefficients, proportion of positive and significant (p-value < 0.05) coefficients, proportion of negative coefficients, proportion of negative and significant (p-value < 0.05) coefficients. Results from international comparison (Multi Asset Class Mutual Funds) were calculated by Clare et al. (2015).
5.2 Holdings Based Method
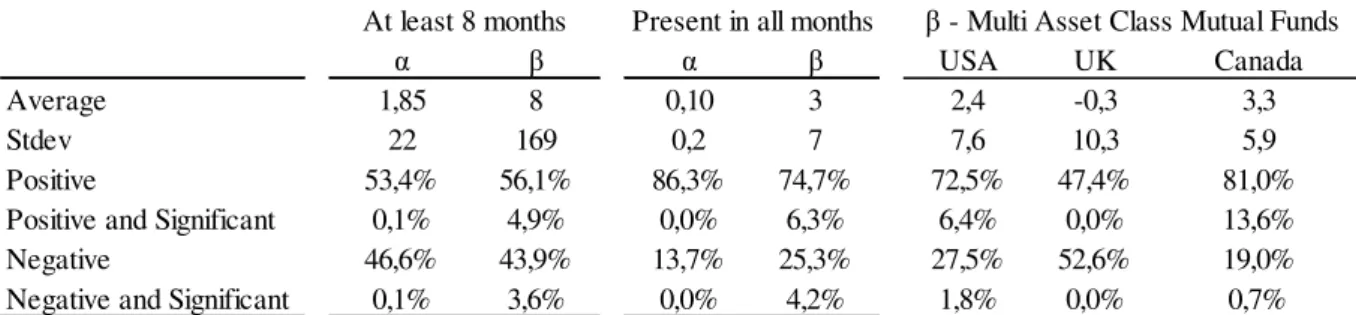
The results for the Holding Based Approach are presented in Table 2. For the full dataset the average value is positive 8 (3 for the long dataset), but with a very high standard deviation (169). This high volatility might be explained by the presence of funds with very low cash holdings (smaller shifts in cash represent great percentages shifts in cash holdings). Despite the positive coefficient, in the full dataset less than 5% of managers display a significant ability (or disability) to correctly increase (or decrease) exposures in anticipation to a stocks market rise (or fall). The long dataset present a more optimistic picture with 6.3% positive and significant funds.
We again compare it with international Multi Asset Class Funds. Timing skills, measured as , are present in USA and Canada (2.4 and 3.3 average value) with a significantly high percentage of funds (6.4% and 13.6%) exhibiting this skill.
α θ1 θ2 α θ1 θ2 USA UK Canada
Average 0.00 0.76 -0.52 0.00 0.91 -0.32 0.00 0.00 0.00
Stdev 0.02 0.35 2.94 0.13 0.31 0.27 0.00 0.00 0.00
Positive 56.4% 98.0% 36.4% 48.1% 100.0% 39.6% 41.3% 12.7% 41.6% Positive and Significant 18.5% 92.3% 3.5% 19.8% 100.0% 9.4% 1.7% 0.0% 3.9% Negative 43.6% 2.0% 63.6% 51.9% 0.0% 60.4% 58.7% 87.3% 58.4% Negative and Significant 7.6% 0.2% 9.5% 17.0% 0.0% 15.1% 1.4% 16.3% 5.6%
Table 2 - Holding Based Approach
Note: the first two rows present the cross-sectional average and standard deviation of the coefficients. The other rows represent, respectively, proportion of positive coefficients, proportion of positive and significant (p-value < 0.05) coefficients, proportion of negative coefficients, proportion of negative and significant (p-value < 0.05) coefficients. Results from international comparison (multi asset class mutual funds) were calculated by Clare et al. (2015).
Taken together, the Return and the Holding based approach, present little evidence of market timing skills, which doesn’t corroborates with Hypothesis H1.
5.3 Mixed Approach
The results of the risk factor regressions are presented in Table 3. For all datasets: market beta, size beta and momentum, it appear to be positive and significant for many funds. On the other hand, value beta has a negative average value, but statistically significantly present in more than 5% of funds, in both of them with positive and negative values for the two datasets. For α, the average value appear to be very close to zero for both data sets, but with
a significant number of funds exhibiting an excess return that could not be attributed to (un) luck. We have found above 5% statistically significant abnormal returns (both in the long and full dataset) for positive and negative α. We also found that Bmkt and Bsmb are the most
relevant risk factors, followed by Bwml. In the full dataset Bhml is found predominately with a negative coefficient (for the long dataset we found evidence of positive and negative coefficients).
α β α β USA UK Canada
Average 1,85 8 0,10 3 2,4 -0,3 3,3
Stdev 22 169 0,2 7 7,6 10,3 5,9
Positive 53,4% 56,1% 86,3% 74,7% 72,5% 47,4% 81,0%
Positive and Significant 0,1% 4,9% 0,0% 6,3% 6,4% 0,0% 13,6%
Negative 46,6% 43,9% 13,7% 25,3% 27,5% 52,6% 19,0%
Negative and Significant 0,1% 3,6% 0,0% 4,2% 1,8% 0,0% 0,7% β - Multi Asset Class Mutual Funds Present in all months
25
Table 3 - Abnormal Returns
Note: the first two rows present the cross-sectional average and standard deviation of the coefficients. The other rows represent, respectively, proportion of positive coefficients, proportion of positive and significant (p-value < 0.05) coefficients, proportion of negative coefficients, proportion of negative and significant (p-value < 0.05) coefficients. Bmkt, Bsmb, Bhml and Bwml represent respectively the beta coefficients for Excess Market Return, SMB, HML and WML
In order to evaluate the effect of our choices of minimal number of monthly return required and level of significance necessary on the proportion of significant α, we present, in Table 4, a sensitivity analysis of the impact of changing the main parameters. The same conclusions hold even with more rigid parameters.
Table 4 - Sensitivity Analysis of Parameters
Note: the first column present the minimal number of months filter (110 represent the full dataset) and the first row different significance thresholds. The other rows represent the proportion of statistically significant positive (left) and negative (right) αs coefficients for the different parameters (months filter and required significance)
Next we accessed the cash holdings of each fund, allocating into monthly quartiles. The most noticeable feature is an increase in average cash holdings (in all quartiles) after 2011. Figure 6 presents the evolution of cash holdings in each quartile.
α Bmkt Bsmb Bhml BWML α Bmkt Bsmb Bhml BWML
Average 0.00 0.82 0.20 -0.02 0.03 0.00 0.93 0.18 -0.01 0.04
Stdev 0.01 0.27 0.37 0.34 0.25 0.00 0.16 0.18 0.14 0.04
Positive 39.2% 98.7% 89.4% 39.9% 71.2% 38.1% 100.0% 92.8% 49.5% 92.8% Positive and Significant 7.7% 94.4% 47.0% 5.9% 9.6% 8.2% 100.0% 63.9% 12.4% 23.7% Negative 60.8% 1.3% 10.6% 60.1% 28.8% 61.9% 0.0% 7.2% 50.5% 7.2% Negative and Significant 12.9% 0.0% 0.6% 12.9% 0.7% 22.7% 0.0% 1.0% 15.5% 0.0%
At least 8 months Present in all months
# of months 0.01 0.025 0.05 0.1 0.01 0.025 0.05 0.1 8 4.3% 6.2% 7.7% 11.7% 6.2% 8.4% 12.9% 17.8% 12 4.4% 6.1% 7.4% 11.6% 6.4% 8.5% 13.2% 18.3% 24 5.0% 6.7% 8.0% 12.2% 7.1% 8.7% 13.4% 18.4% 36 5.7% 7.6% 8.8% 13.1% 7.7% 9.6% 15.1% 19.8% 48 5.6% 7.4% 8.9% 13.0% 8.7% 10.6% 16.2% 20.7% 60 5.8% 7.9% 9.4% 13.4% 9.4% 11.3% 17.3% 21.0% 72 5.7% 7.4% 9.4% 13.1% 9.8% 11.8% 17.8% 22.2% 84 3.9% 5.3% 7.8% 13.1% 11.2% 13.1% 20.4% 23.8% 96 4.3% 5.7% 7.8% 12.1% 12.1% 13.5% 21.3% 23.4% 110 4.1% 6.2% 8.2% 11.3% 14.4% 16.5% 22.7% 25.8%
Adjusting the monthly holdings dataset we have encountered instances when an Equity fund invested in a Multimarket fund. Since the impact seems to be small (high correlation in all quartiles and similar average and standard deviation), we have opted for the cleaner database (without Multimarket funds). Table 5 presents the impact on the dataset.
Table 5 - Multimarket fund impact on Cash Holdings database
Figure 6 - Cash Holdings Historical Evolution (excluding Multimarket funds)
Note: Quintiles are calculated monthly, considering all existing funds at the time. Only lower end of quintile is shown.
In Table 6, we present the findings for the five portfolios. We have found statistical significance of α only in the 1st and 5th Quintile (negative for the first, positive for
the second), the conclusion for these two series is that having the additional amount of cash holdings was rewarding.
Table 6 - Cash Holdings and Future Fund Performance
Note: The first column represents the portfolios constructed (ex-ante) with each cash Quintile. The other columns represent the average coefficient value (and p-value in parenthesis) for respectively α, Excess Market Return, SMB, HML and WML The last column represent the of the regression.
2nd 3rd 4th 5th Med with MM funds
Average 1,8% 4,2% 8,5% 17,1% 6,1% Stdev 0,4% 1,1% 2,2% 3,7% 1,6% without MM funds
Average 1,8% 4,2% 8,4% 16,8% 5,9% Stdev 0,4% 1,1% 2,1% 3,8% 1,6%
Correlation 99,6% 99,8% 99,8% 99,6% 99,8% Quintile
α Bmkt Bsmb Bhml Bwml R²
27
Table 7 presents the result of α for different lags of portfolio construction. The
only significant positive α is verified for one month lag for the portfolio with the 5th Quintile
(largest amount of cash). On the other hand, significant negative α is verified for various
lags for the portfolios with 1st and 1nd Quintile.
In respect to Hypothesis H2, we only have found evidence of cash being a valid mechanism for anticipation of future investment opportunities for very high cash allocations (5th Quintile) with fast deployment (1 month lag).
Table 7 - Future Fund Performance for different Lags
Note: The first column present the lag between quartile portfolio formation and performance. The other rows represent the α across the five quintiles portfolios. Significance in the α coefficient (with p-value < 0.05) is represented by “*”.
Finally, in Table 8, we present the distribution of significant α across the five
quintiles. There is a monotonic increase in the number of significant positive α with the cash
allocation quintile. For negative α, lower cash quintiles present a higher percentage of results,
but the difference in quintile results are smaller than for positive α.
Table 9 present a sensitivity analysis of this findings, showing the robustness of our conclusions.
Lag
# of months 1 2 3 4 5
1 -0.002* -0.001 -0.001 -0.001 0.002* 2 -0.002* -0.001 -0.001 -0.001 -0.001 3 -0.001 -0.001 -0.001 -0.001 -0.001 4 -0.001 -0.001 -0.001 -0.001 -0.001 5 -0.001 -0.001 -0.001 -0.001 -0.001 6 -0.001 -0.001 -0.001 -0.001 -0.001 7 -0.002* -0.002* -0.001 -0.001 -0.001 8 -0.002* -0.001 -0.001 -0.001 -0.001 9 -0.003* -0.002* -0.001 -0.001 -0.001 10 -0.003* -0.001 -0.001 -0.001 -0.001 11 -0.002* -0.002* -0.001 -0.001 -0.001 12 -0.002* -0.002* -0.001 -0.001 -0.001
Table 8 - Quintile distribution of Significant α
Note: Each row represent the proportion of positive/ negative and significant (p-value < 0.05) α attributed to a particular cash allocation Quintile. The last row represent the difference Quintile 5 (high cash allocation) and Quintile 1 (low cash allocation).
Table 9 - (Quintile 5 – Quintile 1) Sensitivity Analysis of Parameters
Note: the first column present the minimal number of months filter (110 represent the full dataset) and the first row different significance thresholds. The other rows represent the difference in the proportion of positive/ negative and significant α attributed to Quintile 5 (high cash allocation) and Quintile 1 (low cash allocation).
The difference in the proportion of funds’ performance between Quintile 5 and Quintile 1 is supportive of Hypothesis H3, managers with superior returns (positive and significant α) have in general a high amount of cash holdings.
Negative Positive Negative Positive Quintile 1 24% 7% 26% 9% Quintile 2 21% 11% 27% 17% Quintile 3 20% 17% 21% 17% Quintile 4 18% 27% 15% 26% Quintile 5 17% 38% 11% 32% Q5 -Q1 -7% 31% -15% 23%
At least 8 months Present in all months
# of months 0.01 0.025 0.05 0.1 0.01 0.025 0.05 0.1 8 45.7% 35.5% 30.7% 25.9% -18.8% -11.0% -7.5% -5.7% 12 45.7% 39.2% 34.6% 28.1% -18.8% -11.1% -7.5% -5.7% 24 47.9% 41.5% 35.7% 29.9% -18.5% -13.7% -9.4% -5.4% 36 51.8% 41.7% 36.9% 30.9% -21.3% -15.9% -10.9% -8.8% 48 53.1% 42.8% 36.8% 29.8% -22.7% -19.0% -11.9% -10.3% 60 52.5% 41.3% 35.1% 25.5% -27.0% -22.2% -14.3% -13.2% 72 52.3% 40.6% 32.8% 27.1% -24.2% -20.3% -13.1% -12.4% 84 64.5% 48.0% 33.3% 24.9% -24.8% -20.5% -13.4% -14.4% 96 65.9% 47.7% 31.9% 22.2% -30.1% -26.3% -16.5% -18.6% 110 54.5% 34.1% 23.4% 21.8% -25.9% -21.8% -15.2% -18.1%
29
6 CONCLUSION
This study documents the important role cash like assets have on the management of equity funds. This is less related to correctly timing the market and more about the importance of allowing managers the mandate to significantly reduce their equity exposure if necessary.
We have also found excess performing managers (and underperforming) in a higher frequency that was to be expected by pure chance – cash assets played a significant role explaining this evidence. This result appears to be robust for different parameters.
This finding is particularly interesting for equity fund selection. From a purist standpoint, evidence of high non-stock allocation in equity portfolios is a sign of style drift, which is commonly regarded as a departure from a manger’s mandate. This study proposes otherwise, the flexibility to hold large non-equity (i.e. cash) allocation is a valid and necessary tool that managers possessing stock picking skills can employ in order to pursue high risk adjusted returns.
This flexibility comes at cost, as it increases the complexity for clients (i.e. equity fund investors) to monitor and balance their consolidated asset allocation. Clients should be aware that since equity funds are rarely fully allocated, their equity exposure (and therefore their risk exposure) is lower than believed.
This study also contributes to the current body of knowledge regarding the generation of value by active managers. Most studies suggest that there is some level of abnormal performance, before costs, even though only a fraction of fund managers will experience it (FAMA; FRENCH, 2010). When adjusting for different risk factors: WML, SMB, HML and Market Risk, the Brazilian fund industry does not seem to be an exception. We have found that the mean value is very close to zero, in a distribution with fat tails.
In order to perform the necessary regressions, we revisited the above mentioned risk premia in Brazil – we found evidence of positive historical premia levels but those premia have decreased significantly in the recent past (especially for Market Risk and Value). This was a particularly interesting setting to performance the analysis of this study: managers were challenged to deliver results despite a very adverse scenario. One hypothesis for future studies is that high cash allocation flexibility is particularly useful in declining premia settings.
31
REFERENCES
ANBIMA.BRAZILIAN ASSOCIATION OF FINANCIAL AND CAPITAL MARKET
ENTITIES. Available at: <
http://www.anbima.com.br/anuariodefundos/2014/pt/A_Industria_de_fundos/Investimento_no _Brasil/default.aspx >. Accessed at: December. 17 2014.
BACEN.BRAZIL’S CENTRAL BANK. Available at: <
http://www.bcb.gov.br/?SELICACUMUL >. Accessed at: December 17 2014.
ICI.INVESTMENT COMPANY INSTITUTE. Worldwide Mutual Fund Assets and Flows First Quarter. 2014. Available at: < http://www.ini,org/research/stats/worldwide/ww_03_14 >. Accessed at: February 20 2015.
NEFIN - CENTER FOR RESEARCH IN FINANCIAL ECONOMICS. Available at: < http://nefin.com.br/financial_data.html>. Accessed at: 20 . Accessed at: February20 2015
SEC- U.S. SECURITIES AND EXCHANGE COMMISSION. Available at: <https://www.sec.gov/rules/final/33-8393.htm>. Accessed at: October 22 2015
BAHIA, Alexandre. Sorte versus habilidade, uma abordagem através de cross section da indústria de fundos de ações no Brasil. Masters in Economics Thesis presented at EESP-FGV, 2012
BANZ, Rolf . The relationship between return and market value of common stocks, Journal of Financial Economics, v. 70, n. 1, 1981.
BOGLE, John.. The Arithmetic of “All-In” Investment Expenses. Financial Analysts Journal, v. 70, n. 1, 2014.
CARHART, Mark On persistence in mutual fund performance. The Journal of Finance, v. 52, n. 1, 1997.
CHEN, Hsiu-Lang;.; JEGADEESH, Narasimhan; ; WERMERS, Russ.. The Value of Active Mutual Fund Management: An Examination of the Stockholdings and Trades of Fund Managers. The Journal of Financial and Quantitative Analysis, v. 35, n. 3, 2000.
CLARE, Andrew. et al. Multi-asset class mutual funds : Can they time the market ? Evidence
FAMA, Eugene. Efficient Capital Markets : A Review of Theory and Empirical Work. The Journal of Finance, v. 25, n. 2, 1970.
FAMA, Eugene.; FRENCH, Kenneth. The Cross-Section of Expected Stock Returns. Journal of Finance, v. 47, n. 2, 1992.
______.Common risk factors in the returns on stocks and bonds. Journal of Financial Economics, v. 33, n. 1, 1993.
______. Luck versus Skill in the cross-section of mutual fund returns. Journal of Finance, v. 65, n. 5, 2010.
GRAHAM, Benjamin; DODD, David. Security Analysis. New York: McGraw-Hill, 1934
HOLLOWAY, Pedro; ROCHMAN Ricardo; LAES, Marco. Factors Influencing Brazilian Value Investing Portfolios. Journal of Economics, Finance and Administrative Science v.18, n. x, 2013.
JEGADEESH, Narasimhan; TITMAN, Sheridan. Returns to Buying Winners and Selling Losers: Implications for Stock Market Efficiency. The Journal of Finance, v. 48, n. x, 1993.
KANAI, Daniel. Uma Análise de Performance da Gestão Ativa em Fundos de Ações. Masters in Economics Thesis presented at Insper, 2013
KOSOWSKI, Robert. et al. Can mutual fund “stars” really pick stocks? New evidence from a bootstrap analysis. Journal of Finance, v. 61, n. 6, 2006.
LINTNER, John. Security prices, risk, and maximal gains from diversification. Journal of Finance, v. 20, n. 4, 1965.
MEHRA, Rajnish.; PRESCOTT, Edward. The equity premium: A puzzle. Journal of Monetary Economics, v. 15, n. 2, 1985.
33
MOSSIN, Jan. Equilibrium in a capital asset market. Econometrica: Journal of the Econometric Society,Cidade, v. 34, n. 4, 1966.
ROCHMAN, Ricardo.; EID William. Fundos de investimento ativos e passivos no Brasil: comparando e determinando os seus desempenhos. In: Annals of Encontro Nacional da Associação Nacional de Pós-Graduação e Pesquisa em Administração, 2006.
SHARPE, William. Capital Asset Prices: A Theory of Market Equilibrium under Conditions of Risk. The Journal of Finance, v. 19, n. 3, 1964.
______. Mutual Fund Performance. The Journal of Business, v. 39, n. 1, 1966.
SIMUTIN, Mikhail. Cash Holdings and Mutual Fund Performance. Review of Finance, v. 18, n. 4, 2014.
TREYNOR, Jack; MAZUY, Kay. Can mutual funds outguess the market. Harvard Business Review, v. 44, n. 4, 1966.
VERBEEK, Marno; WANG, Yu. Better than the original? The relative success of copycat funds. Journal of Banking & Finance, v. 37, n. 9, 2013.
WERMERS, Russ. Mutual Fund Performance: An Empirical Decomposition into
Stock-Picking Talent, Style, Transactions Costs, and Expenses. The Journal of Finance, v. 55, n. 4,
2000.
YAN, Xuemin. The Determinants and Implications of Mutual Fund Cash Holdings : Theory
and Evidence. Financial Management, v. 35, n. 2, 2006.