Submitted24 February 2016
Accepted 1 April 2016
Published10 May 2016
Corresponding author
Weimin Zhu, [email protected]
Academic editor
Robert VanBuren
Additional Information and Declarations can be found on page 12
DOI10.7717/peerj.1961
Copyright
2016 Yang et al.
Distributed under
Creative Commons CC-BY 4.0
OPEN ACCESS
Heat shock factors in tomatoes:
genome-wide identification, phylogenetic
analysis and expression profiling under
development and heat stress
Xuedong Yang, Weimin Zhu, Hui Zhang, Na Liu and Shoubo Tian
The Protected Horticulture Institute, Shanghai Academy of Agricultural Sciences, Shanghai, China
ABSTRACT
The HSF (heat shock factor) gene family contains highly conserved plant-specific transcription factors that play an important role in plant high-temperature stress responses. The present study aimed to characterize the HSF transcription factor genes in tomato (Solanum lycopersicum), which is an important vegetable crop worldwide and the model plant for fruit development studies. Twenty-six SlyHSF genes were identified in tomato, and the phylogenetic analysis showed the possible evolution profile of subgroups among in the plant kingdom. A new group O was identified that involved HSF genes in primitive plant species, like in the green algae, mosses and lycophytes. The gene structure and motifs of each SlyHSF were comprehensively analyzed. We identified orthologous, co-orthologous and paralogous HSF gene pairs in tomato, Arabidopsis and rice, and constructed a complex interaction network among these genes. The SlyHSF genes were expressed differentially in different species and at a higher level in mature fruits. The qPCR analysis was performed and showed SlyHSF genes greatly participate in plant heat tolerant pathways. Our comprehensive genome-wide analysis provided insights into the HSF gene family of tomatoes.
SubjectsBioinformatics, Genomics, Plant Science
Keywords Genome-wide analysis, HSF, Tomato, Expression profile
INTRODUCTION
Plant HSF genes, first identified from tomato, have been isolated from various species (Aranda et al., 1999;Czarnecka-Verner et al., 1995;Hubel & Schoffl, 1994;Scharf et al., 1990). In contrast to other eukaryotes such asDrosophila melanogaster,Caenorhabditis elegansand yeast with a single HSF gene in the genome, plants possess a large family of HSFs. For example, a previous report identifiedArabidopsisand rice (Oryza sativa) possessed 21 and 25 HSF genes respectively (Guo et al., 2008). Like many other transcription factors, the HSF family has a conserved modular structure containing highly conserved domains (Doring et al., 2000;Treuter et al., 1993). The conserved structure elements include an N-terminal DNA binding domain (DBD), an adjacent domain with heptad hydrophobic repeats (HR-A/B) involved in oligomerization and the nuclear localization signal domain (NLS) (Guo et al., 2008). In addition, some HSFs have a C-terminal activation domain (CTAD) and a nuclear export signal (NES) domain (Kotak et al., 2004). Based on their flexible linkers between the A and B parts of the HR-A/B regions and the sequence regions between the DBD and HR-A/B regions, plant HSFs can be classified into three types (class A, B, and C) (Nover et al., 2001;Nover et al., 1996). HSFs act through a highly conserved heat shock element (HSE) containing motifs in alternating orientations in the promoters (Schoffl, Prandl & Reindl, 1998). Class A HSFs are involved in transcriptional activation and environmental stress responses (Shim et al., 2009), while class B HSFs act as repressors of gene expression (Ikeda, Mitsuda & Ohme-Takagi, 2011;Zhu et al., 2012). Previous research showed that HSFB1 in Arabidopsisacts as a repressor, while in tomato, it functions as a transcription co-activator with class A HSFs (Ikeda, Mitsuda & Ohme-Takagi, 2011; Zhu et al., 2012).
The HSF gene family has been thoroughly characterized in many species, including Arabidopsis, Chinese cabbage, rice, maize,Triticum aestivum, pepper and grasses (Guo et al., 2008;Lin et al., 2011;Nover et al., 2001;Song et al., 2014;Xue et al., 2014; Yang et al., 2014). Although tomato HSFs have been identified and classified (Doring et al., 2000; Heerklotz et al., 2001;Scharf et al., 2012;Scharf et al., 1990), but only the identification was done in that paper. This study is the first comprehensive report of tomato HSFs, the chemical characteristics of the proteins have been obtained, and compared with other organisms. A phylogenetic tree using representative species including green alga, moss, lycophyte, gymnosperm, monocot and eudicots has been constructed in this study, in order to study the HSF classification and evolution across the whole plant kingdom. Furthermore, the expression patterns of all tomato HSF genes in different tissues and after treated in high temperate tress have been characterized. The results of this work provide a foundation to better understand the functional and evolutionary history of the HSF gene family in Solanaceae plants.
MATERIALS AND METHODS
Identification and characteristics of tomato HSF genes
each HSF-coding gene on chromosomes were obtained according to Tomato Genome Annotation ITAG 2.40. Protparam program (http://web.expasy.org/protparam/) was employed to calculate or predict the chemical characteristics of tomato HSF proteins, including the molecular formula of the protein, number of amino acids per protein, molecular weight, estimated theoretical pI, instability index, aliphatic index and GRAVY (Grand Average of Hydropahicity).
Phylogenetic analyses construction
HSF proteins for phylogenetic analyses were gathered from eight plant species. The proteins ofPicea abieswas downloaded fromhttp://congenie.org(Nystedt et al., 2013). The six other species, includingChlamydomonas reinhardtii, Physcomitrella paten, Selaginella moellendorffii, Arabidopsis thaliana,Vitis viniferaandOryza sativa, were downloaded from Phytozome database (v10) (Goodstein et al., 2012). The HSF proteins with their conserved domains were also screened by the HMMER software. Only the longest transcript was used if alternative spliced isoforms existed. After multiple sequence alignment of the HSF domains using ClustalX2 software with default settings, MEGA (version 6.06) was used to construct maximum-parsimony phylogenetic trees with 2,000 bootstrap replicates.
Gene structure and motif analysis
The Gene Structure Display Server tool (http://gsds1.cbi.pku.edu.cn/) was used to analyze the exon-intron structures. The gene structures of tomato HSF were drawn using Photoshop software, including a clustering of all HSF genes in accordance with previously mentioned conserved protein domains. Besides the exon and intron regions, the upstream and downstream UTR regions were also reported to show possible structures of entirely expressed mRNA. Intron phases were classified based on their positions relative to the reading frame of the translated proteins: phase 0 (located between two codons), phase 1 (splitting codons between the first and second nucleotides) or phase 2 (splitting codons between the second and third nucleotides) (Long, Rosenberg & Gilbert, 1995). The software MEME (http://meme.nbcr.net/meme/) (Bailey & Elkan, 1994) was used to search for motifs in all 26 HSF genes; the number of motifs that MEME should find was set to 15 in this study. The length of motifs that MEME searched was in a window of 6 to 50 bp.
Identification of orthologous and paralogous genes
The orthologous, co-orthologous and paralogous genes among tomato,Arabidopsisand rice were searched using OrthoMCL (version 2.0.3) with the entire protein sequence of HSF. The default parameter E-value was 1e−5for BLASTP in all vs all sequences alignment. The
Or-thoMCL software was used to gather the orthologous and paralogous relationships and the result was displayed using the Circos software (http://circos.ca/) (Krzywinski et al., 2009).
HSF gene expression analysis in tomato tissues
The gene expression data was downloaded from the Tomato Funtional Genomics Database (http://ted.bti.cornell.edu/cgi-bin/TFGD/digital/experiment.cgi?ID=D004), including RNA-seq data from leaves, roots, flower buds, fully opened flowers, and 1 cm, 2 cm, 3 cm, mature green, breaker, and breaker+10d fruits of tomato cultivar Heinz 1706, and
Table 1 Genomic characteristics of SlyHSF genes in tomato.
ID Name Chromosome Strand Start Stop No. Gene
bases (bp) No. cDNA bases (bp) No. CDS bases (bp) No. Amino acids (aa)
SlyHSF-01 Solyc11g064990.1 SL2.40ch11 − 47389718 47391840 2,123 756 756 251
SlyHSF-02 Solyc08g005170.2 SL2.40ch08 − 111412 116839 5,428 1,949 1,584 527
SlyHSF-03 Solyc03g026020.2 SL2.40ch03 + 7810489 7812280 1,792 1,594 1,017 338
SlyHSF-04 Solyc03g097120.2 SL2.40ch03 − 52901766 52904929 3,164 1,874 1,476 491
SlyHSF-05 Solyc02g090820.2 SL2.40ch02 − 46880125 46883382 3,258 1,611 906 301
SlyHSF-06 Solyc09g065660.2 SL2.40ch09 + 59473864 59475995 2,132 1,405 1,119 372
SlyHSF-07 Solyc04g078770.2 SL2.40ch04 + 61036586 61037903 1,318 1,230 1,083 360
SlyHSF-08 Solyc06g072750.2 SL2.40ch06 + 41255352 41258348 2,997 1,613 1,449 482
SlyHSF-09 Solyc12g098520.1 SL2.40ch12 + 48549454 48552229 2,776 1,437 1,437 478
SlyHSF-10 Solyc08g080540.2 SL2.40ch08 − 60985869 60987278 1,410 1,329 978 325
SlyHSF-11 Solyc04g016000.2 SL2.40ch04 − 6594909 6598451 3,543 1,320 714 237
SlyHSF-12 Solyc12g007070.1 SL2.40ch11 − 50695058 50703526 8,469 1,110 1,110 369
SlyHSF-13 Solyc09g082670.2 SL2.40ch09 + 63781968 63784228 2,261 1,458 1,071 356
SlyHSF-14 Solyc06g053960.2 SL2.40ch06 − 33333411 33336335 2,925 892 429 142
SlyHSF-15 Solyc08g076590.2 SL2.40ch08 − 57710679 57714096 3,418 1,806 1,473 490
SlyHSF-16 Solyc09g059520.2 SL2.40ch09 − 50372011 50379351 7,341 1,551 1,170 389
SlyHSF-17 Solyc02g072000.2 SL2.40ch02 + 35903150 35904957 1,808 1,712 1,227 408
SlyHSF-18 Solyc08g062960.2 SL2.40ch08 − 49589145 49591151 2,007 1,215 1,056 351
SlyHSF-19 Solyc10g079380.1 SL2.40ch10 − 60125137 60126209 1,073 768 768 255
SlyHSF-20 Solyc03g006000.2 SL2.40ch03 + 678142 679948 1,807 1,693 1,206 401
SlyHSF-21 Solyc07g055710.2 SL2.40ch07 − 60972388 60973952 1,565 1,477 1,167 388
SlyHSF-22 Solyc07g040680.2 SL2.40ch07 + 46702761 46704429 1,669 1,435 1,071 356
SlyHSF-23 Solyc02g078340.2 SL2.40ch02 + 37643661 37646059 2,399 666 618 205
SlyHSF-24 Solyc09g009100.2 SL2.40ch09 − 2445341 2448016 2,676 1,959 1,530 509
SlyHSF-25 Solyc02g079180.1 SL2.40ch02 + 38360060 38365669 5,610 1,245 1,245 414
SlyHSF-26 Solyc02g072060.1 SL2.40ch02 + 35912808 35914648 1,841 1,020 1,020 339
1589 (Tomato Genome, 2012). The SlyHSF gene expression profile from each sample was analyzed via the HemI program (http://hemi.biocuckoo.org/) with the average hierarchical clustering method.
HSF gene expression analysis under heat treatment
Seeds from the tomato cultivar Heinz 1706 were germinated and grown in a greenhouse at 24 ◦
C with a photoperiod of 14 h light and 10 h dark. For the heat stress treatment, uniform-sized seedlings were transferred to a growth chamber at 38 ◦
C when they developed five fully opened leaves. The third leaves of the seedlings were taken after 0, 1, 2, 6, 12 and 24 h of heat stress treatment, frozen immediately in liquid nitrogen, and stored at−80 ◦C until RNA isolation. Total RNA was isolated from tomato leaves using
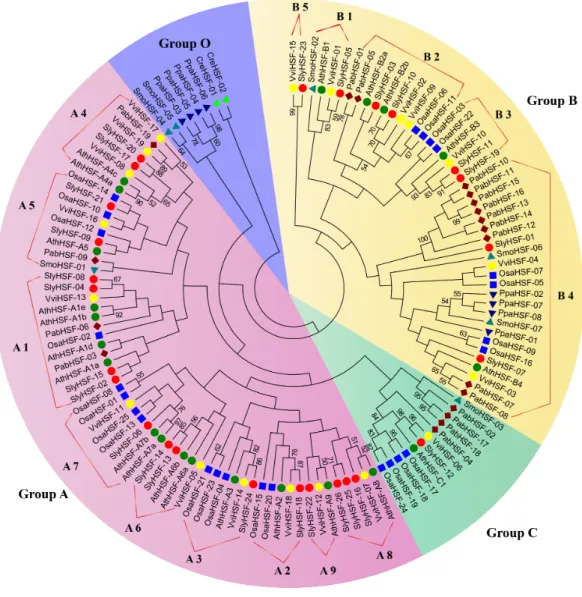
Figure 1 Phylogenetic tree of eight plants constructed based on amino acid sequences of HSF domains using the maximum-parsimony method.The different species can be distinguished by different shapes and colors.
PCR system (Applied Biosystems, Foster City, CA, USA). Each reaction contains 10µL 2×SYBR Premix Ex Taq II Reagent, 1.0µL cDNA sample, and 2µL gene-specific primer
in a final volume of 20µL, 500 nM gene-specific primer in a final volume of 20µL. RNA expression levels relative to the Actin2 (AB199316) gene were calculated according to a previous workflow (Pfaffl, 2001). Three replicates of each cDNA sample were performed for qRT-PCR analysis.
RESULTS AND DISCUSSION
Identification and classification of HSF genes in tomato
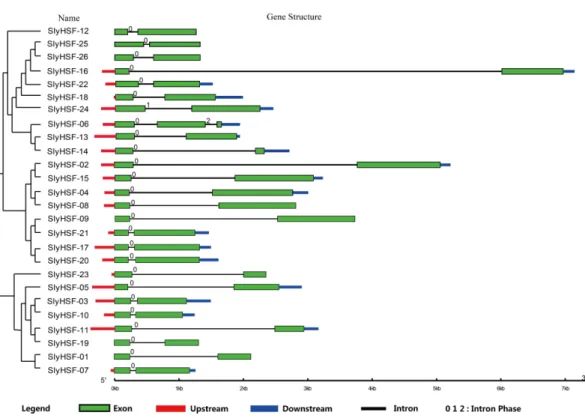
Figure 2 Gene structure of SlyHSF genes. Green boxes indicate the exon regions, while black, red and blue lines indicate introns, upstream and downstream UTR regions, respectively.The lengths of the boxes and lines were scaled based on the length of the genes.
Dataset, these genes were distributed unevenly on tomato chromosomes. Five SlyHSF genes were located on chromosome 2; four on chromosomes 8 and 9; three on chromosome 3; two on chromosomes 4, 6, 7 and 11; one each on chromosomes 11 and 12. The average length of the cDNA (exon+intron,∼1,389 bp) for SlyHSF genes is longer than that of all
tomato and cDNA. The coding sequence sizes for SlyHSF ranged from 429 bp (SlyHSF-14) to 1,584 bp (SlyHSF-02). The average number of amino acids in each SlyHSF was∼366.7
bp, which is comparable to pepper (∼366.2 bp) andArabidopsis thaliana(∼368.0 bp). As
the oldest organism among plant kingdom, there were only two HSF proteins in algae, and both were much longer than found in other organisms. In contrast, the average length of HSF proteins inS. moellendorffiiwas only around 175 bp, which was shorter than other selected organisms.
Physical and chemical characteristics of SlyHSF proteins were analyzed and summarized in Table S2. The molecular weights were from 16.6 kDa to 57.5 kDa. The predicted isoelectric points of SlyHSF were divergent, ranging from 4.68 to 9.66. The instability index of all the proteins fell into a narrow range, from 31.89 to 68.07. The SlyHSF-05 and SlyHSF-14 protein molecule were predicted to be stable while others were unstable. All of the GRAVY scores were lower than 0, indicating that all SlyHSF proteins were hydrophilic.
Phylogenetic relationship of SlyHSF proteins
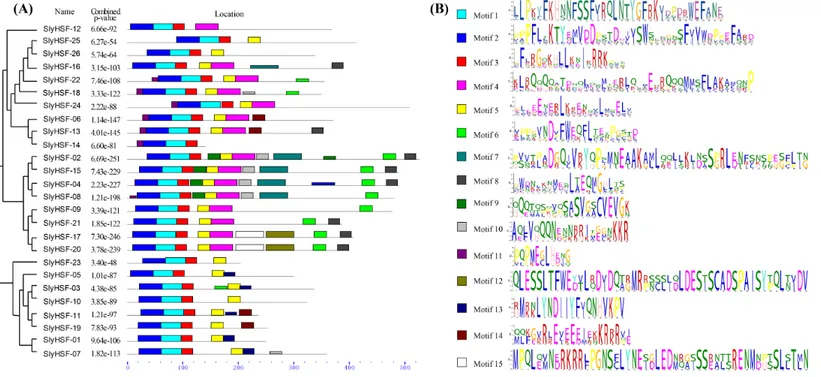
Figure 3 Conserved motifs arrangement in the SlyHSF genes.(A) The phylogenetic tree and motifs located on each gene with relative combined P-values. (B) Amino acid sequences of each motif. The font size represents the frequency of the respective amino acid.
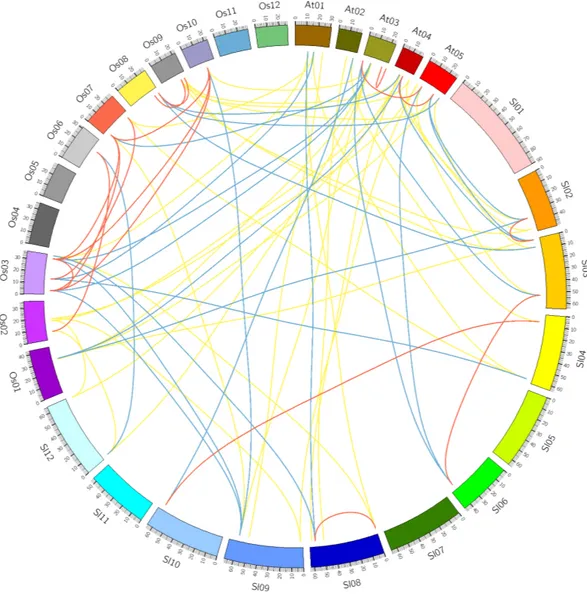
Figure 4 Comparative analysis of synteny of HSF genes in tomato,Arabidopsisand rice.Red, yellow and blue lines indicate paralogous, orthologous and co-orthologous gene pair relationships, respectively.
were used to construct a better phylogenetic tree using the maximum-parsimony method. However, the phylogenic clustering of rice HSF genes was still not entirely consistent with subgroup classification among genome-wide identification studies.
Gene structure and motif analysis
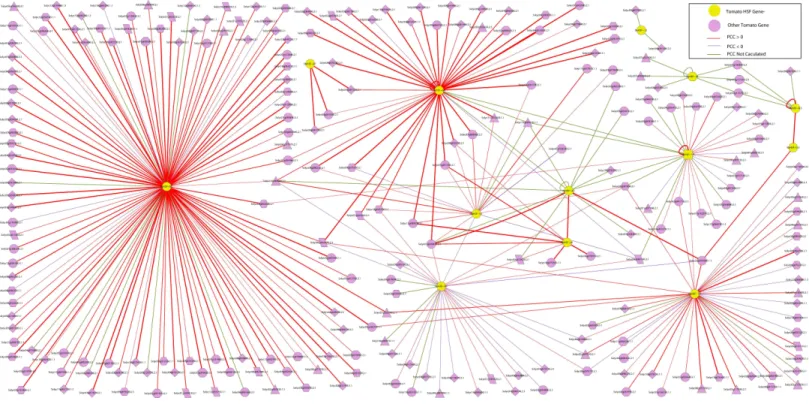
Figure 5 The interaction network of SlyHSF genes according to the networks inArabidopsis.The shape of gene boxes illustrated the location of this gene. The ellipse, hexagon, V, parallelogram, triangle, octagon and diamond represented other tomato genes in plasma, membrane, vac-uole, plastid and peroxisome, cytosol, others and unclear, respectively. Red, purple and green lines indicated that the Pearson correlation coefficient (PCC) index were greater than 0, less than 0 and not calculated respectively. The boldness of the line indicated the PCC value between genes.
We searched for motifs to analyze the conserved features of SlyHSF proteins using MEME (Fig. 3) Motifs 1, 2 and 3 were found in all tomato HSF members, while motif 5 was absent only in SlyHSF12 and SlyHSF14. As a counterpart of SlyHSF13, SlyHSF14 may have gone through a duplication during which the latter half was lost, resulting in shorter coding regions and fewer motifs. The similarity of motifs in subgroup A1 and subgroup A5 showed the close relationship between these two groups.
Identification of orthologous and paralogous HSF genes in plants Comparative analysis was performed to identify the orthologous and paralogous gene pairs. There were three, ten and four in-paralogous HSF gene pairs amongArabidopsis, rice and tomato respectively. The orthologous SlyHSF-AthHSF gene pairs (14 pairs) were identified as twice as SlyHSF-OsaHSF gene pairs (7 pairs), while ten AthHSF-OsaHSF gene pairs were found. Eight co-orthologous gene pairs (SlyHSF-AthHSF and SlyHSF-OsaHSF) were found (Table S4,Fig. 4).
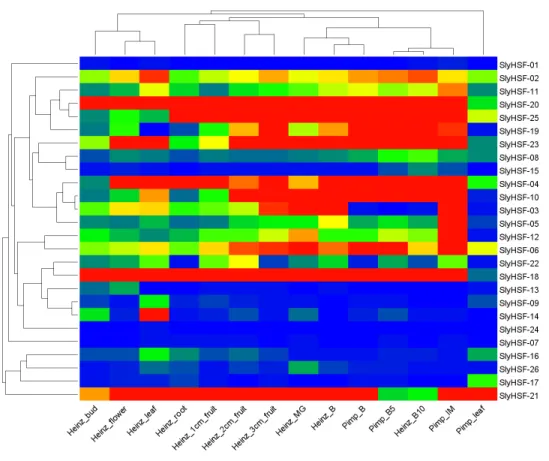
Figure 6 Heat map representation and hierarchical clustering of tomato SlyHSF genes in fourteen samples from root, leaf, bud, flower and fruits in several development stage.Heinz and Pimp represent the cultivated tomato Heinz and related wild speciesSolanum pimpinellifoliumd. IM, B, B5, B10 and M represent immature, breaker, 5 days after breaker, 10 days after breaker and mature fruit.
less than zero, whereas that of 227 gene pairs was more than zero, which revealed SlyHSF proteins mainly have a positive interaction with other proteins in tomato. Fifty-three gene pairs were not included in the calculations, thus many regulation patterns remain unknown.
The interaction network showed that the number of proteins regulated by each SlyHSF gene was significantly different (Fig. 5). For instance, SlyHSF-09 had the most complex interaction network, with 114 proteins, suggesting its importance in transcriptional-level regulation. Furthermore, SlyHSF-02, SlyHSF-04, SlyHSF-06, SlyHSF-16, SlyHSF-17, 18 were found to have more than 10 interaction relationships, while SlyHSF-03, SlyHSF-05, SlyHSF-07, SlyHSF-10 and SlyHSF-12 had between 1 to 10 interaction relationships. Interestingly, the gene pairs including SlyHSF-02/04, SlyHSF-02/18, SlyHSF-02/24, SlyHSF-03/05, SlyHSF-04/18, SlyHSF-06/16 and SlyHSF-17/18 showed that interactions also existed among tomato HSF genes.
Expression pattern of SlyHSF genes in different tissues
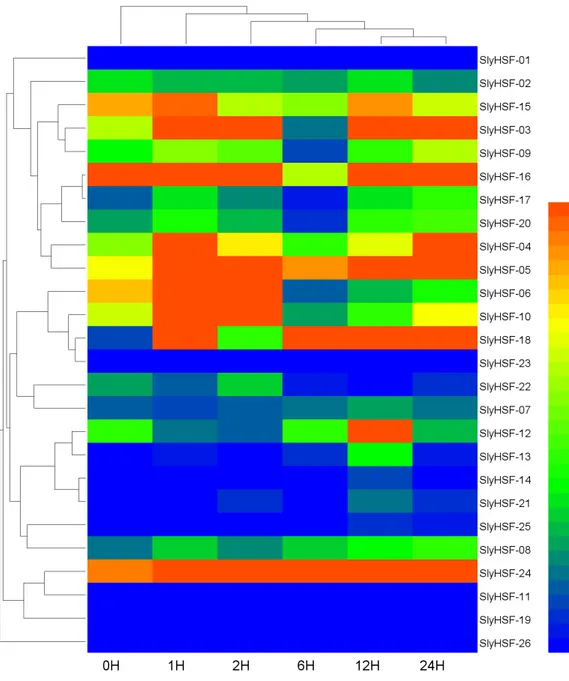
Figure 7 Hierarchical clustering and heat map representation of HSF genes after heat stress treatment. A qPCR experiment was performed to generate these expression profile data. The RNA level is expressed relative to the tomato actin gene expression level as 2−11CT.
HSF genes were enriched in tomato fruit development process. In non-stress conditions, HSFA1a is reported to be repressed by association with HSP90 and HSP70 (Liu, Liao & Charng, 2011), therefore the SlyHSF-15 which share similar domains with AthHSFA1a were found to have lower expression than others.
Expression pattern of SlyHSF genes under heat stress treatment Since HSF genes were found to participate in heat shock related pathways, quantitative real-time PCR analysis was performed to systematically detect HSF gene expression in tomato. The non-conserved regions were used for primer design to ensure the specificity of PCR amplification (Table S6). Under heat stress treatment, the expression of most SlyHSF genes increased dramatically. The SlyHSF-05/07/13/18/20/23/24 genes were expressed more in all samples after heat stress treatment. The expression of the SlyHSF-18 gene increased over 150 times in 1 h compared with the control, suggesting that it was a very sensitive response acceptor that responded strongly. After that, the expression of SlyHSF-18 decreased 3.7 to 22.2 times in the following 23 h. The expression profile of SlyHSF-23 fell in a similar model that after peaking at 1 h (around 79-fold), then the expression decreased gradually to 15 times than the control (Table S7,Fig. 7). It has been shown that HSFA1a (termed SlyHSF-02 in this study) in tomato is a master regulator for triggering the heat response and can result in acquired thermotolerance (Mishra et al., 2002), although HSFA1a regulation was not significant in this study.
Duplication among SlyHSF genes
After gene duplication, some regions of proteins disappeared. In Group A8, there were three tomato HSF proteins that share ancestory withArabidopsis thaliana. After comparing the gene structures and motifs, we concluded the SlyHSF-25 and SlyHSF-26 that were located nearby one another on chromosome 2 had both lost Motif 4 and were duplicated from SlyHSF-16 (Fig. 3). These two duplicated genes may play a weak role in tomato metabolism activities due to much lower expression, both in all tissues and the heat treatment experiment.
ACKNOWLEDGEMENTS
We would like to thank Mr. Hua-Wei Tan in Nanjing Agricultural University for his help on bioinformatics analysis.
ADDITIONAL INFORMATION AND DECLARATIONS
Funding
Grant Disclosures
The following grant information was disclosed by the authors: Natural Science Foundation of Shanghai: 15ZR1436700.
Shanghai Science and Technology Talents Project: 14XD1425100. Scientific Research Project in Public Agricultural Industry: 201403032.
Competing Interests
The authors declare there are no competing interests.
Author Contributions
• Xuedong Yang conceived and designed the experiments, performed the experiments,
analyzed the data, contributed reagents/materials/analysis tools, wrote the paper, prepared figures and/or tables, reviewed drafts of the paper.
• Weimin Zhu conceived and designed the experiments, reviewed drafts of the paper.
• Hui Zhang, Na Liu and Shoubo Tian contributed reagents/materials/analysis tools,
reviewed drafts of the paper.
Data Availability
The following information was supplied regarding data availability: The raw data has been supplied asSupplemental Information.
Supplemental Information
Supplemental information for this article can be found online athttp://dx.doi.org/10.7717/ peerj.1961#supplemental-information.
REFERENCES
Aranda MA, Escaler M, Thomas CL, Maule AJ. 1999.A heat shock transcription factor in pea is differentially controlled by heat and virus replication.The Plant Journal
20:153–161DOI 10.1046/j.1365-313x.1999.00586.x.
Bailey TL, Elkan C. 1994.Fitting a mixture model by expectation maximization to discover motifs in biopolymers.Proceedings/International Conference on Intelligent Systems for Molecular Biology ; ISMB International Conference on Intelligent Systems for Molecular Biology2:28–36.
Czarnecka-Verner E, Yuan CX, Fox PC, Gurley WB. 1995.Isolation and character-ization of six heat shock transcription factor cDNA clones from soybean.Plant Molecular Biology 29:37–51DOI 10.1007/BF00019117.
Doring P, Treuter E, Kistner C, Lyck R, Chen A, Nover L. 2000.The role of AHA motifs in the activator function of tomato heat stress transcription factors HsfA1 and HsfA2.The Plant Cell12:265–278DOI 10.1105/tpc.12.2.265.
Goodstein DM, Shu S, Howson R, Neupane R, Hayes RD, Fazo J, Mitros T, Dirks W, Hellsten U, Putnam N, Rokhsar DS. 2012.Phytozome: a comparative platform for green plant genomics.Nucleic Acids Research40:D1178–D1186
Grover A, Mittal D, Negi M, Lavania D. 2013.Generating high temperature tolerant transgenic plants: Achievements and challenges.Plant Science205–206:38–47
DOI 10.1016/j.plantsci.2013.01.005.
Guo J, Wu J, Ji Q, Wang C, Luo L, Yuan Y, Wang Y, Wang J. 2008.Genome-wide analysis of heat shock transcription factor families in rice and Arabidopsis.Journal of Genetics and Genomics35:105–118
DOI 10.1016/S1673-8527(08)60016-8.
Guo M, Lu JP, Zhai YF, Chai WG, Gong ZH, Lu MH. 2015.Genome-wide analysis, expression profile of heat shock factor gene family (CaHsfs) and characterisa-tion of CaHsfA2 in pepper (Capsicum annuum L.).BMC Plant Biology15:151
DOI 10.1186/s12870-015-0512-7.
Heerklotz D, Doring P, Bonzelius F, Winkelhaus S, Nover L. 2001.The balance of nuclear import and export determines the intracellular distribution and function of tomato heat stress transcription factor HsfA2.Molecular and Cellular Biology
21:1759–1768DOI 10.1128/MCB.21.5.1759-1768.2001.
Hubel A, Schoffl F. 1994.Arabidopsis heat shock factor: isolation and characterization of the gene and the recombinant protein.Plant Molecular Biology26:353–362
DOI 10.1007/BF00039545.
Ikeda M, Mitsuda N, Ohme-Takagi M. 2011.Arabidopsis HsfB1 and HsfB2b act as re-pressors of the expression of heat-inducible Hsfs but positively regulate the acquired thermotolerance.Plant Physiology157:1243–1254DOI 10.1104/pp.111.179036.
Kotak S, Port M, Ganguli A, Bicker F, von Koskull-Doring P. 2004.Characterization of C-terminal domains of Arabidopsis heat stress transcription factors (Hsfs) and identification of a new signature combination of plant class A Hsfs with AHA and NES motifs essential for activator function and intracellular localization.The Plant Journal 39:98–112DOI 10.1111/j.1365-313X.2004.02111.x.
Krzywinski M, Schein J, Birol I, Connors J, Gascoyne R, Horsman D, Jones SJ, Marra MA. 2009.Circos: an information aesthetic for comparative genomics.Genome Research19:1639–1645DOI 10.1101/gr.092759.109.
Lin YX, Jiang HY, Chu ZX, Tang XL, Zhu SW, Cheng BJ. 2011.Genome-wide identifi-cation, classification and analysis of heat shock transcription factor family in maize. BMC Genomics12:76DOI 10.1186/1471-2164-12-76.
Liu HC, Liao HT, Charng YY. 2011.The role of class A1 heat shock factors (HSFA1s) in response to heat and other stresses in Arabidopsis.Plant, Cell & Environment
34:738–751DOI 10.1111/j.1365-3040.2011.02278.x.
Long M, Rosenberg C, Gilbert W. 1995.Intron phase correlations and the evolution of the intron/exon structure of genes.Proceedings of the National Academy of Sciences of the United States of America92:12495–12499DOI 10.1073/pnas.92.26.12495.
Mishra SK, Tripp J, Winkelhaus S, Tschiersch B, Theres K, Nover L, Scharf KD. 2002.
In the complex family of heat stress transcription factors, HsfA1 has a unique role as master regulator of thermotolerance in tomato.Genes & Development 16:1555–1567
DOI 10.1101/gad.228802.
Nover L, Bharti K, Doring P, Mishra SK, Ganguli A, Scharf KD. 2001.Arabidopsis and the heat stress transcription factor world: how many heat stress transcription factors do we need?Cell Stress & Chaperones6:177–189
DOI 10.1379/1466-1268(2001)006<0177:AATHST>2.0.CO;2.
Nover L, Scharf KD, Gagliardi D, Vergne P, Czarnecka-Verner E, Gurley WB. 1996.
The Hsf world: classification and properties of plant heat stress transcription factors. Cell Stress & Chaperones1:215–223
DOI 10.1379/1466-1268(1996)001<0215:THWCAP>2.3.CO;2.
Nystedt B, Street NR, Wetterbom A, Zuccolo A, Lin YC, Scofield DG, Vezzi F, Del-homme N, Giacomello S, Alexeyenko A, Vicedomini R, Sahlin K, Sherwood E, Elf-strand M, Gramzow L, Holmberg K, Hallman J, Keech O, Klasson L, Koriabine M, Kucukoglu M, Kaller M, Luthman J, Lysholm F, Niittyla T, Olson A, Rilakovic N, Ritland C, Rossello JA, Sena J, Svensson T, Talavera-Lopez C, Theissen G, Tuomi-nen H, Vanneste K, Wu ZQ, Zhang B, Zerbe P, Arvestad L, Bhalerao R, Bohlmann J, Bousquet J, Garcia Gil R, Hvidsten TR, de Jong P, MacKay J, Morgante M, Ritland K, Sundberg B, Thompson SL, Van de Peer Y, Andersson B, Nilsson O, Ingvarsson PK, Lundeberg J, Jansson S. 2013.The Norway spruce genome sequence and conifer genome evolution.Nature497:579–584DOI 10.1038/nature12211.
Pfaffl MW. 2001.A new mathematical model for relative quantification in real-time RT-PCR.Nucleic Acids Research29:e45DOI 10.1093/nar/29.9.e45.
Pressman E, Peet MM, Pharr DM. 2002.The effect of heat stress on tomato pollen characteristics is associated with changes in carbohydrate concentration in the developing anthers.Annals of Botany90:631–636DOI 10.1093/aob/mcf240.
Scharf KD, Berberich T, Ebersberger I, Nover L. 2012.The plant heat stress transcrip-tion factor (Hsf) family: structure, functranscrip-tion and evolutranscrip-tion.Biochimica et Biophysica Acta1819:104–119DOI 10.1016/j.bbagrm.2011.10.002.
Scharf KD, Rose S, Zott W, Schoffl F, Nover L. 1990.Three tomato genes code for heat stress transcription factors with a region of remarkable homology to the DNA-binding domain of the yeast HSF.The EMBO Journal9:4495–4501.
Schoffl F, Prandl R, Reindl A. 1998.Regulation of the heat-shock response.Plant Physiology117:1135–1141DOI 10.1104/pp.117.4.1135.
Shim D, Hwang JU, Lee J, Lee S, Choi Y, An G, Martinoia E, Lee Y. 2009.Orthologs of the class A4 heat shock transcription factor HsfA4a confer cadmium tolerance in wheat and rice.The Plant Cell21:4031–4043DOI 10.1105/tpc.109.066902.
Song X, Liu G, Duan W, Liu T, Huang Z, Ren J, Li Y, Hou X. 2014.Genome-wide identification, classification and expression analysis of the heat shock transcription factor family in Chinese cabbage.Molecular Genetics and Genomics289:541–551
DOI 10.1007/s00438-014-0833-5.
Tomato Genome Consortium. 2012.The tomato genome sequence provides insights into fleshy fruit evolution.Nature485:635–641 DOI 10.1038/nature11119.
Treuter E, Nover L, Ohme K, Scharf KD. 1993.Promoter specificity and deletion analysis of three heat stress transcription factors of tomato.Molecular & General Genetics
Xue GP, Sadat S, Drenth J, McIntyre CL. 2014.The heat shock factor family from Triticum aestivum in response to heat and other major abiotic stresses and their role in regulation of heat shock protein genes.Journal of Experimental Botany
65:539–557DOI 10.1093/jxb/ert399.
Yang Z, Wang Y, Gao Y, Zhou Y, Zhang E, Hu Y, Yuan Y, Liang G, Xu C. 2014.Adaptive evolution and divergent expression of heat stress transcription factors in grasses. BMC Evolutionary Biology14:147 DOI 10.1186/1471-2148-14-147.
Zhu X, Thalor SK, Takahashi Y, Berberich T, Kusano T. 2012.An inhibitory effect of the sequence-conserved upstream open-reading frame on the translation of the main open-reading frame of HsfB1 transcripts in Arabidopsis.Plant, Cell & Environment