www.atmos-chem-phys.net/12/6113/2012/ doi:10.5194/acp-12-6113-2012
© Author(s) 2012. CC Attribution 3.0 License.
Chemistry
and Physics
Organic molecular markers and signature from wood combustion
particles in winter ambient aerosols: aerosol mass spectrometer
(AMS) and high time-resolved GC-MS measurements in Augsburg,
Germany
M. Elsasser1,2, M. Crippa3, J. Orasche1,4, P. F. DeCarlo3,*, M. Oster1,2, M. Pitz5,6, J. Cyrys5,6, T. L. Gustafson7, J. B. C. Pettersson7, J. Schnelle-Kreis1, A. S. H. Pr´evˆot3, and R. Zimmermann1,2
1Joint Mass Spectrometry Centre, Cooperation Group Comprehensive Molecular Analytics, Helmholtz Zentrum M¨unchen,
Ingolst¨adter Landstr. 1, 85764 Neuherberg, Germany
2Joint Mass Spectrometry Centre, Universit¨at Rostock, Institut f¨ur Chemie, Lehrstuhl f¨ur Analytische Chemie,
Dr.-Lorenz-Weg 1, 18059 Rostock, Germany
3Laboratory of Atmospheric Chemistry, Paul Scherrer Institute, 5232 Villigen PSI, Switzerland
4Department of Sedimentology & Environmental Geology, Georg-August-University G¨ottingen, 37077 G¨ottingen, Germany 5Helmholtz Zentrum M¨unchen, German Research Center for Environmental Health, Institute of Epidemiology II, 85764
Neuherberg, Germany
6University of Augsburg, Environment Science Center, 86159 Augsburg, Germany 7Department of Chemistry, University of Gothenburg, 412 96 Gothenburg, Sweden
*now at: Department of Civil Architectural and Environmental Engineering, Drexel University, 19104 Philadelphia, PA, USA
Correspondence to:J. Schnelle-Kreis (juergen.schnelle@helmholtz-muenchen.de)
Received: 23 December 2011 – Published in Atmos. Chem. Phys. Discuss.: 10 February 2012 Revised: 19 June 2012 – Accepted: 19 June 2012 – Published: 16 July 2012
Abstract. The impact of wood combustion on ambient aerosols was investigated in Augsburg, Germany during a winter measurement campaign of a six-week period. Special attention was paid to the high time resolution observations of wood combustion with different mass spectrometric meth-ods. Here we present and compare the results from an Aero-dyne aerosol mass spectrometer (AMS) and gas chromato-graphic – mass spectrometric (GC-MS) analysed PM1filters
on an hourly basis. This includes source apportionment of the AMS derived organic matter (OM) using positive matrix factorisation (PMF) and analysis of levoglucosan as wood combustion marker, respectively.
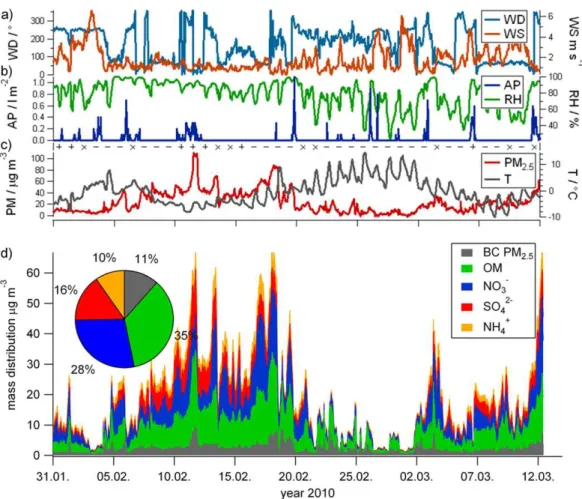
During the measurement period nitrate and OM mass are the main contributors to the defined submicron particle mass of AMS and Aethalometer with 28 % and 35 %, respectively. Wood combustion organic aerosol (WCOA) contributes to OM with 23 % on average and 27 % in the evening and night time. Conclusively, wood combustion has a strong influ-ence on the organic matter and overall aerosol composition.
Levoglucosan accounts for 14 % of WCOA mass with a higher percentage in comparison to other studies. The ra-tio between the mass of levoglucosan and organic carbon amounts to 0.06.
This study is unique in that it provides a one-hour time resolution comparison between the wood combustion results of the AMS and the GC-MS analysed filter method at a PM1particle size range. The comparison of the
levoglucosan concentration from the AMS data is problem-atic due to its overestimation in comparison to the levoglu-cosan measured by the GC-MS.
1 Introduction
Ambient organic aerosol is of high interest due to its effect on climate and human health (IPCC, 2007; Lohmann and Feichter, 2005; Pope and Dockery, 2006). During the winter season wood combustion (WC) is one of the major sources of organic aerosol in Europe (Puxbaum et al., 2007). Be-sides primary particles consisting of a complex mixture of soot, inorganic and organic matter (OM), WC additionally emits a considerable amount of volatile organic compounds (VOCs), some of which are known to be secondary organic aerosol (SOA) precursors (Grieshop et al., 2009; Heringa et al., 2011). WC has an important influence on aerosol com-position. Nevertheless, its significance may grow with the anticipated increase in the use of renewable energy sources. Therefore, it is important to develop tools to quantify the con-tribution of WC to air pollution.
Nowadays, several novel offline and online measurement systems make the observation of the highly dynamic process of WC emission events and their contribution to the ambient aerosol possible. The offline methods, for instance the anal-ysis of filter samples with gas chromatography (GC), pro-vide quantitative and qualitative results of WC markers such as levoglucosan, potassium and phenolic compounds (San-dradewi et al., 2008a; Svane et al., 2009; Simoneit, 2002; Cass, 1998). Some of these WC markers and several statis-tical source apportionment methods (Viana et al., 2008) like positive matrix factorisation (PMF) are also the basis for the online WC emission analysis. Recently, some online high-time resolution instruments became available, for instance the aerosol mass spectrometer with subsequent statistical analyses (e.g. Lanz et al., 2008; Ulbrich et al., 2009). In addi-tion, multi-wavelength light-absorption measurements were used to determine the contribution of wood combustion par-ticles (Sandradewi et al., 2008a, b). Consequently, it is of high interest to know how well these methods agree. Other studies have compared source apportionment methodologies (Favez et al., 2010; Kim and Hopke, 2004).
The present work is primarily focused on the measure-ments performed in Augsburg, Germany, using an Aero-dyne aerosol mass spectrometer (AMS) during a winter measurement campaign in 2010. This campaign was de-signed to determine the WC influence on the ambient aerosol with different highly time-resolved online and offline mass spectrometric methods in a medium sized Central European city during wintertime.
We specifically compare WC organic matter derived from PMF analysis of AMS data and levoglucosan concentrations from GC-MS measurements. The signal of mass-to-charge
ratio (m/z) 60 is of major interest due to its potential as a WC marker ion in electron ionisation mass spectrometry, like the AMS (e.g. Alfarra et al., 2007 and Schneider et al., 2006). The novelty of the presented approach is the comparison of AMS data and PMF analysis with results from offline PM1
filter measurements under ambient conditions on a one-hour basis. Recently, other ambient studies (Aiken et al., 2009; Favez et al., 2010) compared the GC-MS and AMS methods in a time resolution range of 12–24 h and on a PM2.5filter
measurement basis. In an emission study by Lee et al. (2010) wood burning results obtained with these methods were com-pared on an approximately one-hour resolution PM2.5filter
measurement basis. In this work, the concurrent filter and AMS data will be analysed to carry out the comparison in a similar particle size range with a high time resolution; this offers the opportunity to study the dynamic impact of WC on the organic aerosol composition (for example, diurnal varia-tion and levoglucosan to organic carbon (OC) ratio).
Additional online mass spectrometers were run during this campaign. They include an Alkali AMS (Svane et al., 2004, 2009) for online potassium and sodium determination, a single-particle thermal-desorption laser mass spectrome-ter (TD-REMPI-SP-ToF-MS) (Bente et al., 2006) for poly-cyclic aromatic hydrocarbon (PAH) detection on single par-ticles (Oster et al., 2011) and an AMS for local source appor-tionment set up in the mobile atmospheric pollution labora-tory “MOSQUITA” (“Measurements Of Spatial QUantitative Imissions of Trace gases and Aerosols”, Bukowiecki et al., 2002; Mohr et al., 2011). These data are presented in other studies (e.g. Oster et al., 2011).
2 Methods 2.1 General
2.2 AMS
The Aerodyne AMS is a real-time measurement instrument for submicron non-refractory (NR) aerosol components, such as organics, sulphates, nitrates, and ammonium (Allan et al., 2004) with a 100 % transmission efficiency in the AMS sys-tem for 70–500 nm sized particles and considerable transmis-sion for particles in the 30–70 nm and 500 nm–2.5 µm ranges (Jayne et al., 2000; Zhang et al., 2002). The AMS system and data analysis software have already been described in detail in several publications (DeCarlo et al., 2006; Canagaratna et al., 2007; Zhang et al., 2004). A high-resolution time-of-flight aerosol mass spectrometer (HR-ToF-AMS, Aerodyne Research Inc., Billerica, MA,USA) was used in this cam-paign.
In this study the AMS was run alternatively between V-(single stage reflectron) and W-mode (double stage reflec-tron), with 2 min of measuring time for each mode. In this paper the V-mode data are presented. The V-mode alternates between the mass spectrum (MS) mode for the total non-refractory PM1 particle mass chemical composition (four
15-s intervals for chopper opened and closed every two min-utes of measuring time) and the particle time-of-flight (PToF) mode for the particle size distribution (four 15-s intervals every two minutes of measuring time). The heater for the aerosol thermal desorption was run at 600◦C and the
tung-sten filament for electron ionisation at an accelerating volt-age of 70 eV, respectively. A collection efficiency (CE) of 0.5 was used for this instrument and applied to all AMS data. In a detailed discussion provided in the Sect. SI-1 of the Sup-plement it is shown that an acidity balance and nitrate depen-dence is given. However, a novel calculation of an alternated CE (Middlebrook et al., 2012) shows that the nitrate depen-dence does not affect the obtained results with a constant CE of 0.5. According to Bahreini et al. (2009) this CE could vary by around 20 %.
The servo position check and the lens alignment were made in the beginning of the campaign. Flow and size cali-brations were performed before and after the campaign. Rou-tine calibrations of the ionisation efficiency (IE), baseline, m/zand single ion, as well as a gas phase correction that was carried out using a high efficiency particulate air (HEPA) fil-ter in front of the sampling inlet, were performed every four to five days (Aiken et al., 2008).
The software package Igor Pro 6.12A (Wavemetrics, Lake Oswego, OR) was used as a basis for the standard AMS data analysis tools (SQUIRREL v1.49 and PIKA v.1.08, Sueper, 2010). The fragmentation table (Allan et al., 2004) was modified according to gas phase composition.
2.3 PMF
Positive matrix factorisation (PMF) is a bilinear unmixing model used to describe the measurements as a linear com-bination of factors. PMF was applied here to reconstruct the
measured AMS organic mass spectra as a linear combination of factors characterized by a constant mass spectrum (fac-tor profile) and a variable contribution over time (strength of the factor). Both the source profiles and the factors con-tributions are unknown. Strength and profile of the sources are constrained to be positive, representing physically mean-ingful positive concentrations and contributions in the model (Ulbrich et al., 2009; Lanz et al., 2007; Paatero and Tap-pert, 1994; Paatero, 1997). A detailed description of the PMF analysis is provided in Sect. SI-2 of the Supplement. The PMF analysis for the organics source apportionment was per-formed using the AMS PMF Toolkit version 2.03 developed by Ulbrich et al. (2009) together with the Igor Pro software. Organic concentrations and error matrix were obtained fol-lowing the procedure described by Ulbrich et al. (2009). The final matrix was formed by 14 285 time points and 268 mass-to-charge ratios fromm/z12 to 300. PMF was applied to the unit mass resolution AMS V-mode data recorded with a time resolution of 4 min due to the 2 min of measuring time for the V- and W-mode.
2.4 GC-MS
PM1 filter samples were collected on quartz fibre filters
with a one-hour time resolution from 15 to 19 February in order to determine the organic composition with in situ derivatisation thermal desorption gas chromatography time of flight mass spectrometry (IDTD-GC-ToFMS) (Orasche et al., 2011). Additionally, 17 daily PM2.5 samples were
col-lected during the period of 1 to 24 February and analysed using the same method.
The PM1 samples were collected with a sequential low
volume sampler (LVS3/SEQ 47/50, Leckel GmbH, Berlin, Germany) on quartz fiber filters (T293, Munktell, Grycksbo, Sweden) at a flow rate of 38.3 l min−1. Sampling time was
one hour, yielding a collected air volume of 2.3 m3. The PM2.5 samples were collected with a low volume sampler
(Partisol-Plus Model 2025, Rupprecht & Patashnick, NY, USA) using a flow rate of 16.7 l min−1; within 24 h of
sam-pling time airborne particulate matter of 24 m3 air was
col-lected.
Prior to sampling, the quartz fiber filters were tempered for at least eight hours at 550◦C to remove all organic matter.
After sampling, the filters were cut into strips of 2×13.5 mm (27 mm2) representing a volume of 0.047 m3 of ambient air for PM1 and 0.550 m3 for PM2.5. The filter strips were
stored in glass containers at−18◦C until analysis by
ther-mal desorption GC-MS. No significant difference between the analyte masses of PM1(hourly filters) and PM2.5(daily
filters) were found.
this method is time saving (Orasche et al., 2011). It allows the analysis of non-polar and polar organic compounds in one measurement. Due to thermal desorption, low limits of quantification (LOQ) were reached (levoglucosan, man-nosan, galactosan, and dodecanoic acid reached LOQs of 0.06, 0.05, 0.02, and 0.06 ng, respectively).
The filter strips in a GC liner were spiked with an in-ternal standard mixture of standard isotope labelled refer-ence compounds, for instance, levoglucosan for quantifica-tion. For analysis an autosampler decaped the liners, added MSTFA directly onto the filter punches and put the GC liners directly into the injector (autosampler, Combi PAL, CTC Analytics AG, Zwingen, CH; LINEX-TD system, ATAS-GL, Veldhoven, NL). The injector increased its temperature from room temperature to 300◦C and kept the temperature
for 16 min (injection port: Optic III, ATAS-GL, Veldhoven, NL). During the high temperatures of thermal desorption, the carrier gas (helium) was enriched with gaseous MSTFA to ensure the ongoing silylation reaction. The derivatised and desorbed analytes were focused on a retention gap of deac-tivated fused silica with an oven temperature of 70◦
C (Re-tention gap: SGE, Ringwood, AUS; column: BPX5, SGE, Ringwood, AUS; and GC: Agilent 6890, Agilent, Palo Alto, CA, USA). After both procedures (thermal desorption and derivatisation reaction) were finished, no more MSTFA was added to the carrier gas and detection by GC-MS was started. Standard electron ionisation (EI) and ToF-MS equipment (Pegasus III, LECO Ltd., St. Joseph, MI, USA) was used for detection.
2.5 Other instruments
Another additional instrument used during this campaign was a scanning mobility particle sizer (SMPS) (TSI, model 3080, 3022A). The SMPS was running continuously in paral-lel with the AMS to obtain particle number size distributions in the size range from 14 to 673 nm. Furthermore, a twin dif-ferential mobility particle sizer (TDMPS) system combined with an aerodynamic particle sizer (APS, model 3321, TSI Inc., USA) was used to measure the particle size distribution in the range from 3 nm to 10 µm; the total used size range was from 50 nm to 1000 nm. To convert the APS (aerody-namic) to TDMPS (mobility) diameter an effective density of 1.7 g cm−3 was assumed in the overlap range of 800 to 900 nm (Pitz et al., 2008). In addition, a condensation par-ticle counter (CPC) (TSI, model 3025A) was used for total particle number concentration measurements.
An Aethalometer (Thermo Fisher Scientific Inc., USA, series 8100) was used to measure black carbon (BC). The PM2.5 mass concentration was measured using a tapered
element oscillating microbalance (TEOM, model 1400ab, Thermo Fisher Scientific Inc., USA) equipped with a fil-ter dynamics measurement system (FDMS model 8500b, Thermo Fisher Scientific Inc., USA). A sulfate particulate monitor (SPA, model 5020, Thermo Fisher Scientific Inc.,
USA) was used to measure PM2.5 particle-bound sulfate
concentrations (cf. Fig. SI-3.2). Meteorological data includ-ing wind velocity and direction, temperature, relative hu-midity and global radiation were measured with an ultra-sonic anemometer, resistance thermometer, capacitive hu-midity element and pyranometer, respectively (Adolf Thies GmbH & Co. KG, Germany).
3 Results and discussion 3.1 General
During the campaign, the ambient temperature ranged from −9.9◦C to 14.4◦C under typical seasonal weather
condi-tions. PM2.5mass concentration ranged from 1.17 µg m−3to
110.7 µg m−3. Beside the weather condition and PM2.5mass
concentration, Fig. 1 shows the hourly mean time series of the main submicron aerosol components from the AMS data, such as organic matter, nitrate, sulphate, ammonium and the PM2.5BC Aethalometer data during the whole campaign. A
high variation in particulate matter (PM) concentration and composition could be observed with higher PM2.5
trations during cold and snowy periods, while lower concen-trations were observed during warm and rainy periods. In a phase of high PM concentrations (above 20 µg m−3) from
5 to 20 February (average temperature of−2.4◦C) the low
wind speeds (WS) (on average 1.2 m s−1) are accompanied with little vertical air exchange and an increase of secondary inorganic aerosol. The phase of low PM concentrations (be-low 8 µg m−3), e.g. from 25 February to 2 March (average temperature: 6.4◦C), has a higher average WS of 2.1 m s−1
and in phases with extremely low PM (below 3 µg m−3) a WS of up to 6 m s−1. Normally, the visually observed snow
falls had no impact on the PM concentration as measured by AMS, but two special events could be observed with abrupt increases in PM in the morning hours of 11 February and 3 March 2010, concurrent with humid snow fall events.
3.2 Source apportionment results
Fig. 1.Time series of meteorological and PM data:(a)wind direction (WD/grey blue) and wind speed (WS/brown);(b)atmospheric
precip-itation (AP/dark blue), relative humidity (RH/green) and daily observation of snow fall events (+ = snow fall,−= no snow fall and×= light
snow fall);(c)particulate matter (PM2.5/red) and temperature (T/grey) and(d)hourly mean time series of submicron aerosol components
with the AMS organic matter (green), nitrate (blue), sulphate (red), ammonium (orange) and the PM2.5BC (grey) from the Aethalometer
data. An individual overview of components is given in the supplemental material (Fig. SI-3.1).
factors (Fig. 2a) with representative source MS from previ-ous studies (http:cires.colorado.edu/jimenez-group/AMSsd, July 2011). A high similarity is obtained with the MS fac-tor from a PMF solution during a winter measurement cam-paign in Grenoble (Favez et al., 2010). The European Alp city of Grenoble has a population size similar to that of Augs-burg. The comparison of the Augsburg and Grenoble factors for OOA, HOA and WCOA over 246 data points is in good agreement with the correlation coefficient ofR2=0.47, 0.84 and 0.66, respectively. In addition to the three-factor PMF solution, a four-factor solution was also evaluated. In the four-factor PMF analysis the new factor shows parts from the OOA and WCOA components. However, this four-factor PMF solution, in comparison to the three-factor solution, provides inferior correlations with the measured data set. For instance, HOA and the signal ofm/z57 correlate with just aR2 of 0.43. Additional in this four-factor solution HOA shows a high correlation withm/z44 (R2=0.93) in contrast to OOA (R2=0.43). More information about the four-factor
PMF solution is provided in Sect SI-2.2 and in Table SI-1 of the Supplement. A possible food cooking factor has not been found in PMF analysis. Additionally, the AMS does not pro-vide a high ratio of them/z 55 and 57, which would be a robust marker for food cooking (Mohr et al., 2012).
Fig. 2.AMS PMF results of the period from 31 January to 12 March, with FPEAK = 0.2.(a)Campaign calculated mass spectra of the PMF
factors compared with reference mass spectra from Grenoble, January 2009 (Favez et al., 2010) and(b)time series of the hourly mean PMF
factors and their averaged and relatively contribution to total organic matter.
is between the negative and positive FPEAK and shows a step in the factor contribution. Due to this, the FPEAK 0.2 is chosen for the subsequent analysis as a more stable PMF so-lution. Some variation of the factor mass spectra in FPEAK dependency over all FPEAKs is observed in the mass spectra from WCOA and OOA, whereas only the time series of the HOA and OOA are changed (Figs. SI-2.2 and SI-2.3).
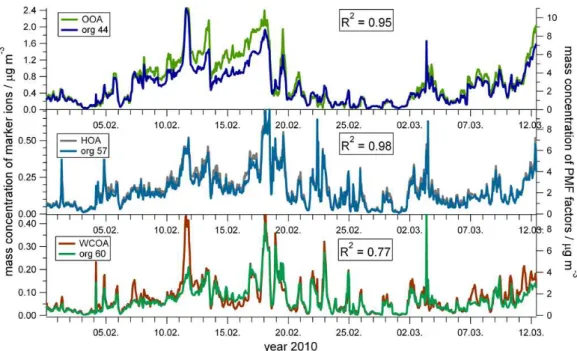
Fig. 3.Hourly averaged time series of WCOA (brown), HOA (grey) and OOA (green) PMF factors mass concentrations on the right axis
correlated with hourly averaged mass concentrations of the marker ionsm/z60 (turquoise),m/z57 (blue) andm/z44 (light blue) from the
AMS on the left axis.
Fig. 4.Hourly averaged time series of OOA (green), HOA (grey) and WCOA (brown) PMF factors correlate with AMS sulphate (red),
ammonium (black dots), PM2.5Aethalometer BC (black line) and hourly PM1(blue) and daily PM2.5(black line) levoglucosan GC-MS
data.
that WC gas phase compounds (Hawthorne et al., 1989) could increase the SOA and the OOA production, respec-tively. During the warm and humid periods, HOA has a maxi-mum contribution of around 60 % to the total organic matter.
main routes of the city being close by. The daily averaged contribution of WCOA, with about 20 % (range 10–30 %) to total OM mass, is quite constant during the whole campaign and shows no inverse correlation with the daily averaged temperatures. Nevertheless, diurnal variation of peak values can be observed, especially in the evening and at night, when regional domestic heating starts.
To support the interpretation of the PMF factors the time series of the marker ionsm/z 44, 57 and 60 (Zhang et al., 2005; Aiken et al., 2009; Alfarra et al., 2007) and the source associated species (SO2−4 , NH+
4, BC and levoglucosan) were
correlated with the factors time series and showed a correla-tion coefficient of R2>0.77 (Figs. 3 and 4). The WCOA factor correlates well with the WC marker ion of m/z 60 (R2= 0.77, Fig. 3). The correlation of OOA with OOA marker ionm/z44 is even higher (R2= 0.95). The main dif-ferences between the temporal variations of OOA andm/z 44 data are observed during the times when the HOA con-centration is notably high. The HOA is highly correlated with the primary marker ionm/z 57 (R2=0.97). Chirico et al. (2010) showed that aged diesel emissions contain high fractions of the oxygenated fragment of them/z 57 signal which is produced by oxidative processes. However, the high correlation ofm/z 57 and HOA found in our study is not surprising, because both main fragments which contribute to m/z 57, the oxygenated fragment (C3H5O+) and the
non-oxygenated fragment (C4H+9), show a high correlation with
HOA (R2= 0.85 and 0.88, respectively). Additionally, the latter fragment contributes the most to them/z 57 signal, which is approximately 47 %. It can also be seen that only the oxygenated fragment (C3H5O+) provides good correlations
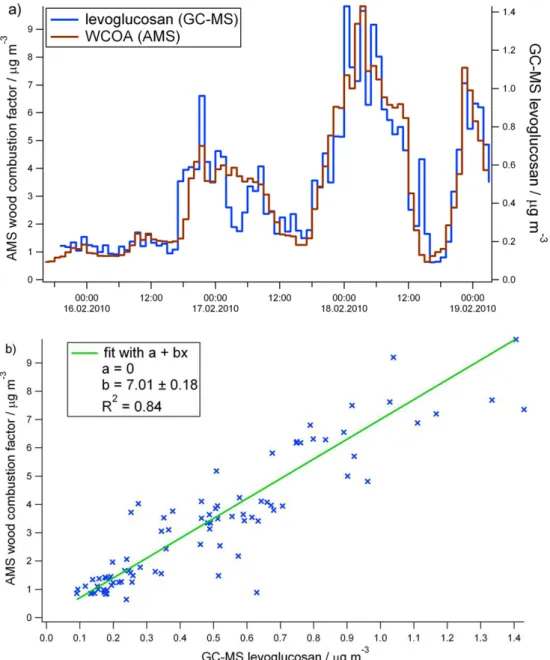
(R2=0.80 and 0.72) with WCOA and OOA, respectively. A high correlation is found as well between the concen-trations of the source-related species and the results from the PMF analysis (Fig. 4). The time series of OOA and the three main inorganic components sulphate, nitrate and am-monium used as markers for oxygenated aerosol result in correlations ofR2=0.82, 0.68 and 0.83, respectively. Ad-ditionally, the AMS sulphate data show a good correlation (R2=0.85) with data from the sulphate monitor (Fig. SI-3.2). Primary aerosol mass HOA correlates well (R2=0.81) with Aethalometer BC data. BC is mainly attributed to traffic and other combustion emissions like wood combustion (Szi-dat et al., 2007). The WCOA factor is in good correlation (R2=0.84) with the levoglucosan measurements from the hourly PM1GC-MS filters and as well (R2=0.86) with the
levoglucosan measurements from the daily PM2.5 GC-MS
filters.
3.3 Wood combustion results
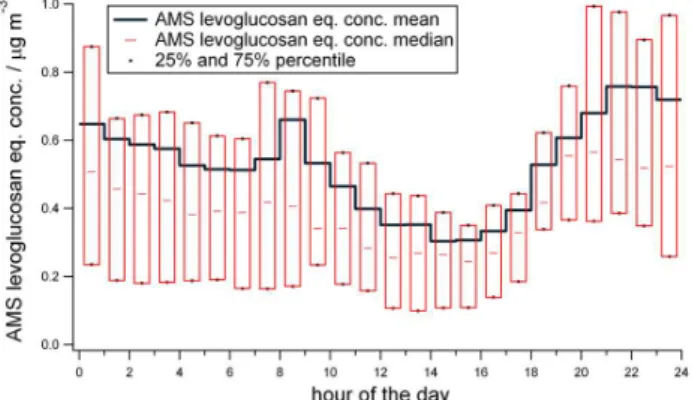
In Fig. 5, the diurnal variation of AMS levoglucosan equiva-lent concentration data is displayed as hourly averages of the whole campaign. The AMS levoglucosan equivalent concen-tration was calculated from the organic fraction ofm/z 60
Fig. 5.Diurnal variation of AMS levoglucosan equivalent concen-tration displayed as a box plot during the whole campaign calcu-lated from 14 285 data points.
by subtracting the organic background and multiplied by an instrument-specific levoglucosan standard factor (11.24 for our instrument) consisting of the ratio of m/z 60 to total organic signal from a levoglucosan standard mass spectrum (Aiken et al., 2009). The organic background has been found to be approximately 0.3 % of the total organic aerosol sig-nal in several field campaigns, in periods and areas with ab-sence of WC impacts (DeCarlo et al., 2008; Docherty et al., 2008). The calculation of the AMS levoglucosan equivalent concentration from the signal ofm/z60 is discussed in detail in Sect. 3.4. The WC contribution strongly increases during the evening period from 06:00 p.m. to 09:00 p.m. after the end of regular working time and rush hour, i.e. when people arrive at home and start domestic heating by wood combus-tion. During the night, the concentration remains approxi-mately constant with a small decrease indicating low emis-sions and stable atmospheric conditions with low wind speed and low mixing layer height. In contrast, a minor increase of levoglucosan is observed in the morning from 07:00 a.m. to 10:00 a.m. with a maximum from 08:00 a.m. to 09:00 a.m. Previous studies by Sandradewi et al. (2008b) have also shown a maximum for WC in the evening and night period, and Krecl et al. (2008) have observed the evening increase for traffic and WC related BC. The daily minimum in the af-ternoon was probably produced by a decreased WC activity together with an increase in mixing layer height during the day. The GC-MS levoglucosan daily variation of PM1filters
shows a similar profile, except for the high morning peak and some spikes due to the low number of GC-MS data points (Fig. SI-3.3). The AMS levoglucosan equivalent concentra-tion to OM mass ratio indicates a longer emission period on the weekend from the morning hours until noon compared to working days, which is expected, considering the normal weekend activities where people are more likely to spend the morning at home.
Fig. 6. Diurnal variation of the AMS PMF factor OOA (green), HOA (grey) and WCOA (brown) during the whole measurement period of the campaign.
variation, the WCOA variation shows a strong increase in the evening hours from 04:00 p.m. to 09:00 p.m. and a max-imum followed by a constant level at night from 09:00 p.m. to 01:00 a.m. The WCOA fraction contributes with approx-imately 27 % to the total OM mass in the latter period. The morning peak is smaller compared to the AMS levoglucosan equivalent concentration. Except for the less pronounced morning peak, the WCOA diurnal variation matches well with the GC-MS levoglucosan variation (Fig. SI-3.3). The HOA morning and evening maxima were obtained during the traffic rush hours. The HOA variation additionally shows a small increase around noon and a decrease after the rush hours in the night. The OOA is the largest fraction of the or-ganic matter at any time and shows no distinctive maximum like the variations of HOA and WC.
For a discussion of the aerosol chemistry and the wood combustion impact on the aerosol the view of ratios are of-ten considered, e.g. OM mass to organic carbon (OC) ratio. However, these ratios, as discussed below for the different levoglucosan to OC ratios and ranges, are strongly linked to external circumstances and influences.
The OM to OC ratio calculated from the AMS high resolu-tion data of this study amounts to an average of 1.7. Favez et al. (2010) found a similar ratio of 1.78 in Grenoble (French Alps) in wintertime. The OM to OC ratios for hydrocarbon-like and oxygenated organic aerosols have previously been found to be in the range of 1.2 to 1.4 and 1.8 to 2.4, respec-tively (e.g. Turpin and Lim, 2001; Aiken et al., 2008).
The following ratios from this study represent the esti-mated slope of the linear orthogonal regression from data comparisons over 87 data points. The PM1 levoglucosan
analyzed by the GC-MS represents 3.4 % of the total OM mass and 14.3 % of the PMF WCOA mass in this study. The GC-MS levoglucosan to WCOA ratio compared to other studies is relatively high. For example, Lanz et al. (2008) found a ratio of 8 % at an urban background site in Zurich during January 2006. In our study the levoglucosan to OC
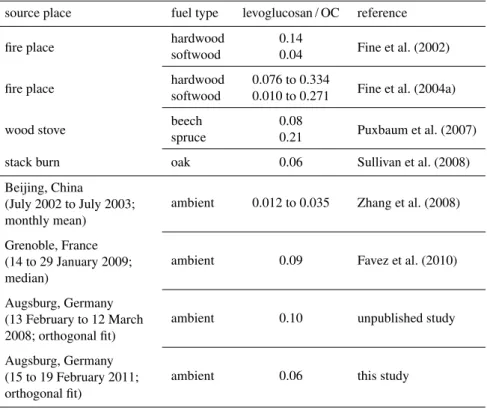
ratio amounts to 0.06 (ratio of the quotient ranged from 0.02–0.16). The OC concentrations were calculated from the OM to OC ratio and OM of the AMS high resolu-tion data. The diurnal variaresolu-tion of levoglucosan to OC ratio (range 0.03–0.9) provides a similar variation as the GC-MS levoglucosan variation (Fig. SI-3.3), only with stronger in-creases and dein-creases. Several studies (Puxbaum et al., 2007; Sullivan et al., 2008) pointed out that the fuel type used has a strong impact on this ratio (for instance, hardwood or soft-wood and even the soft-wood species in those groups themselves). Additionally, the burning conditions and the use of wood or pellet boilers have an impact on this ratio (Johansson et al., 2004; Schmidl et al., 2008; Hedberg et al., 2006). Consider-ing the range of variability of the levoglucosan to OC ratio due to these influences on the ratio, Table 1 shows that the observed ratio in this study is within a similar range as com-pared to the above-mentioned emission and ambient studies. The Augsburg ratio is similar to the results obtained in the French Alpine city of Grenoble (around 157 000 inhabitants), and higher than results obtained in Beijing (Zhang et al., 2008), where a major OC contribution may be related to traf-fic.
3.4 Correlation of AMS and one-hour PM1filter WC
results
The wood combustion measurement data of the AMS are compared with hourly PM1 filter GC-MS measurements of
levoglucosan and additional anhydrosugars in this section. The signal ofm/z60 or rather the ion C2H4O+2 is the main
marker of WCOA and is mainly formed from levoglucosan (C6H10O5) (Alfarra et al., 2007; Aiken et al., 2009). During
this Augsburg campaign the main contributor to the signal of m/z60 in the ambient aerosol is the ion fragment C2H4O+2
(93 % of m/z 60). This is in agreement with results from other campaigns (Aiken et al., 2009; Mohr et al., 2009; Lee et al., 2010).
Table 1.Literature data of levoglucosan to OC ratios from emission and ambient studies. The OC content was mainly analysed by using a thermal/optical transmission (TOT) method (Birch and Cary, 1996) with a Sunset Lab analyzer and is referred to OC from WC in the emission studies and total OC in the ambient studies. The OC content in this study is calculated from the OM mass of AMS data and the high resolution data (OM to OC ratio).
source place fuel type levoglucosan / OC reference
fire place hardwood 0.14 Fine et al. (2002)
softwood 0.04
fire place hardwood 0.076 to 0.334 Fine et al. (2004a)
softwood 0.010 to 0.271
wood stove beech 0.08 Puxbaum et al. (2007)
spruce 0.21
stack burn oak 0.06 Sullivan et al. (2008)
Beijing, China
(July 2002 to July 2003; monthly mean)
ambient 0.012 to 0.035 Zhang et al. (2008)
Grenoble, France (14 to 29 January 2009; median)
ambient 0.09 Favez et al. (2010)
Augsburg, Germany (13 February to 12 March 2008; orthogonal fit)
ambient 0.10 unpublished study
Augsburg, Germany (15 to 19 February 2011; orthogonal fit)
ambient 0.06 this study
(Schmidl et al., 2008). Thus the AMS equivalent levoglu-cosan offset is still too high and cannot be explained by the inclusion of these anhydrosugars. However, Lee et al. (2010) named the AMS levoglucosan equivalent concentration as AMS anhydrosugar equivalent concentration, which may be a more convenient expression and will be used in the follow-ing discussions. There must be other compounds co-emitted with the anhydrosugars sustaining the high correlationR2= 0.84. Various carboxylic acids are emitted from wood com-bustion (e.g. Fine et al., 2004b). These acids also produce the fragment due to a McLafferty rearrangement over a six membered transition state after EI (McLafferty, 1959) and thus contribute to them/z60 signal from wood combustion. Additionally, one may speculate that cellulose from incom-plete combustion is pyrolysed by the AMS heater, forming levoglucosan and therefore contributing to them/z60 signal (Lee et al., 2010). Another study (Mohr et al., 2009) reported a contribution tom/z 60 from food cooking aerosols. For this and for other sources additional important contributors tom/z 60 could be long-chain carboxylic acids, e.g. fatty acids like dodecanoic acid and octadecanoic acid, as shown above. Long-chain carboxylic acids with chain-lengths from C12–C20 play an important role for ambient aerosols as
shown in several studies, cited in Mirivel et al. (2009). Our GC analyses provide qualitative and quantitative information
Fig. 7. (a)Time series of hourly mean AMS levoglucosan equivalent concentration (dark blue), PM1GC-MS levoglucosan (light blue) and sum of anhydrosugar (red) results in the week of 15 to 19 February. The error bars of the GC-MS data reflect the 15 % uncertainty associated with the method; the AMS levoglucosan equivalent concentration error bars were calculated with the SQUIRREL software for
each species.(b)Scatter plot of hourly mean AMS levoglucosan equivalent concentration versus PM1GC-MS levoglucosan. Regression
values are calculated with the orthogonal distance regression.
Similar to the diurnal variations, the time series of the PMF WCOA factor and the PM1GC-MS levoglucosan data
show a high correlation of R2=0.84 during the PM1
fil-ter sampling period (Fig. 8). The main disagreement occurs at the same time as for the AMS anhydrosugar equivalent concentration in the period from 03:00 a.m. to 06:00 a.m. on 17 February. Both the AMS anhydrosugar equivalent con-centration and the WCOA variations correlate withR2= 0.71
during the whole campaign period and withR2= 0.97 over the PM1filter period.
Fig. 8. (a)Time series of the hourly mean PMF WCOA factor (brown) and the hourly PM1GC-MS levoglucosan data (blue) during the week
of 15 to 19 February.(b)Scatter plot of hourly mean PMF WCOA factor versus PM1GC-MS levoglucosan. Regression values are calculated
with the orthogonal distance regression.
biomass burning. Similar to the levoglucosan to OC ratios as shown above in Sect. 3.3, the WCOA to levoglucosan ra-tio depends on the fuel type and the combusra-tion condira-tions (e.g. Puxbaum et al., 2007; Hedberg et al., 2006).
Both estimations, the WCOA and the AMS anhydro-sugar equivalent concentration, allow to observe variation with time of WC emission, with a good gradient correla-tion ofR2=0.84. However, the WCOA is more suitable for the quantitative observation (estimated magnitude) of WC emission than the AMS anhydrosugar equivalent concentra-tion, due to the measured offset by the comparison with the GC-MS levoglucosan.
4 Conclusions
The present study gives an overview of the Augsburg win-ter campaign 2010 including a detailed view of the WC re-sults obtained by two different mass spectrometry methods. The first comparison of hourly PM1filter GC-MS
The main submicron aerosol fractions obtained by the AMS are organic matter with 35 % and nitrate with 28 % of the total mass measured by the AMS and Aethalometer in Augsburg during winter. This is typical for winter in Cen-tral Europe (Lanz et al., 2010). The organic aerosol fraction is based on three main sources found by PMF analysis, with the secondary process associated OOA as the largest contrib-utor with 42 % and WCOA with 23 % as one of the main contributors. The influence of WC is particularly important for the aerosol composition with 28 % in the evening and the night hours, while the primary HOA emission factor is of higher concern during the morning rush hours. Here HOA contribution increases to 38 %. The levoglucosan to OC ratio on average amounts to 0.06 in this study and is comparable to other ambient WC observations.
The comparison of GC-MS levoglucosan measurements from the highly time resolved PM1 filters with AMS
data shows that either AMS WCOA or alternatively AMS levoglucosan equivalent concentration analysis have a high gradient correlation (R2= 0.84) and are therefore suitable for the observation of WC emission variation. Similar to Aiken et al. (2009), we found that the AMS levoglucosan equivalent concentration (AMS anhydrosugar equivalent concentration; Lee et al., 2010) is higher than the GC-MS levoglucosan concentration. Therefore, we argue that not only levoglu-cosan contributes to the WC marker ion atm/z60 (HR frag-ment ion C2H4O+2). Additionally, other components from
WC emissions, like mannosan or galactosan or, as shown in other studies, cellulose (Lee et al., 2010), could contribute to the signal ofm/z 60. Different analyses of additional GC-MS data and PMF results reveal that long-chain carboxylic acids could additionally increase them/z60 signal and that the subtracted organic background is comparable to the OOA fraction of them/z 60 signal. Therefore a quantitative esti-mation of the AMS anhydrosugar equivalent concentration is difficult. The analysis of the diurnal variation of the PMF fac-tors appears to be important for the interpretation of the or-ganic sources and their estimated magnitude, especially for WC. The PMF WCOA diurnal variation presents a similar profile as the hourly PM1GC-MS levoglucosan results.
Supplementary material related to this article is
available online at: http://www.atmos-chem-phys.net/12/ 6113/2012/acp-12-6113-2012-supplement.pdf.
Acknowledgements. We like to thank Ph. D. G¨unther Bahnweg, (University of Michigan), for carefully reading the English version of the manuscript. This project was supported by the Swiss IMBALANCE project (IMpact of Biomass burning AerosoL on Air quality aNd ClimatE).
Edited by: B. Ervens
References
Aiken, A. C., DeCarlo, P. F., Kroll, J. H., Worsnop, D. R., Huff-man, J. A., Docherty, K., Ulbrich, I. M., Mohr, C., Kimmel, J. R., Sueper, D., Zhang, Q., Sun, Y., Trimborn, A., Northway, M., Ziemann, P. J., Canagaratna, M. R., Onasch, T. B., Alfarra, R., Pr´evˆot, A. S. H., Dommen, J., Duplissy, J., Metzger, A., Bal-tensperger, U., and Jimenez, J. L.: O/C and OM/OC Ratios of Primary, Secondary, and Ambient Organic Aerosols with High Resolution Time-of-Flight Aerosol Mass Spectrometry, Environ. Sci. Technol., 42, 4478–4485, doi:10.1021/es703009q, 2008. Aiken, A. C., Salcedo, D., Cubison, M. J., Huffman, J. A.,
De-Carlo, P. F., Ulbrich, I. M., Docherty, K. S., Sueper, D., Kim-mel, J. R., Worsnop, D. R., Trimborn, A., Northway, M., Stone, E. A., Schauer, J. J., Volkamer, R. M., Fortner, E., de Foy, B., Wang, J., Laskin, A., Shutthanandan, V., Zheng, J., Zhang, R., Gaffney, J., Marley, N. A., Paredes-Miranda, G., Arnott, W. P., Molina, L. T., Sosa, G., and Jimenez, J. L.: Mexico City aerosol analysis during MILAGRO using high resolution aerosol mass spectrometry at the urban supersite (T0) – Part 1: Fine particle composition and organic source apportionment, Atmos. Chem. Phys., 9, 6633–6653, doi:10.5194/acp-9-6633-2009, 2009. Alfarra, M. R., Pr´evˆot, A. S. H., Szidat, S., Sandradewi, J., Weimer,
S., Lanz, V. A., Schreiber, D., Mohr, M., and Baltensperger, U.: Identification of the Mass Spectral Signature of Organic Aerosols from Wood Burning Emissions, Environ. Sci. Technol., 41, 5770–5777, doi:5710.1021/es062289b, 2007.
Allan, J. D., Delia, A. E., Coe, H., Bower, K. N., Alfarra, M. R., Jimenez, J. L., Middlebrook, A. M., Drewnick, F., Onasch, T. B., Canagaratna, M. R., Jayne, J. T., and Worsnop, D. R.: A generalised method for the extraction of chemically resolved mass spectra from Aerodyne aerosol mass spectrometer data, J. Aerosol Sci., 35, 909–922, 2004.
Bahreini, R., Ervens, B., Middlebrook, A. M., Warneke, C., de Gouw, J. A., DeCarlo, P. F., Jimenez, J. L., Atlas, E., Brioude, J., Brock, C. A., Fried, A., Holloway, J. S., Peischl, J., Richter, D., Ryerson, T. B., Stark, H., Walega, J., Weibring, P., Wollny, A. G., and Fehsenfeld, F. C.: Organic Aerosol Formation in Urban and Industrial plumes near Houston and Dallas, TX, J. Geophys. Res., 114, D00F16, doi:10.1029/2008JD011493, 2009. Bente, M., Adam, T., Ferge, T., Gallavadin, S., Sklorz, M., Streibel,
T., and Zimmermann, R.: An on-line aerosol laser mass spec-trometer with three, easily interchangeable laser based ionisa-tion methods for characterisaionisa-tion of inorganic and aromatic com-pounds on particles, Int. J. Mass Spectrom., 258, 86–94, 2006. Birch, M. E. and Cary, R. A.: Elemental carbon-based method for
monitoring occupational exposures to particulate diesel exhaust, Aerosol Sci. Technol., 25, 221–241, 1996.
Bukowiecki, N., Dommen, J., Pr´evˆot, A. S. H., Richter, R., Wein-gartner, E., and Baltensperger, U.: A mobile pollutant measure-ment laboratory – measuring gas and aerosol ambient concentra-tions with high spatial and temporal resolution, Atmos. Environ., 36, 5569–5579, 2002.
Cass, G. R.: Organic molecular tracers for particulate air pollution sources, TRAC-Trend. Anal. Chem., 17, 356–366, 1998. Chirico, R., DeCarlo, P. F., Heringa, M. F., Tritscher, T., Richter,
R., Pr´evˆot, A. S. H., Dommen, J., Weingartner, E., Wehrle, G., Gysel, M., Laborde, M., and Baltensperger, U.: Impact of af-tertreatment devices on primary emissions and secondary or-ganic aerosol formation potential from in-use diesel vehicles: re-sults from smog chamber experiments, Atmos. Chem. Phys., 10, 11545–11563, doi:10.5194/acp-10-11545-2010, 2010.
Cyrys, J., Pitz, M. Soentgen, J., Zimmermann, R., Wichmann, H. E., and Peters, A.: New measurement site for physical and chemical particle characterization in Augsburg, Germany, Epidemiology, 17, 250–251, 2006.
DeCarlo, P. F., Kimmel, J. R., Trimborn, A., Northway, M. J., Jayne, J. T., Aiken, A. C., Gonin, M., Fuhrer, K., Horvath, T., Docherty, K., Worsnop, D. R., and Jimenez, J. L.: Field-Deployable, High-Resolution, Time-of-Flight Aerosol Mass Spectrometer, Anal. Chem., 78, 8281–8289, 2006.
DeCarlo, P. F., Dunlea, E. J., Kimmel, J. R., Aiken, A. C., Sueper, D., Crounse, J., Wennberg, P. O., Emmons, L., Shinozuka, Y., Clarke, A., Zhou, J., Tomlinson, J., Collins, D. R., Knapp, D., Weinheimer, A. J., Montzka, D. D., Campos, T., and Jimenez, J. L.: Fast airborne aerosol size and chemistry measurements above Mexico City and Central Mexico during the MILAGRO cam-paign, Atmos. Chem. Phys., 8, 4027–4048, doi:10.5194/acp-8-4027-2008, 2008.
Docherty, K. S., Stone, E. A., Ulbrich, I. M., DeCarlo, P. F., Snyder, D. C., Schauer, J. J., Peltier, R. E., Weber, R. J., Murphy, S. M., Seinfeld, J. H., Eatough, D. J., and Jimenez, J. L.: Apportionment of primary and secondary organic aerosols in southern California during the 2005 study 5 of organic aerosols in riverside (SOAR), Environ. Sci. Technol., 42, 7655–7662, 2008.
Favez, O., El Haddad, I., Piot, C., Bor´eave, A., Abidi, E., Marchand, N., Jaffrezo, J.-L., Besombes, J.-L., Personnaz, M.-B., Sciare, J., Wortham, H., George, C., and D’Anna, B.: Inter-comparison of source apportionment models for the estimation of wood burning aerosols during wintertime in an Alpine city (Grenoble, France), Atmos. Chem. Phys., 10, 5295–5314, doi:10.5194/acp-10-5295-2010, 2010.
Fine, P. M., Cass, G. R., and Simoneit, B. R. T.: Chemical Char-acterization of Fine Particle Emissions from the Fireplace Com-bustion of Woods Grown in the Southern United States, Environ. Sci. Technol., 36, 1442–1451, 2002.
Fine, P. M., Cass, G. R., and Simoneit, B. R. T.: Chemical Char-acterization of Fine Particle Emissions from the Fireplace Com-bustion of Wood Types Grown in the Midwestern and Western United States, Environ. Eng. Sci., 21, 387–407, 2004a.
Fine, P. M., Cass, G. R., and Simoneit, B. R. T.: Chemical Charac-terization of Fine Particle Emissions from the Wood Stove Com-bustion of Prevalent United States Tree Species, Environ. Eng. Sci., 21, 705–721. doi:10.1089/ees.2004.21.705, 2004b. Grieshop, A. P., Logue, J. M., Donahue, N. M., and Robinson, A.
L.: Laboratory investigation of photochemical oxidation of or-ganic aerosol from wood fires 1: measurement and simulation of organic aerosol evolution, Atmos. Chem. Phys., 9, 1263–1277, doi:10.5194/acp-9-1263-2009, 2009.
Gu, J., Pitz, M., Schnelle-Kreis, J., Diemer, J., Reller, A., Zimmer-mann, R., Soentgen, J., Stoelzel, M., WichZimmer-mann, H.-E., Peters, A., and Cyrys, J.: Source apportionment of ambient particles:
Comparison of positive matrix factorization analysis applied to particle size distribution and chemical composition data, Atmos. Environ., 45, 1849–1857, 2011.
Hawthorne, S. B., Krieger, M. S., Miller, D. J., and Mathiason, M. B.: Collection and Quantitation of Methoxylated Phenol Tracers for Atmospheric Pollution from Residential Wood Stoves, Envi-ron. Sci. Technol., 23, 470–475, 1989.
Hedberg, E., Johansson, C., Johansson, L., Swietlicki, E., and Brorstr¨om-Lund´en, E.: Is levoglucosan a suitable quantitative tracer for wood burning? Comparison with receptor modeling on trace elements in Lycksele, Sweden, J. Air Waste Manage. As-soc., 56, 1669–1678, 2006.
Heringa, M. F., DeCarlo, P. F., Chirico, R., Tritscher, T., Dommen, J., Weingartner, E., Richter, R., Wehrle, G., Pr´evˆot, A. S. H., and Baltensperger, U.: Investigations of primary and secondary particulate matter of different wood combustion appliances with a high-resolution time-of-flight aerosol mass spectrometer, At-mos. Chem. Phys., 11, 5945–5957, doi:10.5194/acp-11-5945-2011, 2011.
IPCC: Climate Change 2007 – The Physical Science Basis, Work-ing Group I Contribution to the Fourth Assessment Report of the IPCC, Cambridge University Press, Cambridge, UK, 2007. Jayne, J. T., Leard, D. C., Zhang, X., Davidovits, P., Smith, K. A.,
Kolb, C. E., and Worsnop, D. R.: Development of an Aerosol Mass Spectrometer for Size and Composition. Analysis of Sub-micron Particles, Aerosol Sci. Technol., 33, 49–70, 2000. Johansson, L. S., Leckner, B., Gustavsson, L., Cooper, D., Tullin,
C., and Potter, A.: Emission characteristics of modern and old-type residential boilers fired with wood logs and wood pellets, Atmos. Environ., 38, 4183–4195, 2004.
Kim, E. and Hopke, P. K.: Comparison between Conditional Prob-ability Function and Nonparametric Regression for Fine Particle Source Directions, Atmos. Environ., 38, 4667–4673, 2004. Krecl, P., Str¨om, J., and Johansson, C.: Diurnal variation of
atmospheric aerosol during the wood combustion season in Northern Sweden, Atmos. Environ., 42, 4113–4125, 2008. Lanz, V. A., Alfarra, M. R., Baltensperger, U., Buchmann, B.,
Hueglin, C., and Pr´evˆot, A. S. H.: Source apportionment of submicron organic aerosols at an urban site by factor analyti-cal modelling of aerosol mass spectra, Atmos. Chem. Phys., 7, 1503–1522, doi:10.5194/acp-7-1503-2007, 2007.
Lanz, V. A., Alfarra, M. R., Baltensperger, U., Buchmann, B., Hueglin, C., Szidat, S., Wehrli, M. N., Wacker, L., Weimer, S., Caseiro, A., Puxbaum, H., and Pr´evˆot, A. S. H.: Source attribu-tion of submicron organic aerosols during wintertime inversions by advanced factor analysis of aerosol mass spectra, Environ. Sci. Technol., 42, 214–220, 2008.
Lohmann, U. and Feichter, J.: Global indirect aerosol effects: a re-view, Atmos. Chem. Phys., 5, 715–737, doi:10.5194/acp-5-715-2005, 2005.
L¨owel, H., D¨oring, A., Schneider, A., Heier, M., Thorand, B., and Meisinger, C.: The MONICA Augsburg Surveys – Basis for Prospective Cohort Studies, Gesundheitswesen, Sonderheft 1, 13–18, 2005.
McLafferty, F. W.: Mass Spectrometric Analysis, Molecular Rear-rangements, Anal. Chem., 31, 82–87, doi:10.1021/ac60145a015, 1959.
Middlebrook, A. M., Bahreini, R., Jimenez, J. L., and Cana-garatna, M. R.: Evaluation of Composition-Dependent Collec-tion Efficiencies for the Aerodyne Aerosol Mass Spectrometer using Field Data, Aerosol Sci. Technol., 46, 258–271, doi:10.1080/02786826.2011.620041, 2012.
Mirivel, G., Riffault, V., and Galloo, J.-C.: Development and vali-dation of an ultra-high-performance liquid chromatography cou-pled to time-of-flight mass spectrometry method to quantify
ben-zoic acid and long-chain monocarboxylic acids (C12–C28) in
at-mospheric aerosols, J. Chromatogr. A, 1216, 6481–6489, 2009. Mohr, C., Huffman, J. A., Cubison, M. J., Aiken, A. C., Docherty,
K. S., Kimmel, J. R., Ulbricht, I. M., Hannigan, M., and Jimenez, J. L.: Characterization of Primary Organic Aerosol Emissions from Meat Cooking, Trash Burning, and Motor vehicles with High-Resolution Aerosol Mass Spectrometry and Comparison with Ambient and Chamber Observations, Environ. Sci. Tech-nol., 43, 2443–2449, doi:10.1021/Es8011518, 2009.
Mohr, C., Richter, R., DeCarlo, P. F., Pr´evˆot, A. S. H., and Bal-tensperger, U.: Spatial variation of chemical composition and sources of submicron aerosol in Zurich during wintertime using mobile aerosol mass spectrometer data, Atmos. Chem. Phys., 11, 7465–7482, doi:10.5194/acp-11-7465-2011, 2011.
Mohr, C., DeCarlo, P. F., Heringa, M. F., Chirico, R., Slowik, J. G., Richter, R., Reche, C., Alastuey, A., Querol, X., Seco, R., Pe˜nuelas, J., Jim´enez, J. L., Crippa, M., Zimmermann, R., Bal-tensperger, U., and Pr´evˆot, A. S. H.: Identification and quan-tification of organic aerosol from cooking and other sources in Barcelona using aerosol mass spectrometer data, Atmos. Chem. Phys., 12, 1649–1665, doi:10.5194/acp-12-1649-2012, 2012. Orasche, J., Schnelle-Kreis, J., Abbaszade, G., and Zimmermann,
R.: Technical Note: In-situ derivatization thermal desorption GC-TOFMS for direct analysis of particle-bound non-polar and polar organic species, Atmos. Chem. Phys., 11, 8977–8993, doi:10.5194/acp-11-8977-2011, 2011.
Oster, M., Elsasser, M., Schnelle-Kreis, J., and Zimmermann, R.: First field application of a thermal desorption resonance-enhanced multiphoton-ionisation single particle time-of-flight mass spectrometer for the on-line detection of particle bound polycyclic aromatic hydrocarbons. Anal. Bioanal. Chem., 401, 3173–3182, doi:10.1007/s00216-011-5438-9, 2011.
Paatero, P. and Tappert U.: Positive Matrix Factorization: a non-negative factor model with optimal utilization of error estimated of data values, Environmetrics, 5, 111–126, 1994.
Paatero, P.: Least squares formulation of robust non-negative factor analysis, Chemometr. Intell. Lab., 37, 23–35, 1997.
Pitz, M., Birmili, W., Schmid, O., Peters, A., Wichmann, H. E., and Cyrys, J.: Quality control and quality assurance for particle size distribution measurements at an urban monitoring station in Augsburg, Germany, J. Environ. Monitor., 10, 1017–1024, 2008.
Pope, C. A. and Dockery, D. W.: Health effects of fine particulate air pollution: Lines that connect, J. Air Waste Manage. Assoc., 56, 709–742, 2006.
Puxbaum, H., Caseiro, A., S´anchez-Ochoa, A., Kasper-Giebl, A., Claeys, M., Gelencs’er, A., Legrand, M., Preunkert, S., and Pio, C.: Levoglucosan levels at background sites in Eu-rope for assessing the impact of biomass combustion on the aerosol European background, J. Geophys. Res., 112, D23S05, doi:10.1029/2006JD008114, 2007.
Sandradewi, J., Pr´evˆot, A. S. H., Alfarra, M. R., Szidat, S., Wehrli, M. N., Ruff, M., Weimer, S., Lanz, V. A., Weingartner, E., Per-ron, N., Caseiro, A., Kasper-Giebl, A., Puxbaum, H., Wacker, L., and Baltensperger, U.: Comparison of several wood smoke markers and source apportionment methods for wood burning particulate mass, Atmos. Chem. Phys. Discuss., 8, 8091–8118, doi:10.5194/acpd-8-8091-2008, 2008a.
Sandradewi, J., Pr´evˆot, A. S. H., Weingartner, E., Schmidhauser, R., Gysel, M., and Baltensperger, U.: A study of wood burning and traffic aerosols in an Alpine valley using a multi-wavelength aethalometer, Atmos. Environ., 42, 101–112, 2008b.
Schneider, J., Weimer, S., Drewnick, F., Borrmann, S., Helas, G., Gwaze, P., Schmid, O., Andreae, M. O., and Kirchner, U.: Mass spectrometric analysis and aerodynamic properties of various types of combustion-related aerosol particles, Int. J. Mass Spec-trom., 258, 37–49, 2006.
Schmidl, C., Marr, I. L., Caseiro, A., Kotianova, P., Berner, A., Bauer, H., Kasper-Giebl, A., and Puxbaum, H.: Chemical charac-terisation of fine particle emissions from wood stove combustion of common woods growing in mid-European Alpine regions, At-mos. Environ., 42, 126–141, 2008.
Simoneit, B. R. T.: Biomass burning – a review of organic tracers for smoke from incomplete combustion, Appl. Geochem., 17, 129– 162, 2002.
Sueper, D.: ToF-AMS High Resolution Analysis Software – Pika, online available at: http://cires.colorado.edu/jimenez-group/ ToFAMSResources/ToFSoftware/PikaInfo/, 2010.
Sullivan, A. P., Holden, A. S., Patterson, L. A., McMeeking, G. R., Kreidenweis, S. M., Malm, W. C., Hao, W. M., Wold, C. E., and Collett Jr., J. L.: A method for smoke marker measure-ments and its potential application for determining the contribu-tion of biomass burning from wildfires and prescribed fires to
ambient PM2.5organic carbon, J. Geophys. Res., 113, D22302,
doi:10.1029/2008JD010216, 2008.
Svane, M., Hagstr¨om, M., and Pettersson, J. B. C.: Chemical anal-ysis of individual alkali-containing aerosol particles: Design and performance of a surface ionization particle beam mass spec-trometer, Aerosol Sci. Technol., 38, 655–663, 2004.
Svane, M., Gustafsson, T. L., Kocevik, B., Noda, J., Andersson , P. U., Nilsson D. E., and Pettersson, J. B. C.: On-line chemical analysis of individual alkali-containing aerosol particles by sur-face ionization combined with time-of-flight mass spectrometry, Aerosol Sci. Technol., 43, 653–661, 2009.
Szidat, S., Pr´evˆot, A. S. H., Sandradewi, J., Alfarra, M. R., Synal, H.-A., Wacker, L., and Baltensperger, U.: Dominant impact of residential wood burning on particulate matter in Alpine valleys during winter, Geophys. Res. Lett., 34, L05820, doi:10.1029/2006GL028325, 2007.
organic mass, Aerosol Sci. Technol., 35, 602–610, 2001. Ulbrich, I. M., Canagaratna, M. R., Zhang, Q., Worsnop, D. R., and
Jimenez, J. L.: Interpretation of organic components from Posi-tive Matrix Factorization of aerosol mass spectrometric data, At-mos. Chem. Phys., 9, 2891–2918, doi:10.5194/acp-9-2891-2009, 2009.
Viana, M., Kuhlbusch, T. A. J., Querol, X., Alastuey, A., Harri-son, R. M., Hopke, P. K., Winiwarter, W., Vallius, M., Szidat, S., Pr´evˆot, A. S. H., Hueglin, C., Bloemen, H., W˚ahlin, P., Vecchi, R., Miranda, A. I., Kasper-Giebl, A., Maenhaut, W., and Hitzen-berger, R.: Source apportionment of particulate matter in Europe: A review of method and results, J. Aerosol Sci., 39, 827–849, 2008.
Zhang, Q., Alfarra, M. R., Worsnop, D. R., Allan, J. D., Coe, H., Canagaratna, M. R., and Jimenez, J. L.: Deconvolution and quan-tification of hydrocarbon-like and oxygenated organic aerosols based on aerosol mass spectrometry, Environ. Sci. Technol., 39, 4938–4952, 2005.
Zhang, T., Claeys, M., Cachier, H., Dong, S., Wang, W., Maenhaut, W., and Liu, X.: Identification and estimation of the biomass burning contribution to Beijing aerosol using levoglucosan as a molecular marker, Atmos. Environ., 42, 7013–7021, 2008. Zhang, X., Smith, K. A., Worsnop, D. R., Jimenez, J. L., Jayne,
J. T., and Kolb, C. E.: A Numerical Characterization of Particle Beam Collimation by an Aerodynamic Lens-Nozzle System – Part I: An Individual Lens or Nozzle, Aerosol Sci. Technol., 36, 617–631, 2002.