Experimental Investigation of Effect of Process Parameters on
Mrr and Surface Roughness In Turning Operation on
Conventional Lathe Machine For Aluminum 6082 Grade
Material Using Taguchi Method
Mihir T. Patel*, Vivek A. Deshpande**
*(Department of Mechanical Engineering, B & B Institute of Technology, Gujarat, India)
** (Department of Mechanical Engineering, G. H. Patel college of Engineering & Technology, Gujarat, India)
ABSTRACT
In this study, the effect of the machining parameters like spindle speed, feed, depth of cut and nose radius on material removal rate and surface roughness are investigated, also optimum process parameters are studied. An L8 orthogonal array (mixed level design), analysis of variance (ANOVA) and the signal –to-noise (S/N) ratio are used in this study. Mixed levels of machining parameters are used and experiments are done on conventional lathe machine. Aluminum Alloy - Al 6082 grade material is used in high stress applications, Trusses, Bridges, Cranes, Transport applications, Ore skips, Beer barrels, Milk churns etc. The most significant parameters for material removal rate are speed, depth of cut and least significant factor for MRR is nose radius For surface roughness speed, nose radius are the most significant parameters and least significant factor for surface roughness is depth of cut. The mathematical model obtained as a result of regression analysis can be reliable to predict MRR and surface roughness Ra.
Keywords
- Analysis of Variance, Mixed Level Array, Optimization, Regression Analysis, Taguchi Method.I.
INTRODUCTION
In a global competitive environment every industries are trying to decrease the cutting cost and increased the quality of machined parts/components. So, it required to focus on material removal rate and surface roughness. The machining time reduces lead to reduce overall costs which depend on volume of material to be removed and machining parameters like speed, feed and depth of cut.
The quality of surface roughness is also important properties of machined parts, the good quality machined parts improved fatigue strength, corrosion resistance, creep life. The surface roughness also on some functional attributes like surface friction, wearing, light reflection, ability of holding and distributing a lubricant, load bearing capacity, etc. Increasing the productivity and the quality of the machined parts are the main challenges of the based industry [1].
Aluminum alloys are classified under two classes: cast alloys and wrought alloys. Moreover, they can be classified according to the specification of the alloying elements involved, such as strain-hardening alloys and heat-treatable alloys. Most wrought aluminum alloys have excellent machinability. While cast alloys containing copper, magnesium or zinc as the main alloying elements can cause some machining difficulties, the use of small tool rake angles can improve machinability
[2]. Aluminum is widely used non-ferrous metal. Aluminum is almost always alloyed, which markedly improves its mechanical properties, especially when tempered. The main alloying agents are copper, zinc, magnesium, manganese, and silicon and the levels of these other metals are in the range of a few percent by weight [3].
The work material used for present study is Aluminum alloy 6082 is a medium strength alloy with excellent corrosion resistance and it has the highest strength of the 6000 series alloys. Alloy 6082 is known as a structural alloy. As a relatively new alloy, the higher strength of Aluminum alloy 6082 has seen it replace 6061 in many applications.
Many types of tool materials, ranging from high carbon steel to diamonds, are used as cutting
tools in today‟s metal working industry. It is
important to be aware that differences do exist among tool materials, what these differences are, and the correct application for each type of material. In some particular applications, a premium or higher priced material will be justified. This does not mean that the most expensive tool is always the best tool [2]. The imports of tool damage leads to economic losses like work piece spoiling or poor surface quality. Selection of best process parameters using various optimization techniques will help to solve the problem of improper selection of process parameters. In order to select optimal cutting
parameters, manufacturing to obtain optimal cutting parameters, manufacturing industries have depended on the use of handbook based information which leads to decrease in productivity. This causes high manufacturing cost and low product quality [4]
Many researcher have been carried experimental investigation to study the effect of cutting parameters, tool geometry using the Aluminum alloys. They have taken speed, feed and depth of cut as input parameters and surface roughness as responding parameter. They proved that feed, speed is the most significant factor. [2], [5]-[10]. Only few researcher have studied the interaction effect of nose radius. For surface roughness they found that nose radius is most significant factor [5].
MRR and surface roughness are the important parameters and it requires to optimize. The optimization of lathe turning process is often achieved by trial-and-error method based. But this does not give guarantee of quality as well as machining economics [11]. The traditional experimental design methods are very complicated and difficult to use and required a large number of experiments when process parameters are increase [12]. A general optimization plan is required to avoid cumbersome trial runs on machine and wastages. Taguchi method is widely adopted for the improvement of quality and machining economics. Taguchi parameter design uses the orthogonal array concept, used to estimate main effects using few experimental runs [13].
II.
MRR
AND
SURFACE
ROUGHNESS
MEASUREMENT
The material removal rate has been calculated from the difference of weight of work before and after machining by using following formula.
i f
a
W -W
MRR=
ρ t
Where,
Wi = weight of work before machining Wf = weight of work after machining t = machining time in minute
ρa = density of Al 6082 (2.7 g/mm3)
There are several ways to describe surface roughness such as average roughness (Ra), Root mean square (Rs), Maximum peak to valley roughness (Rt) and Ten point height method (Rz). One of the most often used average roughness which is often represented as Ra symbol. The average value (without considering the positive or negative sign) of the ordinates (y1, y2,…, yn) drawn on the mean line of the surface profile called as CLA number or Ra value.
1 2 3 n
y
y
y
y
y
Ra
L
L
The above method finding CLA number is quite tedious. The easy method is as below
In this method the area (A1,A2,…, An) generated from mean line and surface profile measured with help of planimeter and then Ra value is found as below
1 2 3 n
A
A
A
A
A
Ra
L
L
Where, L = sampling length
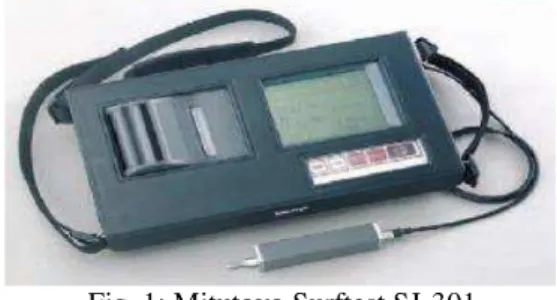
There are many method is used to measure surface roughness , such as fingertip, microscopes, stylus type instruments, profile tracing instruments etc. The portable surface roughness tester Surftest SJ-301 used in present experimental work.
Fig. 1: Mitutoyo Surftest SJ-301
III.
TAGUCHI
METHOD
that is the smaller the better, the higher the better and the nominal the better (Ross, 1996). In the present work the first selection the higher the better characteristic for material removal rate and the lower the better characteristics for the surface roughness.
The higher the better S/N ratio for MRR,
10
mean of sum squares of reciprocal S/N ratio = -log
of measured data
The lower the better S/N ratio for surface roughness,
10
reciprocal of mean of sum squares S/N ratio = -log
of reciprocal of measured data
IV.
DESIGN OF EXPERIMENT
For the experimental design Taguchi method was employed to reach more comprehensive a result with lesser experiments. The objective of Design of experiment is to determine the variables in a process that are the critical parameters and their target values and so on the basis of selected parameters, experimental design is carried out. Taguchi method is a powerful tool for the design of high quality systems which provides simple, efficient and systematic approach to optimize designs for performance, quality and cost. Taguchi method is efficient method for designing process that operates consistently and optimally over a variety of conditions. The Taguchi experimental design is done for L8 Orthogonal array (OA) for mixed level design for four parameters which are spindle speed, feed, depth of cut and nose radius.
Minitab16 software was used for analyze the data.
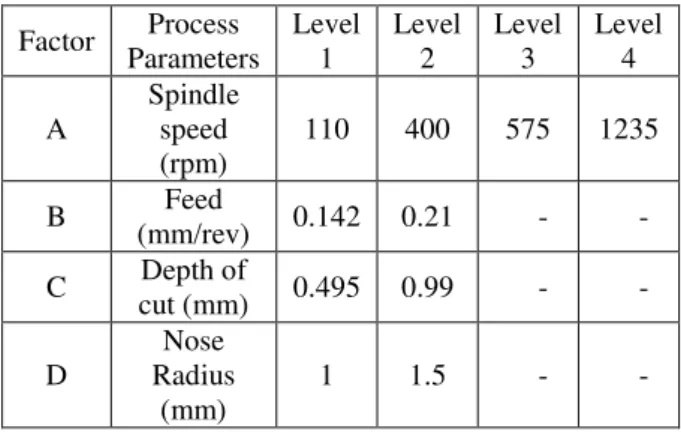
Table 1: Process Parameters
Factor Process Parameters
Level 1
Level 2
Level 3
Level 4
A
Spindle speed (rpm)
110 400 575 1235
B Feed
(mm/rev) 0.142 0.21 - -
C Depth of
cut (mm) 0.495 0.99 - -
D
Nose Radius
(mm)
1 1.5 - -
The experimental layout was developed
based on Taguchi‟s for mixed level design for four parameters L8 OA experimental technique. An L8 OA experimental setup was selected to satisfy the minimum number of experimental conditions for the factor and levels presented in table 2.
Table 2: Orthogonal Array Spindle
speed (A)
Feed (B)
DOC (C)
Nose Radius
(D)
1 1 1 1
1 2 2 2
2 1 1 2
2 2 2 1
3 1 2 1
3 2 1 2
4 1 2 2
4 2 1 1
V.
EXPERIMENTAL
DETAILS
The process parameters that are affecting the characteristics of turned parts are
Cutting Tool parameters e.g. tool geometry and tool material
Work related parameters such as hardness, ductility, metallographic etc.
Cutting parameters – Spindle speed, feed, and depth of cut.
Environmental parameters- Dry cutting, wet cutting.
The following process parameters are (controllable) selected for present work : Spindle speed (A), Feed (B), Depth of Cut (C), Nose radius (D).
The work material used was Al 6082 corresponds to the following standard designations and specifications:
AA6082
HE30
DIN 3.2315
EN AW-6082
ISO: Al Si1MgMn
A96082
Table 3: The Chemical composition of Aluminum alloy 6082
Element % Present
Si 0.7-1.3
Fe 0.5
Cu 0.1
Mn 0.4-1.0
Mg 0.6-1.2
Zn 0.2
Ti 0.1
Cr 0.25
Al Remaining
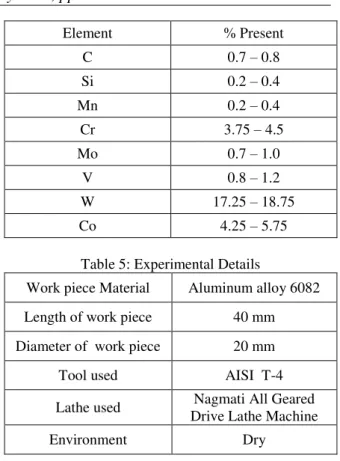
The Tool material used HSS grade (AISI T-4). The characteristic properties HSS Grades are working hardness, high wear resistance, high red hardness and excellent toughness.
Table 4: The Chemical composition of AISI T-4
Element % Present
C 0.7 – 0.8
Si 0.2 – 0.4
Mn 0.2 – 0.4
Cr 3.75 – 4.5
Mo 0.7 – 1.0
V 0.8 – 1.2
W 17.25 – 18.75
Co 4.25 – 5.75
Table 5: Experimental Details
Work piece Material Aluminum alloy 6082
Length of work piece 40 mm
Diameter of work piece 20 mm
Tool used AISI T-4
Lathe used Nagmati All Geared Drive Lathe Machine
Environment Dry
VI.
RESULTS
AND
DISCUSSION
Table 6: Experimental Result and Corresponding S/N Ratio
Sr. No.
Speed (A) rpm
Feed (B) mm/rev
DOC (C) mm
Nose Rad. (D) mm
MRR mm3/min
S/N for
MRR Ra
S/N for Ra
1 110 0.142 0.495 1 1149.43 61.14 9.45 -20.1716 2 110 0.21 0.99 1.5 3647.77 71.30 9.72 -19.0904
3 400 0.142 0.495 1.5 1904.76 65.66 4.01 -11.3999
4 400 0.21 0.99 1 6172.84 75.75 9.58 -20.2903
5 575 0.142 0.99 1 4444.44 73.02 7.44 -16.7685
6 575 0.21 0.495 1.5 3645.98 71.18 5.11 -14.8314
7 1235 0.142 0.99 1.5 8455.94 78.49 2.41 -8.3033
8 1235 0.21 0.495 1 6703.54 76.59 7.08 -16.3377
Table 7: ANOVA table for MRR
Variable factors DF SS MS F p Contribution (%) Speed (A) 3 28638513 9546171 10.29 0.224 67.04
Feed (B) 1 2221354 2221354 2.40 0.365 5.12
Depth of Cut (C) 1 10851511 10851511 11.70 0.181 25.4 Nose Radius (D) 1 83190 83190 0.09 0.815 0.002
Error 1 927298 927298
Table 8: ANOVA table for Ra
MINITAB 16 statistical software has been used for the analysis of the experimental data and provides the calculated results of signal-to-noise ratio. The average value of Signal to noise (S/N) ratios has been calculated to find out the effects of different parameters as well as their levels. The ANOVA (Analysis Of Variance) technique is help to determine which parameter is most significant. Where,
DF – Degree of freedom, SS – Sum of Square
MS – Mean of Square, F – Statistical parameter, P- Percentage 8000 7000 6000 5000 4000 3000 2000 1000
Speed (A )Feed (B) DOC (C ) 1 2 3 4 1 2 1 2 1 2 1 2 1 2 1 2 1 2 1 2 1 2 1 2 1 2 1 2 MRR 2 1 (D) Radius Nose Dotplot of MRR
Fig. 2: Dot plot for MRR
From figure 2. The highest MRR obtained at A4B1C2D2 and lowest MRR obtained at A1B1C1D1.
4 3 2 1 7000 6000 5000 4000 3000 2 1 2 1 7000 6000 5000 4000 3000 2 1 Speed (A) M e a n o f M e a n s Feed (B)
DOC (C) Nose Radius (D)
Main Effects Plot for Means of MRR
Data Means
Fig. 3: Main effects plot for means of MRR
The main effect plot for MRR is shown in figure 3. These show the variation of individual response with speed, feed, depth of cut (DOC), and nose radius parameters separately. The mean effects plots are used to determine the optimal conditions for MRR. According to main effects plots the optimal conditions for material removal rate are Cutting speed at level 4(1235 rpm)
Feed at level 2 (0.21 mm/rev.) DOC at level 2 (0.99 mm) Nose radius at level 1 (1 mm)
2
1 1 2 1 2
9000 6000 3000 9000 6000 3000 9000 6000 3000 Speed (A) Feed (B) DOC (C)
Nose Radius (D)
1 2 3 4 (A) Speed 1 2 (B) Feed 1 2 (C) DOC Interaction Plot for MRR
Data Means
Fig. 4: Interaction plot for MRR
2000 1000 0 -1000 -2000 99 90 50 10 1 Residual P e r c e n t 8000 6000 4000 2000 0 1000 0 -1000 Fitted Value R e s id u a l 1000 500 0 -500 -1000 -1500 3 2 1 0 Residual F r e q u e n c y 8 7 6 5 4 3 2 1 1000 0 -1000 Observation Order R e s id u a l
Normal Probability Plot Versus Fits
Histogram Versus Order
Residual Plots for MRR
Fig. 5: Residual plot for MRR
Source DF SS MS F P %
Contribution
Speed (A) 3 24.4898 8.1633 22.6 0.153 45.64
Feed (B) 1 8.3641 8.3641 23.15 0.130 15.59
DOC (C) 1 1.5313 1.5313 4.24 0.288 02.86
Nose Radius (D) 1 18.9113 18.9113 52.35 0.087 35.24
Error 1 0.3612 0.3612
From figure 5 the residual spread along straight line that suggest that the residual are distributed normally and it is clear that no obvious pattern and unusual structure. This implies that the model proposed is adequate.
Fig. 6: Significance of machine parameter for MRR
From the ANOVA table 7, the most significant factor for the MRR is Speed (A) and its contribution is 67.04% . After that second significant factor for MRR is DOC (C) and its contributions is about 25.4%. Other factors are having less significant effects since „p‟ value are more than 0.05 for the cofidence level 95%.
10 9 8 7 6 5 4 3 Speed (A) Feed (B) DOC (C)
1 2 3 4 1 2 1 2 1 2 1 2 1 2 1 2 1 2 1 2 1 2 1 2 1 2 1 2 Ra 2 1 (D) Radius Nose
Dotplot of Ra
Fig. 7: Dot plot for Ra
From figure 7. The optimal Ra obtained at A4B1C2D2 and lowest MRR obtained at A1B2C2D2.
4 3 2 1 9 8 7 6 5 2 1 2 1 9 8 7 6 5 2 1 Speed (A) M e a n o f M e a n s Feed (B)
DOC (C) Nose Radius (D) Main Effects Plot for Means for Ra
Data Means
Fig. 8: Main effects plot for means of Ra
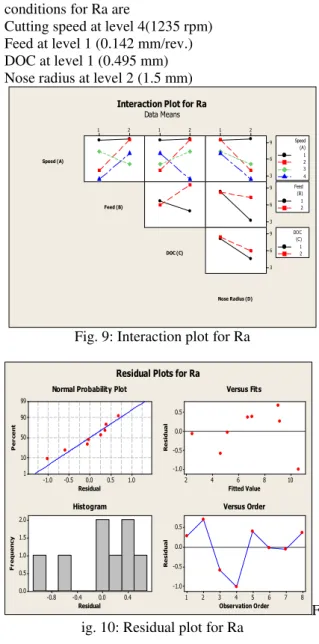
The main effect plot for Ra is shown in figure 8. According to main effects plots the optimal conditions for Ra are
Cutting speed at level 4(1235 rpm) Feed at level 1 (0.142 mm/rev.) DOC at level 1 (0.495 mm) Nose radius at level 2 (1.5 mm)
2
1 1 2 1 2
9 6 3 9 6 3 9 6 3 Speed (A) Feed (B) DOC (C)
Nose Radius (D)
1 2 3 4 (A) Speed 1 2 (B) Feed 1 2 (C) DOC
Interaction Plot for Ra Data Means
Fig. 9: Interaction plot for Ra
1.0 0.5 0.0 -0.5 -1.0 99 90 50 10 1 Residual P e r c e n t 10 8 6 4 2 0.5 0.0 -0.5 -1.0 Fitted Value R e s id u a l 0.4 0.0 -0.4 -0.8 2.0 1.5 1.0 0.5 0.0 Residual F r e q u e n c y 8 7 6 5 4 3 2 1 0.5 0.0 -0.5 -1.0 Observation Order R e s id u a l
Normal Probability Plot Versus Fits
Histogram Versus Order
Residual Plots for Ra
F ig. 10: Residual plot for Ra
From figure 10 the residual spread for Ra lie along straight line that suggest that the residual are distributed normally and it is clear that no obvious pattern and unusual structure that suggest the model proposed is adequate.
20 15 10 5 0 99 95 90 80 70 60 50 40 30 20 10 5 1 Ra P e rc e n t Mean 6.85 StDev 2.769 N 8
A D 0.344 P-Value 0.386
Probability Plot of Ra Normal - 95% CI
Figure 11 shows that the all value are within the confidence interval of 95%. Two lines from the center line indicates the upper and lower limit of confidence interval. No, value out of the confidence interval. This tendency gives the better result for future predictions
Fig. 12: Significance of machine parameter for Ra
From the ANOVA table 8, the most significant factor for the Ra is Speed (A) and its contribution is 45.64%. After that second significant factor for Ra is Nose radius (D) and its contributions is about 35.24%. Other factors are
having less significant effects since „p‟ value are
more than 0.05 for the cofidence level 95%.
VII.
MATHEMATICAL
MODELING
The multiple linear regression model developed for material removal rate and surface roughness (Ra) using the MINITAB 16. The predictors are speed, feed, DOC and nose radius. The regression equation for
MRR = - 4141 + 1555 Speed (A) + 1054 Feed (B) + 2329 DOC (C) - 204 Nose Radius (D)
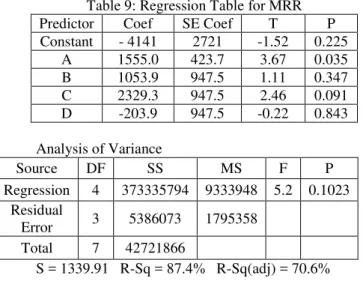
Table 9: Regression Table for MRR Predictor Coef SE Coef T P Constant - 4141 2721 -1.52 0.225
A 1555.0 423.7 3.67 0.035 B 1053.9 947.5 1.11 0.347 C 2329.3 947.5 2.46 0.091 D -203.9 947.5 -0.22 0.843
Analysis of Variance
Source DF SS MS F P Regression 4 373335794 9333948 5.2 0.1023
Residual
Error 3 5386073 1795358 Total 7 42721866
S = 1339.91 R-Sq = 87.4% R-Sq(adj) = 70.6%
The significance of each coefficient in the equation and the regression model were analyzed by ANOVA and tested by the p value and statistics and ANOVA results for regression models are reported in the table 9. Regression statistics indicate that coefficients for speed is statistically significant. ANOVA results of the regression shows that regression model for Ra is statistically significant at 95% confidence level (p < 0.05). The standard deviation of error is 1339.91. The value of R-Sq (87.4%) implies that 87.4% of variation in response values can be explained by the variations in the control factors considered. The value of R-Sq (adj) is 70.6 %. A high value of determination coefficient confirms model adequacy, goodness of fit and high significance of model. This indicates that the regression model for the response can be used for determining and estimating MRR.
The regression equation for surface roughness is
Ra = 10.8 - 1.50 Speed (A) + 2.05 Feed (B) + 0.875 DOC (C) - 3.07 Nose Radius (D)
Table 10: Regression Table for Ra Predictor Coef SE Coef T P Constant 10.842 1.751 6.19 0.008 A -1.504 0.2727 -5.52 0.012 B 2.045 0.6098 3.35 0.044 C 0.875 0.6098 1.43 0.247 D -3.075 0.6098 -5.04 0.015 Analysis of Variance
Source DF SS MS F P
Regression 4 51.427 12.857 17.29 0.021
Residual
Error 3 2.231 0.744
Total 7 53.658
S = 0.862340 R-Sq = 95.8% R-Sq(adj) = 90.3%
regression model for the response can be used for determining and estimating Ra.
VIII.
CONCLUSION
The present study was carried out to study the effect of input parameters on the material removal rate and surface roughness. The following conclusions have been drawn from the study: 1. The Material removal rate is mainly affected by
spindle speed and depth of cut and for surface roughness the most significant factors are cutting speed and nose radius.
2. The least significant factor for MRR is nose radius and for surface roughness is DOC. 3. Linear regression model constructed is used to
predict MRR and surface roughness Ra. 4. The parameters considered in the experiments
are optimized to attain maximum material removal rate. The best setting of input process parameters for turning (maximum material removal rate) within the selected range is as follows:
i) Spindle speed i.e. 1235 rpm. ii) Feed rate i.e. 0.142mm/rev. iii) Depth of cut should be 0.99 iv) Nose radius 1.5 mm.
5. The best setting of input process parameters for surface roughness in turning within the selected range is as follows:
i) Spindle speed i.e. 1235 rpm. ii) Feed rate i.e. 0.142mm/rev. iii) Depth of cut should be 0.495 iv) Nose radius 1.5 mm.
R
EFERENCES[1] Upinder Kumar Yadav, Deepak Narang & Pankaj Sharma Attri, Experimental investigation and Optimization of machine parameters for surface roughness in CNC turning by Taguchi method, International Journal of Engineering Research and
Application”, vol. 2, Issue 4, July-August 2012, pp 2060-2065.
[2] Narayana B. Doddapattar, Chetana S. Batakurki, Optimization Of Cutting Parameters For Turning Aluminum Alloys Using Taguchi Method, International Journal of Engineering Research & Technology, Vol. 2 Issue 7, July – 2013. [3] ASM Metals Handbook Vol. 2, Properties
and Selection of Nonferrous Alloys and Special Purpose Materials, ASM International.
[4] M. Kaladhar, Subbaiah, V.S., Rao, Ch. S., & Rao, K.N., Optimization of process parameters in turning of AISI 202 Austenitic Stainless Steel, ARPN Journal
of Engineering and Applied Sciences, 5(9) 2010, 79-87.
[5] Mohan Singh, Dharmpal Deepak , Manoj Kumar Singla, Manish Goyal and Vikas Chawla, An Experimental Estimate Mathematical Model Of Surface Roughness For Turning Parameters On CNC Lathe Machine, National Conference on Advancements and Futuristic Trends in Mechanical and Materials Engineering, February 19-20, 2010.
[6] A. Y. Mustafa and T. Ali, Determination and optimization of the effect of cutting parameters and work piece length on the geometric tolerances and surface roughness in turning operation, International Journal of the Physical Sciences Vol. 6(5), 4 March, 2011, pp. 1074-1084,
[7] H.M.Somashekara, Optimizing Surface Roughness in Turning Operation Using Taguchi Technique And ANOVA, International Journal of Engineering Science and Technology.vol 4, No.5, May 2012.
[8] Vipindas M P & Dr. Govindan P, Taguchi-Based Optimization of Surface Roughness in CNC Turning Operation, International Journal of Latest Trends in Engineering and Technology, vol 2, issue 4, July 2013, pp. 454-463.
[9] Patel K. P., Experimental Analysis On Surface Roughness Of CNC End Milling Process Using Taguchi Design Method, International Journal of Engineering Science and Technology, vol 4, No. 2, Feb 2012.
[10] Suleiman Abdulkareem, Usman Jibrin Rumah & Apasi Adaokoma, Optimizing Machining Parameters during Turning Process, International Journal of Integrated Engineering, Vol. 3 No. 1 (2011) p. 23-27
[11] G. Harinath Gowd, M. Gunasekhar Reddy, Bathina Sreenivasulu & Rayudu Peyyala, Experimental Investigations on the Effects of Cutting Variables on the Material removal rate and Tool wear for AISI SI steel, International Journal of Applied
Research”, Volume 3, Issue: 5, May 2013, pp. 211-213.
[13] Srinivas Athreya, & Dr Y.D.Venkatesh,
“Application Of Taguchi Method For
Optimization Of Process Parameters In Improving The Surface Roughness Of
Lathe Facing Operation”, International
Refereed Journal of Engineering and Science Volume 1, Issue 3 (November 2012), PP.13-19
[14] J.S. Senthilkumar, Selvarni P. and Arunachalam R.M., Selection of machining parameters based on the analysis of surface roughness and flank wear in finish turning and facing of inconel 718 using taguchi technique, Emirates Journal for Engineering Research, 15 (2), 7-14 (2010) [15] Krishankant, Jatin Taneja, Mohit Bector &
Rajesh Kumar, Application of Taguchi Method for Optimizing Turning Process by the effects of Machining Parameters, International Journal of Engineering and Advanced Technology, Volume-2, Issue-1, October 2012, pp. 263-274.
[16] Hardeep Singh, Rajesh Khanna, M.P. Garg, Effect of Cutting Parameters on MRR and Surface Roughness in Turning EN-8, Current Trends in Engineering Research Vol.1, No.1 (Dec. 2011)
[17] Suleiman Abdulkareem, Usman Jibrin Rumah and Apasi Adaokoma, Optimizing Machining Parameters during Turning Process, International Journal of Integrated Engineering, Vol. 3 No. 1 (2011) p. 23-27.
[18] E. Daniel Kirby, A Parameter Design Study in a Turning Operation Using the Taguchi Method, the Technology Interface/Fall 2006
[19] Atul Kumar, Dr. Sudhir Kumar, Dr. Rohit Garg, Statistical Modeling Of Surface Roughness In Turning Process, International Journal of Engineering Science and Technology Vol. 3 No. 5 May 2011
[20] Mustafa Gunay & Emre Yucel, Application of Taguchi method for determining optimum surface roughness in turning of high alloy white cast iron, Elsevier Journal , Measurement 46, 2013, pp. 913–919 [21] Ross Philip J, Taguchi techniques for
quality engineering (M C Graw-Hill book company, New York), 1996.
[22] Roy, R. K. (2001). Design of experiments using the Taguchi approach: 16 steps to product and process improvement. New York: Wiley.
[23] H Singh, optimization of machining parameter for turned parts through