Relationship Between Left Atrial Volume and Diastolic Dysfunction in
500 Brazilian Patients
Lilia Maria Mameri El Aouar
1,2, Diana Meyerfreud
3, Pedro Magalhães
3, Sérgio Lamêgo Rodrigues
3, Marcelo Perim
Baldo
3, Yara Brasil
3, Sumaya Mameri El Aouar
2, Nabih Amin El Aouar
2, José Geraldo Mill
3, Orlando Campos Filho
1 Escola Paulista de Medicina-UNIFESP1, São Paulo, SP; Medcenter Cardiologia2, Vila Velha, ES; Universidade Federal do Espirito Santo3, Vitória, ES – BrazilMailing Address: Orlando Campos Filho •
Rua Agnaldo Manoel dos Santos, 65, Apto. 81, Jardim Vila Mariana. Postal Code 04116-250, São Paulo, SP - Brazil E-mail: ocampos@cardiol.br
Manuscript received November 16, 2012; revised manuscript February 26, 2013; accepted February 26, 2013.
DOI: 10.5935/abc.20130109
Abstract
Background: Left atrial volume index (LAVI) increase has been associated to left ventricle (LV) diastolic dysfunction (DD), a marker of cardiovascular events (atrial fibrillation, stroke, heart failure, death).
Objective: To evaluate the relationship between LAVI and diferente grades od DD in Brazilian patients submitted to echocardiogram, studying LAVI increase determinants in this sample.
Methods: We have selected 500 outpatients submitted to echocardiography, after excluding arrhythmia, valvar or congenital cardiopathy, permanent pacemaker or inadequate ecocardiographic window. LAVI was obtained according to Simpson’s method. DD was classified according to current guidelines. The clinical and echocardiographic variables were submitted to linear regression multivariate analysis.
Results: Mean age was 52 ± 15 years old, 53% were male, 55% had arterial hypertension, 9% had coronary artery disease, 8% were diabetic, 24% were obese, 47% had LV hypertrophy. The mean ejection fraction of the left ventricle was 69.6 ± 7,2%. The prevalence of DD in this sample was 33.8% (grade I: 66%, grade II: 29% e grade III: 5%). LAVI increased progressively according to DD grade: 21 ± 4 mL/m² (absent), 26 ± 7 mL/m² (grade I), 33 ± 5 mL/m² (grade II), 50 ± 5 mL/m2 (grade III) (p < 0,001). In this sample, LAVI increase independent predictors were age, left ventricular mass, relative wall thickness, LV ejection fraction and E/e’ ratio.
Conclusion: DD contributes to left atrial remodeling. LAVI increases as an expression of DD severity and is independently associated to age, left ventricle hypertrophy, systolic dysfunction and increased LV filling pressures. (Arq Bras Cardiol. 2013;101(1):52-58)
Keywords: Ventricular Dysfunction; Stroke Volume; Atrial Function, Left; Brazil.
more accurate index for the detection of left atrial dilation, superior than the simple anteroposterior diameter derived by the M-mode echo3. LAVI has been suggested as a marker of the severity and duration of DD, as ell as predictor of cardiac events such as atrial fibrillation, heart failure and embolic stroke2. Besides that, it has been considered on the evaluation criteria of the DD grade and LV filling pressure estimates7.
Although some studies performed abroad associate LAVI increase to DD severity2, we do not have exclusively national data on this subject in a great number of patients from a Brazilian population.
This study’s objectives were: 1) to evaluate the relationship between LAVI and the various DD degrees in a series of outpatients with preserved or slightly reduced systolic function submitted to ECHO in a Brazilian cardiologic diagnostic center; 2) to identify the clinical and echocardiographic variables independently associated to LAVI increase in this subset of patients.
Introduction
Diastolic dysfunction (DD) is very common, especially in the elderly, and is considered an important prognostic indicator of various cardiac diseases1. It is a major cause of heart failure and has been associated to atrial fibrillation development2. The prevalence of asymptomatic DD is approximately 25% to 30% of the individuals older than 45 years in the general population3. Symptomatic DD can occur in association to left ventricular (LV) systolic dysfunction or be a determinant of heart failure with preserved systolic function (ejection fraction >50%), which is responsible for 51% of the heart failure cases4,5.
In medical practice, DD has been identified in a simple and innocuous matter by eco-Doppler-cardiography (Eco)6 and characterized by the analysis of the mitral diastolic flow by pulsatile Doppler and the study of the mitral ring velocity by tissue Doppler7.
Methods
Patients
Five hundred forty five consecutive patients in whom a transthoracic echo was indicated were studied at Medcenter Cardiologia, Vila Velha. The eligible patients were adults aged 20 to 86 years, who presented sinus rhythm and had no history of atrial or ventricular arrhythmia, pacemaker use, valvular disease (other than mild) or congenital cardiopathy. Forty five individuals were excluded since their exams were not adequate for analyzing mitral diastolic flow (n = 35) or LAVI (n = 10). The 500 remaining patients comprised the final sample for this study. The research was approved by the Ethics Committee of Unifesp (Escola Paulista de Medicina) and all patients signed an informed consent document.
Height, weight, heart rate and blood pressure were measured on the same day of the echocardiographic exam. Arterial hypertension was defined by the history, systolic
levels ≥ 140 mmHg and/or diastolic levels ≥ 90 mmHg on
at least two occasions. The diagnosis of diabetes mellitus was based on fasting glucose levels > 125 mg/dl or oral hypoglycemic drug and/or insulin use. Dyslipidemia was defined as total cholesterol levels > 200 mg/dl and/or LDL cholesterol > 130 mg/dl or hypolipidemic agents. Individuals who smoked at time the study was performed were considered
smokers. Body mass index ≥ 30 was considered indicative
of obesity. Coronary artery disease was defined by medical history, electrocardiographic data or presence of segmental contractile dysfunction at the echocardiogram in individuals with risk factors.
Echocardiography
The exam was performed with Philips Envisior, CHD device and a P 4 - 2 MHz transducer. Images were obtained of the transversal and longitudinal parasternal, 4-chamber, 2-chamber and 5-chamber slices. LV ejection fraction, myocardial wall thickness and left ventricular mass were measured with M-mode echo. LV hypertrophy was diagnosed
when LV mass index was ≥ 95 g/m² (women) or ≥ 115 g/m²
(men)8. LV ejection fractions > 0.50 were considered normal. Diastolic function was analyzed according to the transmitral flow pattern at rest and during Valsalva maneuver, when necessary. Peak E-wave velocity, A-wave, E/A ratio and mitral flow deceleration time were measured by pulsed Doppler. Isovolumetric relaxation time and pulmonary vein flow could not be obtained in all patients, and were not used in the analysis. Tissue Doppler was performed in order to obtain septal wall e’ wave velocity at the mitral valve anulus level. All tissue and pulsatile Doppler variables resulted from the mean measurement of three consecutive cardiac cycles. The ratio between mitral and tissue (e’) E-wave peak was calculated and expressed as E/e’.
Left atrial anteroposterior diameter was obtained by M-mode echo. Using bidimensional echo, LAVI was calculated by the mean volumes obtained by Simpson method at 2- and 4-chamber apex slices, considering maximum atrial area before ventricular systole and mitral opening, and excluding left atrial appendage and pulmonary vein confluency9. The difference
in left atrial volumes between both measurements was inferior
to 5%. LAVI was considered normal if 16-28 mL/m²; slightly increased, 29-33 mL/m²; moderate, 34-39 mL/m²; and severe. ≥ 40 mL/m² 8.
All echocardiographic exams were performed and interpreted by a single investigator, blind to clinical data. Left ventricle volume and diastolic function measurements were analyzed separately. The diastolic dysfunction patter was classified according to previously published and validated guidelines7. Diastolic dysfunction as classified in increasing severity grades, such as: absent or normal (0), abnormal relaxation (grade I), pseudo normal (grade II) and left ventricular restriction (grade III). LV filling pressures were
considered high if E/e’ ratio was ≥ 15 and normal if it was
< 8. Filling pressures were considered “undetermined” if E/e’ ratio was 8-157.
Statistical analysis
Prevalence differences between categorical variables were tested by Chi square test. Differences between continuous variables were tested by t Student test and one-way variance analysis (ANOVA) followed by Tukey post-hoc test. Simple associations between LAVI and clinical and echocardiographic variables were estimated by Pearson’s correlation coefficient. Multivariate linear regression was done to determine independent predictors of LAVI increase, including in the model only variables with statistically significant partial correlations. Statistical hypotheses were tested in two-tailed tests with 5% type I error (p < 0.05). ROC curves were obtained for determining sensitivity and specificity of LAVI for the diagnostic of different grade LVDD. The best cutoff was defined as the one which presented the higher simultaneous sensitivity and specificity in the ROC curve. Statistical analysis was done by SPSS software (version 13.0).
Results
On the global 500 patient set, 53% were men aged 20-86 years old (mean 52.6 ± 13 years); 55.4% were hypertensive, 8.6% diabetic; 9.4% smokers; 24.8% obese and 47.8% had LV hypertrophy. Patients with preserved LV systolic function (98% of the cases) with mean ejection fraction of 69.6 ± 7.2% (range, 21% - 89%) predominated.
DD was present in 169 patients in this set, which represented a 33.8% prevalence, distributed as: grade I = 66%, grade II = 29%, grade III = 5%.
The demographic and clinical characteristics of the sample, according to different grade DD, are shown in Table 1. Hypertension, smoking and LV hypertrophy were more prevalent in the DD group in comparison to the group with normal diastolic function (p< 0.001). Age and left ventricular mass were higher in the DD groups as compared to the normal function group. The ejection fraction was markedly reduced only in the grade III DD group (ventricular filling restriction pattern).
Echocardiographic variables, including LAVI, are presented in Table 2, according to DD grades. LAVI and dimensions
Table 1 – Demographic and clinical characteristics of the normal diastolic function group and the diastolic dysfunction groups
Parameters Normal
(n = 331)
DD grade I (n = 111)
DD grade II (n = 49)
DD grade III (n = 9)
Age (years) Variation 47.1 ± 13.8
(16 – 80)
64.4 ± 10.6* (38 – 84)
60.2 ± 10.9 * (37 – 83)
70.6 ± 15.3**‡ (47 – 86)
Weight (kg) 73.5 ± 16 78.8 ± 16.8 83.8 ± 20.6 70.2 ± 17.4
Height (m) 166.7 ± 9.6 164.2 ± 9.5 166.9 ± 10.6 163.4 ± 12.1
BMI (kg/m2) 26.4 ± 4.9 29.1 ± 4.8 29.9 ± 5 26.2 ± 5.7
Men (%) 162 (48.9%) 66 (59.5%) 32 (65.3%) 5 (55.6%)
Smokers (%) 21 (6.3%) 15 (13.5%)* 10 (20.4%)* 1 (11.1%)
Arterial hypertension (%) 143 (43.2%) 86 (77.5%)* 43 (87.8%)* 5 (55.6%)
Diabetes Mellitus (%) 13 (3.9%) 16 (14.4%) 13 (26.5%) 1 (11.1%)
Obesity (%) 57 (17.2%) 44 (39.6%) 21 (42.9%) 2 (22.2%)
LVH (%) 112 (33.8%) 83 (75.5%)* 45 (71.4%)* 9 (100%)
EF% 70.7 ± 5.5 69.1 ± 6.4 68.8± 7.4 43.8 ± 15.9**‡
LV mass 182.1 ± 64.8 248 ± 78.2** 261.6 ± 75.2** 318.3 ± 89.9**‡
LV mass/ht2,7 47.6 ± 17.8 67.8 ± 20.1** 65.2 ± 18.4** 86.4 ± 26.8**‡
DD: diastolic dysfunction LVH: left ventricular hypertrophy; BMI: body mass index; EF: ejection fraction; LV: left ventricule; ht: height. The data were presented as
mean ± DP. * p < 0.05 e ** p < 0.01 vs. N, p < 0.05 vs. DD grande I and p < 0.05 vs. DD grade II.
Table 2 – Demographic and clinical characteristics of the normal diastolic function group and the diastolic dysfunction groups
Variables Normal
(n = 331)
DD grade I (n = 111)
DD grade II (n = 49)
DD grade III (n = 9)
Structure
LA (mm) 3.4 ± 0.4 3.6 ± 0.4* 4.1 ± 0.4** 5.0 ± 0.6**‡
LAV (mL) 39.3 ± 9.3 48.2 ± 14.7* 64.7 ± 11** 88.9 ±12.5**‡
LAVI (mL/m²) 21.6 ± 4.2 26.1 ± 7.5* 33.4 ± 4.6** 50.4 ± 2.8**‡
LVDD (mm) 5.0 ± 0.5 5.2 ± 0.5 5.4 ± 0.8 6.5 ± 1.2**‡
LVSD (mm) 3.1 ± 2.1 3.2 ± 0.5 3.3 ± 0.6 5.0 ± 1.4**‡
IVS (mm) 1.0 ± 0.9 1.1 ± 0.2 1.2 ± 0.3 1.9± 2.7*
LVPW (mm) 1.0 ± 0.9 1.2 ± 1.1 1.1 ± 0.1 2.0 ± 2.9**
RWT 0.36 ± 0.1 0.42 ± 0.1 0.42 ± 0.1 0.32 ± 0.1**‡
Mitral Doppler
E (m/s) 79 ± 18 58.8 ± 11.6** 82.7 ± 13.9 98.6 ± 32.1*‡
A (m/s) 64.7 ± 17 87.3 ± 18.4 74.3 ± 18 50.9 ± 16**‡
E/A 1.29 ± 0.5 1.3 ± 7.4** 1.16 ± 0.2 2.1 ± 0.8**‡
DT (ms) 156 ± 25 226 ± 34** 172 ± 20 137 ± 12**‡
Tissue Doppler
e’ (m/s) 11.5 ± 4.1 7.4 ± 7.1** 7.2 ± 1** 5.9 ± 1.2**
E/e’ 7.1 ± 2 8.8 ± 2.1* 11.3 ± 2.5** 16.1 ± 2.6**‡
DD: diastolic dysfunction; LA: left atrium; LAV: left atrial volume; LAVI: left atrial volume; LVDD: left ventricle diastolic diameter; LVSD: left ventricle systolic diameter; IVS: intraventricular septum; LVPW: left ventricle posterior wall; RWT: relative wall thickness E: mitral low protodiastolic velocity; A: mitral low telediastolic velocity; E/A: ratio between E and A waves; e: septal mitral anulus protodiastolic velocity; E/e’: ratio between E and e’ waves. The data were presented as mean ± DP. * p < 0.05
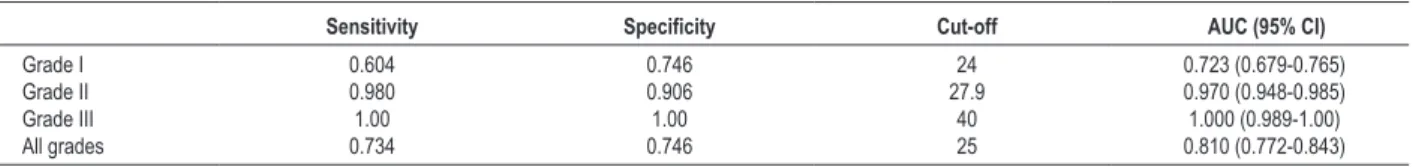
50.5 ± 5 mL/m2 (grade III) (p < 0.001).Figure 1 shows LAVI behavior in relation to DD: increasing LAVI values occurred as DD worsened. Still in Table 2, as expected, there was a relative decrease of the E-wave and E/A ratio, and an increase of the mitral deceleration time in the grade I DD groups (altered relaxation) in comparison to the group with normal diastolic function; the opposite was observed in the group with grade III DD (restrictive pattern). The e’ wave was significantly smaller in all DD grades, in comparison to the group with preserved diastolic function. Progressive increase of the E/e’ ratio was observed with worsening DD. LAVI ROC curve analysis in the whole sample showed
73.4% sensitivity and 74.6% specificity (LAVI ≥ 25 mL/m²) for
DD detection (Table 3). However, when evaluated separately, a progressive increase of LAVI power for DD detection was observed (Fig. 2). For grade I DD, we found 60.45 sensitivity
and 74.6¨% specificity for LAVI = 24 mL/m². The curve
showed excellent performance for identification of grade II DD
(AUC = 0.970) with LAVI≥ 27,9 mL/m² showing 98% sensitivity and 90.6% specificity. For grade III DD, LAVI≥ 40 mL/m² was
100% sensible and specific.
LAVI was ≥ 34 mL/m² in almost all cases with high LV filling pressure, i.e., E/e’ ratio ≥ 15.
Table 4 shows the results of the univariate analysis of LAVI and the other clinical and echocardiographic variables that were analyzed. There was a significant and direct correlation of LAVI and age, LV diastolic and systolic
volumes, LV wall relative thickness, LV mass indexed to height raised to 2.7 power and E/e’ ratio (p < 0.01). There was an inverse and significant correlation between LAVI and LV ejection fraction; the same occurred for e’ wave and septal mitral anulus.
In the stepwise multivariate analysis, the factors that remained in the model and explain 575 of LAVI variability were age, LV mass indexed for height raised to 2.7 power, relative wall thickness, E/e’ ratio and LV ejection fraction.
Discussion
This was one of the first studies based on the Brazilian population to demonstrate progressive increase in left atrial volume with worsening diastolic dysfunction in adults with relatively preserved systolic function and representative occurrence of cardiovascular disease risk factors. Additionally, we were able to verify in this series the independent predictors of LAVI increase, related to known risk factors such as age and LV hypertrophy and systolic dysfunction.
Our main finding was the demonstration of the direct influence DD exerts on left atrial remodeling, as previously observed2. These results reinforce the concept of the prognostic role of left atrial dilation as cardiovascular event marker (as exemplified by atrial fibrillation and heart failure)2, associated to other risk factors traditionally linked to bad prognosis (age, LV hypertrophy, LV dysfunction and increased E/e’ ratio).
Figure 1 – Left atrial volume index and different diastolic dysfunction grades. Data presented as mean and 95% conidence interval.
LA
VI (mL/m
2
)
Normal
Grade I
Grade II
Grade III
Diastolic Function
60
55
50
45
40
35
30
25
20
15
Left atrial remodeling can be seen in various cardiac diseases, resulting from volumetric or pressoric hemodynamic overload. DD represents an additional component to left atrial remodeling. In DD, abnormal LV relaxation and reduced LV compliance occur as a consequence of modifications in the interaction between actin and myosin, increased collagen deposition and cardiac viscoelastic properties changes10. On the initial DD phases (grade I), there is only increased participation of left atrial active contraction, which becomes more vigorous in order to surpass the relaxation difficulty, leading to A wave increase in mitral Doppler, without evident structural alterations in this chamber. With the progression of DD, this compensatory mechanism fails and the total atrial filling capacity is compromised, leading to atrial remodeling. Left atrial pressure increases to maintain adequate left ventricular filling, leading to increasing tension at the atrial walls, chamber dilation and atrial myocardial stretching. LAVI increase reflects, thus, the chronic exposure of the left atrium to high LV filling pressures and DD severity2.
In the present study, LAVI mean value in persons with
normal diastolic function was 21 ± 4 mL/m². This value is
very close to the ones found in normal adults, which show
values between 20 ± 6 and 21 ± 7 mL/m² 8,9.
We have also established LAVI cutoff values associated
to grade ≥ ll grade DD with high accuracy. In our study,
as well as Pritchett et al11 study, which included 2042 subjects, and the study by Tsang et al2, LAVI showed good sensitivity and specificity in the identification of intermediate (II) and severe (II) grade DD, although the values were inferior to ours. Differences in the selection of cases may justify the differences. These data highlight the use of this index in daily practice as an additional criterion to the other variables of mitral diastolic flow pattern for DD analysis. One must remember that mitral flow pulsatile Doppler elements express pressoric gradients that reflect the hemodynamic moment. On the other side, structural changes in the left atrium are caused by pressure increase sustained through time. Thus, the study of the
Table 3 – Parameters obtained from ROC curves for each diastolic dysfunction grade
Sensitivity Speciicity Cut-off AUC (95% CI)
Grade I Grade II Grade III All grades
0.604 0.980 1.00 0.734
0.746 0.906 1.00 0.746
24 27.9
40 25
0.723 (0.679-0.765) 0.970 (0.948-0.985) 1.000 (0.989-1.00) 0.810 (0.772-0.843)
AUC: area under the curve; CI: conidence interval.
Table 4 – Univariate analysis between LAVI and the other variables that were evaluated
Variables r p
Age 0.365** < 0.001
BMI 0.072 0.155
Height -0.037 0.414
Weight 0.134 0.003
LA 0.611** < 0.001
LVDD 0.381** < 0.001
LVSD 0.145** 0.001
RWT 0.160* < 0.001
LV mass 0.441** < 0.001
LV mass/ht2.7 0.454** < 0.001
LV ejection fraction -0.297** < 0.001
E 0.050 0.267
A 0.157** < 0.001
E/A -0.020 0.655
e’ -0.239** < 0.001
E/e’ 0.470** < 0.001
transmitral flow and mitral anulus velocities by pulsed Doppler, associated to LAVI measurement, could better differentiate the most advanced stages of DD, especially grade II dysfunction or the so-called pseudo normal left ventricle filling pattern12.
We have identified, using multivariate analysis, that age, LV hypertrophy (left ventricular mass and relative wall thickness), E/e’ ratio and LV ejection fraction as the determinant factors for LAVI increase in this population. VE DD prevalence increases with age and advanced age is admittedly associated to more severe DD presentation12, justifying this finding. LV hypertrophy is also admittedly a factor intimately related to DD13. These elements may have had greater participation in the most severe DD presentations (grades II and III), associated to systolic dysfunction and left ventricular remodeling with higher filling pressures.
Limitations
The data from the present study may not be applicable to patients with atrial fibrillation, since they were obtained exclusively in sinus rhythm. It is unlikely that mitral insufficiency has influenced LAVI increase in our series, since we have excluded significant primary valvular disease, especially mitral valve disease, that are associated to greater impact in left atrial remodeling.
The fact that we have included only outpatients with less severe cardiac disease and smaller prevalence of severe DD can be considered a limitation of this study. However, it reflects the natural occurrence of milder DD without significant systolic dysfunction, as seen in daily practice.
Conclusion
This study in a Brazilian population suggests that DD contributes to left atrial remodeling and LAVI increase is an expression of DD severity. LAVI increase determinants in this sample with preserved or slightly reduced mean ejection fraction and no significant valvular heart disease are partly related to age, left ventricular hypertrophy, increased filling pressure and decreased LV systolic function.
Author contributions
Conception and design of the research: El Aouar LMM, Meyerfreud D, Mill JG; Acquisition of data and Obtaining funding: El Aouar LMM, El Aouar NA; Analysis and interpretation of the data: El Aouar LMM, Meyerfreud D, Mill JG, Campos Filho O; Statistical analysis: Magalhães P, Rodrigues SL, Baldo MP; Writing of the manuscript: El Aouar LMM, Meyerfreud D, Brasil Y, El Aouar SM, Campos Filho O, Baldo MP; Critical revision of the manuscript for intellectual content: Mill JG, Campos Filho O.
Potential Conflict of Interest
No potential conflict of interest relevant to this article was reported.
Figure 2 – ROC curves for LAVI for the identiication of different diastolic
dysfunction grades.
Grade I
100
80
60
40
20
0
0
20
40
60
80
100
Sensibility
100 - Speciity
Grade II
100
80
60
40
20
0
0
20
40
60
80
100
Sensibility
100 - Speciity
Grade III
100
80
60
40
20
0
0
20
40
60
80
100
Sensibility
1. G r o s s m a n W. D e f i n i n g d i a s t o l i c d y s f u n c t i o n . C i r c u l a t i o n . 2000;101(17):2020-1.
2. Tsang TS, Barnes ME, Gersh BJ, Bailey KR, Seward JB. Left atrial volume as a morphophysiologic expression of left ventricular diastolic dysfunction and relation to cardiovascular risk burden. Am J Cardiol. 2002;90(12):1284-9.
3. Lester SJ, Tajik AJ, Nishimura RA, Oh JK, Khandheria BK, Seward JB. Unlocking the mysteries of diastolic function: deciphering the Rosetta Stone 10 years later. J Am Coll Cardiol. 2008;51(7):679-89.
4. Gottdiener JS, McClelland RL, Marshall R, Shemanski L, Furberg CD, Kitzman DW, et al. Outcome of congestive heart failure in elderly persons: influence of left ventricular systolic function. The cardiovascular Health Study. Ann Intern Med. 2002;137(8):631-9.
5. Vasan RS, Larson MG, Benjamin EJ, Evans JC, Reiss C, Levy D. Congestive heart failure in subjects with normal versus reduced left ventricular ejection fraction: prevalence and mortality in a population-based cohort. J Am Coll Cardiol. 1999;33(7):1948-55.
6. Paulus WJ, Tschöpe C, Sanderson JE, Rusconi C, Flachskampf FA, Rademakers FE, et al. How to diagnose diastolic heart failure: a consensus statement on the diagnosis of heart failure with normal left ventricular ejection fraction by the Heart Failure and Echocardiography Associations of the European Society of Cardiology. Eur Heart J. 2007;28(20):2539-50.
7. Nagueh SF, Appleton CP, Gillebert TC, Marino PN, Oh JK, Smiseth OA, et al. Recommendations for the evaluation of left ventricular diastolic function by echocardiography. J Am Soc Echocardiogr. 2009;22(2):107-33.
8. Lang RM, Bierig M, Devereux RB, Flachskampf FA, Foster E, Pellikka PA, et al. Chamber Quantification Writing Group; American Society of Echocardiography’s Guidelines and Standards Committee; European Association of Echocardiography. Recommendations for chamber quantification: a report from the American Society of Echocardiography’s Guidelines and Standards Committee and the Chamber Quantification Writing Group, developed in conjunction with the European Association of Echocardiography, a branch of the European Society of Cardiology. J Am Soc Echocardiogr. 2005;18(12):1440-63
9. Ujino K, Barnes ME, Cha SS, Langins AP, Bailey KR, Seward JB, et al. Two-dimensional echocardiographic methods for assessment of left atrial volume. Am J Cardiol. 2006;98(9):1185-8.
10. Dent CL, Bowman AW, Scott MJ, Allen JS, Lisauskas JB, Janif M, et al. Echocardiographic characterization of fundamental mechanisms of abnormal diastolic filling in diabetic rats with a parameterized diastolic filling formalism. J Am Soc Echocardiogr. 2001;14(12):1166-72.
11. Pritchett AM, Mahoney DW, Jacobsen SJ, Rodeheffer RJ, Karon BL, Redfield MM. Diastolic dysfunction and left atrial volume: a population-based study. J Am Coll Cardiol. 2005;45:87-92.
12. Teo SG, Yang H, Chai P, Yeo TC. Impact of left ventricular diastolic dysfunction on left atrial volume and function: a volumetric analysis. Eur J Echocardiogr. 2010;11(1):38-43.
13. Mesquita ET, Socrates J, Rassi S, Villacorta H, Mady C. Insuficiência cardíaca com função sistólica preservada. Arq Bras Cardiol. 2004;82(5):494-500.
References
Sources of Funding
There were no external funding sources for this study.
Study Association