Abstract—This paper conducts an investigation on marine diesel engine condition monitoring based on artificial neural network. The engine surface vibration signals are measured and analyzed using time series method. The characteristic parameters of engine vibration signals obtained from time series analysis are used to build a suitable artificial neural network by means of Back Propagation Algorithm in order to detect the engine operating faults and improve the diagnosis accuracy. The diagnoses of variations in valve clearances and engine cylinder loads are discussed. The relationships between vibration characteristics and engine working conditions are presented. Experimental investigations were carried out on a medium speed 6-cylinder marine diesel engine. The cylinder cover vibration signals are measured and analyzed for monitoring the working conditions of valve clearances and engine loads. The results show that it is effective to detect the variations in valve clearance and engine cylinder load from cylinder cover vibration signals.
Index Terms—Artificial Neural network, Condition Monitoring, Marine Diesel engine, Vibration.
I. INTRODUCTION
Condition monitoring of the main diesel engine in a ship is very important to ensure the vessel safety and reduce the shipping cost. The complicacy of reciprocating engine coupled with the intricate motional manners of the complexly shaped mobile components makes it extraordinarily difficult to perform accurate and quantitative fault diagnosis and engine condition monitoring. It is a meaningful and sophisticated research area to detect the working conditions of the engine components by vibration monitoring.
The working conditions of diesel engine components can be detected by monitoring the engine surface vibration signals. This paper conducts an investigation on marine diesel engine fault diagnosis based on vibration monitoring and artificial neural network (ANN). The engine surface vibration signals are measured and analyzed by use of time series method. The characteristic parameters of engine vibration signals obtained from time series analysis are used to build a suitable artificial neural network using the back propagation (BP) algorithm in order to detect the engine operating faults and improve the diagnosis accuracy. The diagnoses of variations in valve clearances and engine cylinder loads are discussed. The relationships between vibration characteristics and engine working conditions are proposed.
Manuscript received December 2, 2008. This work was supported by the Shanghai Municipal Education Commission under Grant No. 06FZ039.
Jianyuan Zhu is with the Merchant Marine College, Shanghai Maritime University, Shanghai 200135, China (phone: 86-21-50931295; fax: 86-21-58853909; e-mail: zhujy86@ hotmail.com).
Experimental investigations were carried out on a medium speed four-stroke 6-cylinder marine diesel engine. The results show that it is feasible and effective to detect the variations in valve clearance and engine cylinder load from engine surface vibration signals. Using time series analysis can provide various vibration characteristic parameters for the neural network diagnosis. The neural network can synthesize the effects of all the input characteristic parameters and achieve a high diagnostic accuracy. The amalgamation of multi parameters makes the diagnosis of the neural network more effective and veracious.
II. BACK PROPAGATION ALGORITHM
Back propagation algorithm is an approximate steepest descent algorithm, in which the performance index is mean square error. It can be used to train multilayer neural networks. This paper uses the back propagation algorithm to train the three-layer neural network in order to detect the engine operating faults.
It has been shown that three-layer networks, with log-sigmoid activation function in the hidden layer and linear activation function in the output layer, can approximate virtually any function of interest to any degree of accuracy, provided sufficiently many hidden units are available. Therefore the log-sigmoid activation function is adopted in this paper, which is defined as:
x
e
x
f
−+
=
1
1
)
(
(1) According to the back propagation algorithm, the output of hidden layer ai can be calculated as [1], [2]:M
i
b
p
w
f
a
r
j
j j ij
i
(
),
1
,
2
,...,
1
1
1
+
=
=
∑
=
(2) The output of output layer yk is:
N
k
b
a
v
f
y
M
i
i i ki
k
(
),
1
,
2
,...,
1
2
2
+
=
=
∑
=
(3) Where P is the input vector to the network; r and M are the numbers of neurons in input layer and hidden layer respectively; f1 and f2 are the activation functions; b1 and b2 are the biases; W and V are the weight matrixes. We adopt a particular convection in assigning the indices of the elements of the weight matrix. The first index indicates the particular neuron destination for that weight. The second index indicates the source of the signal fed to the neuron. Thus, the indices in wi,j say that this weight represents the connection to the i-th neuron from the j-th source.
Marine Diesel Engine Condition Monitoring by
Use of BP Neural Network
Jianyuan Zhu
Proceedings of the International MultiConference of Engineers and Computer Scientists 2009 Vol II IMECS 2009, March 18 - 20, 2009, Hong Kong
The algorithm should adjust the network parameters in order to minimize the mean square error, which can be expressed as:
∑
=−
=
N 1 2)
y
(
2
1
)
,
(
k k kt
b
w
E
(4)Where tk is the corresponding target output. The steepest
descent algorithm for the approximate mean square error is [3], [4]: ki k k ki ki
v
y
y
E
v
E
v
∂
∂
⋅
∂
∂
−
=
∂
∂
−
=
Δ
η
η
(5)i i
b
E
b
2 2∂
∂
−
=
Δ
η
(6)ij i i k k ij ij
w
a
a
y
y
E
w
E
w
∂
∂
⋅
∂
∂
⋅
∂
∂
−
=
∂
∂
−
=
Δ
η
η
(7)j j
b
E
b
1 1∂
∂
−
=
Δ
η
(8)Whereη is the learning rate.
When the basic back propagation algorithm is applied to a practical problem, the training may take days or weeks of computer time. This has encouraged considerable research on methods to accelerate the convergence of algorithm.
The research on faster algorithms falls roughly into two categories. The first category involves the development of heuristic techniques, which arises out of a study of the distinctive performance of the standard back propagation algorithm. These heuristic techniques include such ideas as varying the learning rate, using momentum and rescaling variables. In this paper, the momentum method and the variable learning rate are adopted.
A. Momentum Modification to Back Propagation
When the momentum method is added to the parameter changes, we obtain the following equations for the momentum modification to back propagation:
l ki l ki l ki
v
v
E
v
+
Δ
∂
∂
−
=
Δ
(+1)η
α
(9)
l ijl
ij l
ij
w
w
E
w
+
Δ
∂
∂
−
=
Δ
(+1)η
α
(10)
Where α is the momentum coefficient, and 0 ≤α <1. By use of momentum, it is possible to use a large learning
rate, while maintaining the stability of the algorithm. Another feature of momentum is that it tends to accelerate convergence when the trajectory is moving in a constant direction.
B. Variable Learning Rate
There are many approaches for varying the learning rate. The rules used in this paper for variable learning rate back propagation algorithm are:
1) If the square error SE (over the entire training set) increases by more than some set percentage β (typically 1% to 5%) after a weight update, then the weight update is
discarded, the learning rate is multiplied by some factor ρ (0 < ρ < 1).
2) If the square error decreases after a weight update, then the weight update is accepted and the learning rate is multiplied by some factor c (c >1).
3) If the square error increases by less than β, then the weight update is accepted but the learning rate is unchanged.
In this paper, the learning rate is varied according to Equation (11). ⎪ ⎩ ⎪ ⎨ ⎧ − > − < = + others k k SE k SE k k SE k SE k k ), ( ) 1 ( 04 . 1 ) ( ), ( 7 . 0 ) 1 ( ) ( ), ( 05 . 1 ) 1 ( η η η
η (11)
The momentum method and variable learning rate are used in training the neural network. When the neural network is constructed and trained, the network can be used to detect the engine operating faults and improve the diagnosis accuracy.
III. EXPERIMENTAL SCHEME
The engine used in this study is a 6-cylinder, four-stroke, turbo-charged, water-cooled marine diesel engine. The cylinder bore is 260 mm and the piston stroke is 340 mm, giving an output of 370 kW at 400 r/min. The firing order of the engine is 1-5-3-6-2-4. The valve timing of the engine is: intake valve open at 73° crank angle before top dead center, intake valve close at 37° crank angle after bottom dead center, exhaust valve open at 45° crank angle before bottom dead center, exhaust valve close at 65° crank angle after top dead center.
In order to investigate the relationships between the engine surface vibration signals and the working conditions of the engine, the vertical vibration acceleration signals of cylinder head and the transverse vibration of cylinder block were measured under different engine working conditions. The sampling frequency used in signal processing is 14 kHz; the sampling length is 16383 data points (1.17 s). Then the measured signals were analyzed using the MATLAB software.
IV. VALVE CLEARANCE MONITORING The abnormity of valve clearance is a kind of common malfunction of the valves. The principal exciting sources of the engine cylinder cover are: the impacts of intake and exhaust valves, the combustion forces (cylinder pressure), and the influences between the cylinders. Valve impact is a kind of broadband exciting force, which mainly affects the vertical vibration of the cylinder cover and has little influence on cylinder block surface vibration [5], [6]. Investigation shows that if the valve clearance is larger than the normal clearance, the valve velocity obviously becomes larger while the valve is closing; the impact force to the cylinder head also becomes significantly larger, and thus results in a distinct change of the vibration signal of the cylinder head. So the vibration signals of cylinder cover while the valve is closing can be used for diagnosing the abnormity of valve clearance. The measured vibration signals are firstly analyzed by use of time series method (autoregressive-moving average model)
Proceedings of the International MultiConference of Engineers and Computer Scientists 2009 Vol II IMECS 2009, March 18 - 20, 2009, Hong Kong
in order to obtain the vibration characteristic parameters and autoregressive coefficients Φn and moving average
coefficients m, then these characteristic parameters of engine
vibration signals obtained from time series analysis are used to build a suitable artificial neural network using the back propagation algorithm in order to detect the engine operating faults and improve the diagnosis accuracy.
The characteristic parameters used in constructing the artificial neural network are: the peak-to-peak value of the vibration signal PV, the total vibration power of the signal TP,
the ratio of power in 2~5 kHz frequency span RP, and the first
8 autoregressive coefficients Φn [6],[7].
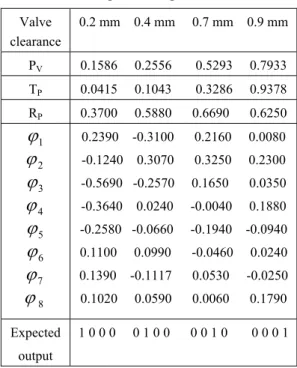
The characteristic parameters of cylinder cover vibration signals obtained from time series analysis at different valve clearances and the expected output vector of neural network are listed in Table 1. These parameters are used to construct a suitable artificial neural network in order to diagnose the variations in valve clearances. The peak-to-peak value PV and
the total vibration power TP have been normalized in Table 1.
Table 1. Vibration characteristic parameters and expected output
Valve clearance
0.2 mm 0.4 mm 0.7 mm 0.9 mm
PV 0.1586 0.2556 0.5293 0.7933
TP 0.0415 0.1043 0.3286 0.9378
RP 0.3700 0.5880 0.6690 0.6250
1
ϕ
2
ϕ
3
ϕ
4
ϕ
5
ϕ
6
ϕ
7
ϕ
8
ϕ
0.2390 -0.3100 0.2160 0.0080
-0.1240 0.3070 0.3250 0.2300
-0.5690 -0.2570 0.1650 0.0350
-0.3640 0.0240 -0.0040 0.1880
-0.2580 -0.0660 -0.1940 -0.0940
0.1100 0.0990 -0.0460 0.0240
0.1390 -0.1117 0.0530 -0.0250
0.1020 0.0590 0.0060 0.1790
Expected
output
1 0 0 0 0 1 0 0 0 0 1 0 0 0 0 1
The expected output vector of neural network 1 0 0 0 denotes that the valve clearance is 0.2 mm, 0 1 0 0 denotes valve clearance 0.4 mm, 0 0 1 0 denotes valve clearance 0.7 mm, and 0 0 0 1 denotes valve clearance 0.9 mm, as shown in Table 1.
The momentum method and variable learning rate are used in training the neural network. When the neural network is constructed and trained, the network can be used to monitor the variations in engine valve clearance.
The input characteristic parameters of cylinder cover vibration signals for valve clearance detection and the valve clearances to be detected are listed in Table 2. The output of neural network diagnosis and the detected results by the neural network are listed in Table 3.
Table 2. Input parameters for valve clearance detection
PV 0.1782 0.3102 0.5284 0.7700
TP 0.0423 0.1074 0.3335 0.9357
RP 0.3140 0.4150 0.6470 0.6390
1
ϕ
2
ϕ
3
ϕ
4
ϕ
5
ϕ
6
ϕ
7
ϕ
8
ϕ
0.3101 0.1920 -0.1917 -0.0036
-0.0829 -0.4042 0.3145 0.1827
-0.4471 0.1998 0.2019 0.1159
-0.4011 -0.0090 -0.0171 0.2188
0.2503 -0.1146 -0.1751 -0.0997
-0.0879 0.0811 -0.0396 -0.0378
0.1410 -0.2011 0.0798 -0.0241
-0.0501 0.1601 0.0101 0.1546
Valve clearance to be detected
0.2 mm 0.4 mm 0.7 mm 0.9 mm
Table 3. Output of neural network and detection results
Output of neural network Detection results
0.9409 0.1486 0.0036 0.0035 1 0 0 0 0.2 mm
06117 0.9605 0.0000 0.1580 0 1 0 0 0.4 mm
0.0056 0.2895 0.6634 0.0590 0 0 1 0 0.7 mm
0.0128 0.0057 0.0078 0.9934 0 0 0 1 0.9 mm
It can be seen from Table 3 that the diagnostic accuracy of the neural networks is quite high. The results show that it is feasible and effective to detect the variations in valve clearance by artificial neural network.
V. CYLINDER LOADS MONITORING
Variations in combustion force (or equivalently, cylinder pressure) mean the change of engine loads, which will also result in the change of cylinder cover vibration and the cylinder block vibration. Both the vertical vibration of cylinder cover and the transverse vibration of cylinder block can be used to detect the changes of cylinder loads. In this paper the transverse vibration signals of cylinder block are used to diagnose the changes of cylinder loads.
The characteristic parameters used for constructing the neural network are: the peak-to-peak value of the vibration signal PV, the total vibration power of the signal TP, the ratio
of power in 2~5 kHz frequency span RP, and the first 6
autoregressive coefficients Φn, as shown in Table 4. The
peak-to-peak value PV and the total vibration power TP have
been normalized in Table 4.
The expected output vector of neural network 0 0 0 1 denotes that the cylinder load is 50% Pe, 0 0 1 1 denotes the cylinder load 75% Pe, 0 1 1 0 denotes cylinder load 90% Pe, and 1 1 0 0 denotes cylinder load 100% Pe, as shown in Table 4.
The momentum method and variable learning rate are used in training the neural network [4], [8]. When the neural
Proceedings of the International MultiConference of Engineers and Computer Scientists 2009 Vol II IMECS 2009, March 18 - 20, 2009, Hong Kong
network is constructed and trained, the network can be used to diagnose the changes in engine cylinder loads.
Table 4. Vibration characteristic parameters and expected output
Engine cylinder loads
50% Pe 75% Pe 90% Pe 100% Pe
PV 0.1561 0.2946 0.5760 0.7464
TP 0.1249 0.2268 0.5586 0.7880
RP 0.4589 0.5968 0.5648 0.6863
1
ϕ
2
ϕ
3
ϕ
4
ϕ
5
ϕ
6
ϕ
-0.4227 0.4205 0.1090 -0.1424
0.2797 0.3199 0.2816 0.2448
-0.0927 -0.1200 0.1712 0.1685
-0.1175 -0.2134 -0.0202 -0.0668
0.2009 -0.1484 -0.0516 -0.0816
-0.0284 0.1095 0.1034 0.2644
Expected output
0 0 0 1 0 0 1 1 0 1 1 0 1 1 0 0
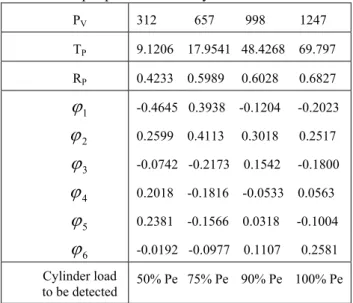
The input characteristic parameters of cylinder block vibration signals for cylinder loads detection and the cylinder load to be detected are listed in Table 5. The output of neural network diagnosis and the detected results by neural network are listed in Table 6.
Table 5. Input parameters for cylinder load detection
PV 312 657 998 1247
TP 9.1206 17.9541 48.4268 69.797
RP 0.4233 0.5989 0.6028 0.6827
1
ϕ
2
ϕ
3
ϕ
4
ϕ
5
ϕ
6
ϕ
-0.4645 0.3938 -0.1204 -0.2023
0.2599 0.4113 0.3018 0.2517
-0.0742 -0.2173 0.1542 -0.1800
0.2018 -0.1816 -0.0533 0.0563
0.2381 -0.1566 0.0318 -0.1004
-0.0192 -0.0977 0.1107 0.2581
Cylinder load
to be detected 50% Pe 75% Pe 90% Pe 100% Pe
Table 6. Output of neural network and detection results
Output of neural network Detection results
0.0035 0.2525 0.0121 0.8469 0 0 0 1 50% Pe
0.0026 0.0003 0.5026 0.9996 0 0 1 1 75% Pe
0.0789 0.9662 0.8661 0.0352 0 1 1 0 90% Pe
0.9811 0.9414 0.0005 0.1555 1 1 0 0 100% Pe
The results show that it is feasible and effective to detect the changes of engine cylinder loads using artificial neural network. It can be seen from Table 6 that the diagnostic accuracy of the neural networks is quite high.
VI. CONCLUSION
1) The characteristic parameters used for monitoring the engine working conditions are very diversiform and complicated. While using the artificial neural network for engine fault diagnosis, the input characteristic parameters of neural network are a series of parameters; any kind of parameters can be adopted into the neural network for the purpose of engine fault diagnosis. The neural network can synthesize the effects of all the input characteristic parameters and achieve a high diagnostic accuracy. The neural network has a high diagnostic accuracy even though some of the input characteristic parameters are distorted or warped.
2) Diesel engine fault diagnosis based on vibration monitoring and artificial neural network can make full use of the advantages of time series analysis. Using time series analysis can provide various vibration characteristic parameters for the neural network diagnosis. The amalgamation of multi parameters makes the diagnosis of the neural network more effective and veracious.
3) The characteristic parameters of engine vibration signals obtained from time series analysis can be used to build a suitable artificial neural network for the purpose of detecting the engine operating faults and improve the diagnosis accuracy.
4) Using vibration monitoring and fault diagnosis can improve the reliability and efficiency of diesel engines. The variations in valve clearance and engine load can be detected by use of cylinder head and cylinder block vibration signals.
ACKNOWLEDGMENT
This work was supported by Shanghai Municipal Education Commission under Grant No. 06FZ039.
REFERENCES
[1] Martin T. Hagan, Howard B. Demuth, Mark H. Beale. Neural Network Design, PWS Publishing Company, USA, 1996
[2] E. Barnard, “Optimization for Training Neural Networks”, IEEE Trans. On Neural Networks, Vol. 3, No. 2, 232-240, 1992
[3] T. Tollenaere, SuperSAB : “Fast Adaptive Back Propagation with Good Scaling Properties”, Neural Networks, Vol. 3, No. 5, 561-573,1990
[4] J. Freeman and D. Skapura, Neural networks, Algorithms, Applications, and Programming Techniques, Reading, MA: Addison-Wesley, 1991 [5] Qiang Huang and Shilun Gao, “The method of vibration diagnosis for diesel engine based on the fractal theory and neural network”, Journal of Huazhong University of Science and Technology (Nature Science), Vol.33, No. 09, September 2005.
[6] Quanshui Huang and Guohe Jiang, “ Fault Diagnosis of Diesel Engine Based on AR Model and Neural Networks”, Noise and Vibration Control, Vol.28, No. 03, June 2008.
[7] G. E. P. Box and G. M. Jenkins, Time Series Analysis: Forecasting and Control. (Prentice- Hall Inc. N. J. 1994
[8] M. Riedmiller and H. Braun, “A Direct Adaptive Method for Faster Backpropagation Learning: The RPROP Algorithm”, Proceedings of the IEEE International Conference on Neural Networks, San Francisco: IEEE 1993.
Proceedings of the International MultiConference of Engineers and Computer Scientists 2009 Vol II IMECS 2009, March 18 - 20, 2009, Hong Kong