ACPD
14, 23949–23994, 2014Vertical structure of BrO
P. K. Peterson et al.
Title Page
Abstract Introduction
Conclusions References
Tables Figures
◭ ◮
◭ ◮
Back Close
Full Screen / Esc
Printer-friendly Version Interactive Discussion
Discussion
P
a
per
|
Discus
sion
P
a
per
|
Discussion
P
a
per
|
Discussion
P
a
per
|
Atmos. Chem. Phys. Discuss., 14, 23949–23994, 2014 www.atmos-chem-phys-discuss.net/14/23949/2014/ doi:10.5194/acpd-14-23949-2014
© Author(s) 2014. CC Attribution 3.0 License.
This discussion paper is/has been under review for the journal Atmospheric Chemistry and Physics (ACP). Please refer to the corresponding final paper in ACP if available.
Meteorological controls on the vertical
distribution of bromine monoxide in the
lower troposphere
P. K. Peterson1, W. R. Simpson1, K. A. Pratt2,*, P. B. Shepson2,3, U. Frieß4, J. Zielcke4, U. Platt4, S. J. Walsh1, and S. V. Nghiem5
1
Department of Chemistry and Biochemistry, Geophysical Institute, University of Alaska Fairbanks, Fairbanks, Alaska, USA
2
Department of Chemistry, Purdue University, West Lafayette, Indiana, USA 3
Department of Earth, Atmospheric and Planetary Sciences, Purdue University, West Lafayette, Indiana, USA
4
Institute for Environmental Physics, University of Heidelberg, Germany 5
Jet Propulsion Laboratory, California Institute of Technology, Pasadena, California, USA *
now at: Department of Chemistry and Department of Earth & Environmental Sciences, University of Michigan, Ann Arbor, Michigan, USA
Received: 26 August 2014 – Accepted: 2 September 2014 – Published: 16 September 2014
Correspondence to: W. R. Simpson (wrsimpson@alaska.edu)
ACPD
14, 23949–23994, 2014Vertical structure of BrO
P. K. Peterson et al.
Title Page
Abstract Introduction
Conclusions References
Tables Figures
◭ ◮
◭ ◮
Back Close
Full Screen / Esc
Printer-friendly Version Interactive Discussion
Discussion
P
a
per
|
Discus
sion
P
a
per
|
Discussion
P
a
per
|
Discussion
P
a
per
|
Abstract
Multiple axis differential absorption spectroscopy (MAX-DOAS) measurements of bromine monoxide (BrO) probed the vertical structure of halogen activation events dur-ing March–May 2012 at Barrow, Alaska. An analysis of the BrO averagdur-ing kernels and degrees of freedom obtained by optimal-estimation-based inversions from raw
MAX-5
DOAS measurements reveals the information is best represented by reducing the re-trieved BrO profile to two quantities, the integrated column from the surface through 200 m (VCD200 m), and the lower tropospheric vertical column density (LT-VCD) which
represents the integrated column of BrO from the surface through 2 km. The percent-age of lower-tropospheric BrO in the lowest 200 m was found to be highly variable
10
ranging from shallow layer events, where BrO is present primarily in the lowest 200 m to distributed column events where BrO is observed at higher altitudes. The highest observed LT-VCD events occurred when BrO was distributed throughout the lower tro-posphere, rather than concentrated near the surface. Atmospheric stability in the lowest 200 m influenced the percentage of LT-VCD that is in the lowest 200 m, with inverted
15
temperature structures having a first-to-third quartile range (Q1–Q3) of VCD200 m /LT-VCD from 15–39 % while near neutral temperature structures had a Q1–Q3 range of 7–13 %. Data from this campaign show no clear influence of wind speed on ei-ther lower-tropospheric bromine activation (LT-VCD) or the vertical distribution of BrO, while examination of seasonal trends and the temperature dependence of the vertical
20
distribution supported the conclusion that the atmospheric stability affects the vertical distribution of BrO.
1 Introduction
The seasonal return of sunlight during late winter in the polar regions is associated with production of reactive halogens (e.g. Br, BrO, Cl) from saline ice surfaces (Abbatt et al.,
25
ACPD
14, 23949–23994, 2014Vertical structure of BrO
P. K. Peterson et al.
Title Page
Abstract Introduction
Conclusions References
Tables Figures
◭ ◮
◭ ◮
Back Close
Full Screen / Esc
Printer-friendly Version Interactive Discussion
Discussion
P
a
per
|
Discus
sion
P
a
per
|
Discussion
P
a
per
|
Discussion
P
a
per
|
layer chemistry through phenomena such as boundary layer ozone depletion events (ODEs) (Barrie et al., 1988; Simpson et al., 2007b) and mercury deposition events (MDEs) (Schroeder et al., 1998; Steffen et al., 2008). While the production mecha-nism of these halogens is not fully understood, modeling (e.g. Fan and Jacob, 1992; Mozurkewich, 1995; Lehrer et al., 2004; Piot and von Glasow, 2007; Yang et al., 2010;
5
Parrella et al., 2012; Toyota et al., 2014), laboratory (e.g. Fickert et al., 1999; Huffand Abbatt, 2000; Wren et al., 2013) and field studies (e.g. Foster et al., 2001; Spicer et al., 2002; Toom-Sauntry and Barrie, 2002; Krnavek et al., 2012; Pratt et al., 2013; Liao et al., 2014) point to heterogeneous chemistry involving salts present on ice surfaces (e.g. NaBr, NaCl) as important sources of reactive halogens.
10
Multiple studies have examined the vertical extent of ODEs that result from halogen chemistry and have shown ODE vertical structure to be highly variable (Bottenheim et al., 2002b; Jones et al., 2010; Helmig et al., 2012; Oltmans et al., 2012). Jones et al. (2010) suggest a link between ozone depletion at higher altitudes and low pressure systems (storms) from Antarctic observations, but also point out that this relationship
15
may not be the case in the Arctic due to differing meteorology. Ozonesonde data from ARCTAS/ARCPAC and OASIS campaigns presented in Oltmans et al. (2012) show the vertical extent of ozone depletion varies between 200 and 1000 m, and that this difference may be tied to the origin of the observed air masses in addition to the lo-cal meteorology. Although the profile of ozone depletion gives some insights into the
20
vertical structures of the reactive halogens that deplete ozone, the differing chemical lifetimes of ozone (a day to longer) and reactive halogens (minutes to hour unless recy-cled by heterogeneous chemistry on particles) may mean that halogen vertical profiles differ from ozone depletion profiles. Tackett et al. (2007) present a view from tethered balloon measurements of a stratified lower boundary layer, in which the rates of ozone
25
ACPD
14, 23949–23994, 2014Vertical structure of BrO
P. K. Peterson et al.
Title Page
Abstract Introduction
Conclusions References
Tables Figures
◭ ◮
◭ ◮
Back Close
Full Screen / Esc
Printer-friendly Version Interactive Discussion
Discussion
P
a
per
|
Discus
sion
P
a
per
|
Discussion
P
a
per
|
Discussion
P
a
per
|
is not known. The work of Frieß et al. (2011) used MAX-DOAS observations along with optimal-estimation-based inversions to retrieve full BrO profiles and showed significant variability in vertical structure with reactive halogens typically being in the lowest∼1 km of the atmosphere, similar to the ozone depleted layer.
The physical mechanisms for the transport of reactive halogens from the snow pack
5
to the boundary layer and recycling of those halogens aloft are still poorly understood. Given the short lifetime of BrO in the absence of heterogeneous recycling (McConnell et al., 1992; Platt and Hönninger, 2003), it is likely that some sort of aerosol particles (Fan and Jacob, 1992), either from blowing snow or other sources are required to sus-tain halogen activation aloft. Recent literature in particular has focused on the role of
10
blowing snow events in halogen activation (e.g. Jones et al., 2009, 2010; Yang et al., 2010; Frieß et al., 2011). In particular, Jones et al. (2009) used O3observations at
Hal-ley station in Antarctica, to derive a model for the dependence of ODEs on wind speed. Jones et al. (2009) suggest that there are two environmental regimes that favor local halogen activation and subsequent ozone depletion. One regime consists of low wind
15
speeds and a stable boundary layer, the other requires high winds and the presence of blowing snow. Blowing snow events occur when high winds loft snow, potentially enhancing available snow surface area available for reaction. Blowing snow may shift reactive halogens aloft through reactions on the blowing snow or aerosol particles pro-duced by sublimed blowing snow (Jones et al., 2009, 2010; Yang et al., 2010; Frieß
20
et al., 2011). Comparison of satellite-observed column BrO data with modeling results by Yang et al. (2010) suggests that blowing snow events may be sufficient to explain the majority of halogen activation events observed via satellite. In contrast, Halfacre et al. (2014) conducted an analysis at a variety of locations across the Arctic and found no relationship between observed ozone and wind speed, suggesting that high wind
25
ACPD
14, 23949–23994, 2014Vertical structure of BrO
P. K. Peterson et al.
Title Page
Abstract Introduction
Conclusions References
Tables Figures
◭ ◮
◭ ◮
Back Close
Full Screen / Esc
Printer-friendly Version Interactive Discussion
Discussion
P
a
per
|
Discus
sion
P
a
per
|
Discussion
P
a
per
|
Discussion
P
a
per
|
To examine these ideas further, it is necessary to observe both the total amount of re-active halogens, and their distribution throughout the lower troposphere. While satellite measurements (e.g. Wagner and Platt, 1998; Richter et al., 1998; Chance, 1998) pro-vide extensive spatial coverage of the Arctic, they only measure the total column of BrO, and do not provide vertical profile or near surface information. Multiple methods exist to
5
separate total column measurements into stratospheric and tropospheric components (e.g. Theys et al., 2011; Salawitch et al., 2010; Koo et al., 2012; Sihler et al., 2012). However, discrepancies still exist between ground based and satellite based measure-ments, potentially due to clouds masking portions of the tropospheric BrO column from satellite views. Additionally, Theys et al. (2009) and Salawitch et al. (2010) showed that
10
some of the variability of total column BrO arises from stratospheric variability, thus not all satellite-detected BrO “hotspots” are actually lower tropospheric halogen activa-tion events. In-situ chemical ionizaactiva-tion mass spectrometry (e.g. Liao et al., 2011; Pratt et al., 2013; Liao et al., 2014) and long path differential optical absorption spectroscopy (LP-DOAS) (e.g. Tuckermann et al., 1997; Pöhler et al., 2010) fail to capture the
verti-15
cal extent of halogen activation, except in the case of limited aircraft-based campaigns (e.g. Neuman et al., 2010; Liao et al., 2012), and thus can not address questions about the total amount of halogen activation taking place at a given time. However, the Tackett et al. (2007) work implied that much of the halogen chemistry is occurring in the lowest ∼200 m of the boundary layer.
20
Multiple axis differential optical absorption spectroscopy (MAX-DOAS) has the ability to retrieve vertical profiles of BrO in the lowest few kilometers, and thus can examine the variability of the vertical distribution of BrO over time (Frieß et al., 2011). The present work builds on the method of Frieß et al. (2011) by considering the BrO averaging ker-nels, which provide information on the sensitivity of these BrO measurements (Payne
25
ACPD
14, 23949–23994, 2014Vertical structure of BrO
P. K. Peterson et al.
Title Page
Abstract Introduction
Conclusions References
Tables Figures
◭ ◮
◭ ◮
Back Close
Full Screen / Esc
Printer-friendly Version Interactive Discussion
Discussion
P
a
per
|
Discus
sion
P
a
per
|
Discussion
P
a
per
|
Discussion
P
a
per
|
and the lower-tropospheric partial VCD (termed LT-VCD). The present work explores the dependence of these BrO profile properties on environmental factors to investi-gate activation of BrO and its propagation outside of the near surface layer over time. This present work focuses on measurements occurring near Barrow, Alaska, during the Bromine, Ozone, and Mercury Experiment (BROMEX) campaign (Nghiem et al.,
5
2013) from 6 March to 15 May 2012. The primary MAX-DOAS observations were made from the roof of the Barrow Arctic Research Center (BARC) building at 71.325◦N, 156.668◦W, which is about 6 km northeast of the city of Barrow, Alaska.
2 Methods
2.1 MAX-DOAS measurements
10
Multiple-Axis Differential Optical Absorption Spectroscopy (MAX-DOAS) probes verti-cal distributions of trace gases above a measurement site through a combination of measurements of scattered sunlight and modeling of vertical profiles consistent with those observations (Hönninger et al., 2004). The instrument measures spectra of scat-tered sunlight in a region where the molecule of interest absorbs as a function of
el-15
evation angle of a telescope receiving the light. Measurements at all elevation angles contain absorption features due to stratospheric and higher tropospheric gases, and because most sunlight is scattered in the lower atmosphere, these stratospheric ab-sorption features are common to observations at all elevation angles. Measurements at low elevation angles contain enhanced absorption for gases present near the ground,
20
due to the tangent geometry of the light’s final path to enter the telescope at a low el-evation. Therefore, analysis of the relative absorption spectrum comparing light at low elevation angles to high elevation angles provides high sensitivity to near-ground ab-sorbers with greatly reduced sensitivity to stratospheric and upper tropospheric gases. The instrument used in this study is similar to the one described in Carlson et al.
25
us-ACPD
14, 23949–23994, 2014Vertical structure of BrO
P. K. Peterson et al.
Title Page
Abstract Introduction
Conclusions References
Tables Figures
◭ ◮
◭ ◮
Back Close
Full Screen / Esc
Printer-friendly Version Interactive Discussion
Discussion
P
a
per
|
Discus
sion
P
a
per
|
Discussion
P
a
per
|
Discussion
P
a
per
|
ing a QE-65000 (Ocean Optics) spectrometer with spectral range from 309–397 nm and optical resolution of 0.39 nm full width at half maximum. This new spectrometer is improved by using a thermoelectrically cooled detector, stabilized at −15◦C. The spectrometer optical bench is heated to 38◦C to improve optical alignment stability. Another improvement of the instrument is the use of a MEMS tiltmeter (SignalQuest
5
SQ-SI-360DA-3.3R-HMP-HP-IND-S) mounted on the moving telescope that directly measures the elevation angle of the observation. The scan pattern measures scat-tered sunlight at elevation angles of 90◦(zenith), 20◦, 10◦, 5◦, 2◦, and 1◦over a period of approximately 30 min.
We used QDOAS software (Fayt et al., 2011) to fit the relative absorption spectrum
10
between near temporally coincident low elevation and zenith observations to a linear combination of possible absorbing spectra to quantify the differential slant column den-sity (dSCD) of each absorbing gas at each elevation angle. We performed this anal-ysis in the wavelength window between 346 and 364 nm. The absorber cross sec-tions are detailed in Table 1 and are convoluted with an instrumental function
mea-15
sured from the 334 nm line of a low pressure mercury lamp. In addition to gaseous absorbers, we include a third-order polynomial to account for Rayleigh and Mie scat-tering by gases and particles in the atmosphere, and a spectral offset to account for stray light within the spectrometer. The mean residual root mean square (RMS) of our dSCD retrieval was 3.9×10⁻⁴. Data collected during low sight conditions (solar 20
zenith angle >85◦), RMS>10−3, or when frost is detected on the instrument’s opti-cal window are discarded. The dSCD fitting errors (1σ) over the campaign average 1.9×10¹³molecules cm−2for BrO and 5.1×1041molecules2cm−5for O4.
2.2 Retrieval of vertical profiles
Retrieval of trace gas vertical profiles from dSCD data is a two-step procedure. First,
25
we determine the aerosol particle extinction vertical profile from O4 dSCD
ACPD
14, 23949–23994, 2014Vertical structure of BrO
P. K. Peterson et al.
Title Page
Abstract Introduction
Conclusions References
Tables Figures
◭ ◮
◭ ◮
Back Close
Full Screen / Esc
Printer-friendly Version Interactive Discussion
Discussion
P
a
per
|
Discus
sion
P
a
per
|
Discussion
P
a
per
|
Discussion
P
a
per
|
visibility and light scattering, which we are able to deduce because we know the vertical profile of O4. Measured O4dSCDs are compared to values modeled using the SCIA-TRAN radiative transfer model (Rozanov et al., 2005), which depend on a variable aerosol particle extinction profile and static parameters such as the viewing geometry and aerosol particle light scattering properties. Because the measurement data alone
5
do not provide enough information to retrieve the profile, an assumed a priori profile is required to further constrain the solution, as described by Rodgers (2000). We used a variable a priori profile that peaks at the surface and exponentially decays with alti-tude. Initially, the profile peaks at the surface with an aerosol particle extinction value of 0.05 km−1and exponentially decays with a scale height of 1 km. In following iterations, 10
the a priori is set to the retrieved profile and smoothed using a boxcar average with a width of 300 m (Frieß et al., 2006). The final output of this first step is a vertical profile of aerosol particle extinction.
The procedure to retrieve the BrO profile from BrO dSCD measurements is de-scribed in detail in Frieß et al. (2011). Briefly, we used the above-retrieved aerosol
15
particle extinction profiles as input to a Monte Carlo radiative transfer model (McArtim, Deutschmann et al., 2011) that simulates BrO dSCDs as a function of a variable BrO vertical concentration profile. The vertical profile of BrO is varied to give best fit to the BrO dSCD observations, again by optimal estimation. In the case of BrO, the a priori profile peaks at the surface with a value of 10 pmol mol−1 and exponentially decays 20
with a scale height of 400 m. The result of the second step is the average BrO mixing ratio every 100 m from the ground to an altitude of two kilometers. An example of the retrieved profile is shown in green in Fig. 1. Note that while our general retrieval uses a 400 m scale height for the a priori profile of BrO, Fig. 1 also includes the effect of modifying the a priori profile to have a different (1000 m) scale height (dashed blue
25
ACPD
14, 23949–23994, 2014Vertical structure of BrO
P. K. Peterson et al.
Title Page
Abstract Introduction
Conclusions References
Tables Figures
◭ ◮
◭ ◮
Back Close
Full Screen / Esc
Printer-friendly Version Interactive Discussion
Discussion
P
a
per
|
Discus
sion
P
a
per
|
Discussion
P
a
per
|
Discussion
P
a
per
|
2.3 Information content of the profile
The retrieved BrO profiles contain average mixing ratios in twenty 100 m thick layers from the surface to 2 km; however, they are based on only five low-elevation spectral measurements of BrO dSCD. Therefore, it is clear that our observations contain less information about the true vertical profile than is represented in Fig. 1. The optimal
5
estimation method used the assumed a priori information to constrain the fit in the absence of further information, but the actual vertical profile of BrO is not known. In fact, the results of this study indicate that both the BrO abundance and vertical profile shape vary over time. Therefore, the full profile, as retrieved by optimal estimation, lends itself to overinterpretation of the observations and we seek to find a method to
10
determine the actual information content, as well as reduce the number of derived properties to more accurately reflect the true observations.
As described in Rodgers (2000), the retrieved profile contains true profile informa-tion as well as a bias toward the assumed a priori profile. The extent to which the retrieved profile depends on the dSCD measurement data is determined by examining
15
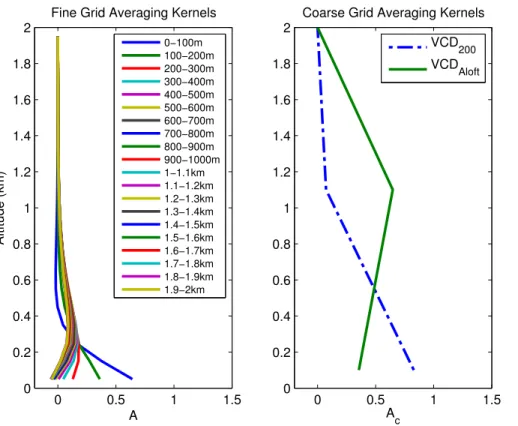
the averaging kernel matrix. An example of the BrO averaging kernels for a MAX-DOAS retrieval is given in the left panel of Fig. 2. If the value of the diagonal element of the av-eraging kernel at some altitude were unity (1), it would indicate that all of the information content at that layer is constrained by observational data and none of the information at that altitude comes from the a priori assumption. Non-zero off-diagonal elements
20
indicate that the retrieved parameter in that layer is not independently resolved and is influenced by results in other layers. There are two peaks in the averaging kernels, one at the surface and one aloft at an altitude of about 300 m. We can understand the sharp peak at the surface easily because MAX-DOAS spectroscopy always has highest sensitivity and greatest vertical resolution in the layer in which the observer
25
ACPD
14, 23949–23994, 2014Vertical structure of BrO
P. K. Peterson et al.
Title Page
Abstract Introduction
Conclusions References
Tables Figures
◭ ◮
◭ ◮
Back Close
Full Screen / Esc
Printer-friendly Version Interactive Discussion
Discussion
P
a
per
|
Discus
sion
P
a
per
|
Discussion
P
a
per
|
Discussion
P
a
per
|
layers at higher altitudes. The trace (sum of diagonal elements) of the averaging ker-nel matrix gives the degrees of freedom (DOF), which represents the total number of independent pieces of information contained in the retrieval. For BrO retrieval using this technique and our instrumentation, the distribution of DOF is well fit by a Gaussian function, with a mean of 2.0 DOF and σ=0.27. Our retrievals also exhibit a distinct
5
lack of sensitivity to changes in individual 100 m layers at altitudes over 1000 m. The DOF for this example is 1.99, implying our retrieved profile contains two independent pieces of information, rather than the 20 we retrieved.
To illustrate the influence of our a priori assumptions, Fig. 1 also shows a retrieved profile with a different assumed BrO scale height, 1000 m instead of the normal 400 m
10
assumption. The influence of a priori selection in the retrieved BrO mixing ratio in the lowest 200 m is minimal, showing that our instrument is most independent of a priori assumptions about the BrO profile near the surface. However, aloft the effects of a priori selection are clearly visible. What appeared to be a relatively sharp peak at≈650 m when the 400 m a priori was assumed becomes much broader with the 1000 m
as-15
sumed scale height. Note that both optimally estimated results fit the observational data with similar figure of merit (χ2), so the difference in profile is not due to poor fit-ting in one case or the other, but instead a consequence of the a priori influencing the resultant BrO profile.
2.4 Reduction of the full profile
20
A method for mapping the BrO profile retrieved on a fine grid to a course grid, such that the DOF are represented as physical quantities without the influence of a priori information is outlined in von Clarmann and Grabowski (2007). They suggest moving to a variable coarse altitude grid where one would select grid points such that each grid point would represent one DOF. The lowest layer’s upper boundary would be
de-25
ACPD
14, 23949–23994, 2014Vertical structure of BrO
P. K. Peterson et al.
Title Page
Abstract Introduction
Conclusions References
Tables Figures
◭ ◮
◭ ◮
Back Close
Full Screen / Esc
Printer-friendly Version Interactive Discussion
Discussion
P
a
per
|
Discus
sion
P
a
per
|
Discussion
P
a
per
|
Discussion
P
a
per
|
because the vertical resolution would vary over time, making comparisons difficult. As a compromise, we calculated coarse grid points by examining the ensemble of profile retrievals over this campaign and splitting them into two layers by determining the av-erage altitudes such that each layer contains one degree of freedom. This method led us to represent one degree of freedom as the abundance of BrO from surface through
5
200 m, and another as the abundance of BrO from 200 m to 2.0 km. These two layers differ in thickness due to the enhanced vertical resolution at the surface and decreased vertical resolution aloft, so we choose to represent the abundance in each layer is a partial vertical column density (VCD) within each layer. The vertical column density is also useful because satellite total column retrievals of BrO use the same unit of
abun-10
dance. Thus, our two quantities (VCD200 mand VCDAloft) represent a surface layer VCD and a lofted layer VCD respectively.
Figure 1 shows the partial VCDs in each layer derived from the grid coarsening procedure, for an example retrieval. While the profiles look fairly different, particularly aloft, the partial VCDs in each of the layers are only around ten percent different from
15
each other as an effect of the assumed a priori profile. This example shows how the grid coarsening procedure gives results that are less dependent on the unknown but assumed BrO profile.
Payne et al. (2009) describe how to calculate the BrO averaging kernel for the coars-ened grid, and an example of the coarse grid BrO averaging kernels is shown in Fig. 2.
20
The DOF has been reduced, meaning we have lost some information in the transfer to a coarse grid, however, both parameters have averaging kernels that peak within the desired layer and at a value close to unity, implying most of the information comes from the observations. Payne et al. (2009) suggested a cutoff of 0.7 for the diagonal element of the averaging kernel within a layer as sufficiently close to unity to consider
25
the observations as derived from the data and independent of the a priori assumption. We chose to adopt the same cutoffof 0.7 degrees of freedom in the present work.
ACPD
14, 23949–23994, 2014Vertical structure of BrO
P. K. Peterson et al.
Title Page
Abstract Introduction
Conclusions References
Tables Figures
◭ ◮
◭ ◮
Back Close
Full Screen / Esc
Printer-friendly Version Interactive Discussion
Discussion
P
a
per
|
Discus
sion
P
a
per
|
Discussion
P
a
per
|
Discussion
P
a
per
|
the near surface layer is heavily dependent on the aerosol optical depth, while our ability to retrieve information near the surface is less influenced by aerosol particles. In addition to the degrees of freedom cutoff, over the course of the campaign we also observed limited times when the retrieved aerosol optical depth was large, in excess of 2, which indicates that the visibility is insufficient to obtain an accurate profile of aerosol
5
particle extinction or BrO. During these periods, we do not consider the VCDAloft due
to insufficient degrees of freedom, and we also disregard the VCD200 m. This approach is consistent with methods used in comparison of near-surface MAX-DOAS and LP-DOAS BrO measurements by Frieß et al. (2011).
When both quantities have averaging kernels peaking about 0.7 or higher, we refer
10
to the sum as the lower tropospheric vertical column density (LT-VCD). It is important to note that this quantity does not represent a new degree of freedom, as it is derived from and not independent of the other two measurements. To evaluate the vertical distribu-tion of BrO, we examine the ratio of the VCD200 m/LT-VCD as well as the total amount of observed activation in the lower tropospheric (LT-VCD) and near surface amounts
15
(VCD200 m). A time series of these three quantities, along with the aerosol optical depth
over a portion of the campaign is presented in Fig. 4. The rest of the timeseries can be found in the supplemental material. This timeseries will be discussed below, but here we note that the fraction of BrO in the lower layer varies between a few percent and up to≈80 %. The a priori profile, exponentially decaying with a scale height of 400 m, 20
would have a constant fraction of BrO in the lowest 200 m, approximately 34 %. It is clear that the data show substantially more vertical profile variability than the assumed profile. Therefore, we use the grid-coarsened data to represent the information content from our MAX-DOAS observations over this long time period.
2.5 Other field sites
25
ACPD
14, 23949–23994, 2014Vertical structure of BrO
P. K. Peterson et al.
Title Page
Abstract Introduction
Conclusions References
Tables Figures
◭ ◮
◭ ◮
Back Close
Full Screen / Esc
Printer-friendly Version Interactive Discussion
Discussion
P
a
per
|
Discus
sion
P
a
per
|
Discussion
P
a
per
|
Discussion
P
a
per
|
retrieval. We deployed a second MAX-DOAS instrument, IL1, at 71.355◦N, 155.668◦W, which is on landfast sea ice east of the BARC building. This instrument is the same as the instrument on the BARC building, with the exception of the spectrometer, which is an Avantes (AvaSpec-ULS2048x64-USB2) with spectral range from 291–457 nm and optical resolution of 0.37 nm full width at half maximum. This spectrometer is housed
5
in a highly insulated enclosure that is stabilized at 10◦C using air cooling. We analysed MAX-DOAS data from IL1 using the techniques previously described. For IL1, the mean RMS of our dSCD retrieval is 5.2×10⁻⁴. IL1 dSCD fitting errors (1σ) over the campaign average 9.7×10¹²molecules cm−2for BrO and 1.7×1042molecules2cm−5for O4.
Additional surface BrO measurements were conducted near Barrow, AK from 12–
10
28 March 2012 at a measurement site about 5 km inland (71.275◦N, 156.641◦W), shown in Fig. 5, using a chemical ionization mass spectrometer (CIMS), described by Liao et al. (2011). Using hydrated I−(I
·(H2O)−n) as the reagent ion, BrO was
mea-sured at mass 222 (I79BrO−) and 224 (I81BrO−). Background measurements were per-formed every 15 min by passing the air flow through a glass wool scrubber. Br2
cali-15
brations were performed every two hours by adding Br2, from a permeation source, in 21 mL min−1 N
2 to the air flow. A relative sensitivity of BrO (mass 224) relative to Br2
(mass 287) of 0.47 was utilized for BrO calibration (Liao et al., 2011). The presence of BrO was confirmed by the ratio of mass 222/mass 224 (background-subtracted raw signals), calculated to be 1.01 (R2=0.94).
20
For a measurement cycle of 10.6 s, mass 224 (I81BrO−) was monitored for 0.5 s, giving a 5 % duty cycle. The 3σ limit of detection for BrO, using mass 224, was cal-culated to be 1.6 pmol mol−1, on average for a 2.8 s integration period (corresponding to 1 min of CIMS measurements). Since the variance in the background is likely due to counting statistics (Liao et al., 2011), the limit of detection for 30 min averaging is
25
ACPD
14, 23949–23994, 2014Vertical structure of BrO
P. K. Peterson et al.
Title Page
Abstract Introduction
Conclusions References
Tables Figures
◭ ◮
◭ ◮
Back Close
Full Screen / Esc
Printer-friendly Version Interactive Discussion
Discussion
P
a
per
|
Discus
sion
P
a
per
|
Discussion
P
a
per
|
Discussion
P
a
per
|
3 Results
3.1 Relationship between visibility and retrieval information content
The ability of MAX-DOAS to observe BrO beyond the near surface layer is heavily influenced by the optical properties of the atmosphere (e.g. visibility) at the time of the measurement. The methods outlined above allow us to identify times when
MAX-5
DOAS measurements are sensitive to BrO beyond the near surface layer and restrict our further analysis of the vertical distribution of BrO to these periods. Figure 3 details the relationship between the aerosol optical depth and the information content of the measurement. As the aerosol optical depth increases, the ability to observe the full LT-VCD sharply decreases. As seen in Fig. 3, we can retrieve the full LT-VCD 50 % of
10
the time. We excluded periods where we are unable to fully observe the LT-VCD from further analysis of the vertical distribution of BrO.
3.2 Influence of ozone
Ambient ozone levels influence the partitioning of reactive halogen species between atomic (e.g. Br atoms) and oxide (e.g. BrO) forms. MAX-DOAS measurements
ob-15
serve only BrO and thus only constrain one component of BrOx (BrO+Br). Therefore, it is important to consider effects of gas-phase partitioning of BrOx on subsequent
conclusions about halogen activation. To examine this influence, we examined ozone data and meteorological data from Barrow, provided by the National Oceanic and At-mospheric Administration (NOAA) Earth Systems Research Laboratory/Global
Moni-20
toring Division (ESRL/GMD). Under ordinary ozone conditions (ozone mixing ratios of 30–40 nmol mol−1), BrO will make up the majority of BrO
x; however, as ozone levels
approach zero (a common occurrence during the ozone depletion event season), our BrO-only measurements could be insufficent to observe reactive halogens, as shown in Helmig et al. (2012). We term this effect “ozone titration” and seek to avoid
inter-25
ACPD
14, 23949–23994, 2014Vertical structure of BrO
P. K. Peterson et al.
Title Page
Abstract Introduction
Conclusions References
Tables Figures
◭ ◮
◭ ◮
Back Close
Full Screen / Esc
Printer-friendly Version Interactive Discussion
Discussion
P
a
per
|
Discus
sion
P
a
per
|
Discussion
P
a
per
|
Discussion
P
a
per
|
depends on the photolysis rate of BrO, which varies depending on cloud cover and solar zenith angle, among other factors. For the purposes of this study, we used an ozone threshold of<1 nmol mol−1to identify potentially titrated air masses to exclude from further analysis (Simpson et al., 2007a). Figure 4 shows times when ozone is be-low 1 nmol mol−1as shaded in grey. Note that, for the most part, LT-VCD and VCD
200 m
5
are small during ozone titration, as would be expected, and also observed by Neuman et al. (2010).
3.3 Performance of surface BrO retrieval
To evaluate the effectiveness of the BrO retrieval near the surface, we used in situ BrO measurements made using chemical ionization mass spectrometry (CIMS) to
evalu-10
ate our retrieval in the lowest 100 m. While the mixing ratio in the lowest 100 m is not one of the grid coarsened quantities, because MAX-DOAS is most sensitive near the surface, the near surface mixing ratio has similar information content to the VCD200 m
while minimizing the effects of vertical averaging on comparison with in situ measure-ments. Figure 6, shows a timeseries of the average BrO mixing ratio retrieved in the
15
lowest 100 m by MAX-DOAS (Red) and in situ CIMS measurements taken 1 m above the snow pack (Green). The error associated with 100 m mixing ratios retrieved using MAX-DOAS varies depending on the state of the atmosphere at the time of the mea-surement. The error associated with each retrieval is determined by examining the sen-sitivity of the retrieval to dSCD errors associated with the measurement data (Rodgers,
20
2000). Average errors (2σ) were 4.2 pmol mol−1 for our MAX-DOAS measurements. Uncertainties are estimated at 30 %+0.3 pmol mol−1for CIMS measurements.
Because CIMS measures in one discrete location just above the snowpack, while MAX-DOAS measurements are spatially averaged, both horizontally over 10–20 km and vertically over approximately 100 m, it is expected that large changes in the
en-25
Fig-ACPD
14, 23949–23994, 2014Vertical structure of BrO
P. K. Peterson et al.
Title Page
Abstract Introduction
Conclusions References
Tables Figures
◭ ◮
◭ ◮
Back Close
Full Screen / Esc
Printer-friendly Version Interactive Discussion
Discussion
P
a
per
|
Discus
sion
P
a
per
|
Discussion
P
a
per
|
Discussion
P
a
per
|
ure 6 shows a time series of near surface BrO measurements from the CIMS, as well as MAX-DOAS measurements at the BARC building. Since the BARC data originate at ∼4 m, and average over the lowest 100 m, we might expect these data to be lower than the CIMS, which measures closer to the snowpack. Figure 6 shows agreement for the majority of concurrent observations, excluding the period shaded in gray, during which
5
we observed substantial gradients in the near surface amounts of BrO at IL1 (blue line) and BARC (red line), which could explain discrepancies between the MAX-DOAS measurements at the BARC building and the CIMS measurements. Figure 7 shows the overall correlation between MAX-DOAS measurements at the BARC building and the CIMS, each averaged to hourly bins. Points occurring during the gray period marked on
10
Fig. 6 are shown in red open circles. Outside times of disagreement between the two MAX-DOAS instruments, shown in gray on Fig. 6, the correlation observed between the DOAS data and CIMS data isR=0.70, which is similar to correlation of MAX-DOAS and long path DOAS measurements observed by Frieß et al. (2011). The CIMS and LP-DOAS were previously shown to agree well, particularly during times of moderate
15
wind speeds (3–8 m s−1) and low NO (<100 pmol mol−1(Liao et al., 2011).
3.4 Relationship between amount observed and vertical distribution of BrO
Figure 4 shows the timeseries of the VCD200 m and LT-VCD. LT-VCD values over the
course of this study ranged from 0 to 8×10¹³molecules cm−2with an average of 1.46× 10¹³molecules cm−2and the top quartile being above 2.0
×1013molecules cm−2, which 20
we will later consider to be “highly activated” events. LT-VCD retrieval errors had a mean of 3.9×10¹²molecules cm−2 over the course of the campaign. Figure 8 shows the percentage of the LT-VCD present in the lowest 200 m ranges from shallow layer events observed primarily below 200 m to distributed column events that are also observed at higher altitudes. The third panel of Fig. 4 shows a timeseries of this ratio. Surface layer
25
ACPD
14, 23949–23994, 2014Vertical structure of BrO
P. K. Peterson et al.
Title Page
Abstract Introduction
Conclusions References
Tables Figures
◭ ◮
◭ ◮
Back Close
Full Screen / Esc
Printer-friendly Version Interactive Discussion
Discussion
P
a
per
|
Discus
sion
P
a
per
|
Discussion
P
a
per
|
Discussion
P
a
per
|
imply high LT-VCD. In most cases, high LT-VCDs are associated with distributed column events.
3.5 Dependence on local meterology
To examine atmospheric stability, we obtained meteorological balloon sounding data from the Barrow Airport (PABR) to calculate the temperature gradient (dT/dz) near the
5
surface. We calculated the slope of a linear fit of the first three data points of the sound-ing. Typically, the first three sounding points corresponded to measurements between the surface and 200 m altitude. Soundings take place twice daily, at 00:00 UTC, which is in the daylight hours, 15 AKST, at Barrow, and 12:00 UTC. Because MAX-DOAS data are daylight only, to compare our half-hourly BrO measurements with the sounding
10
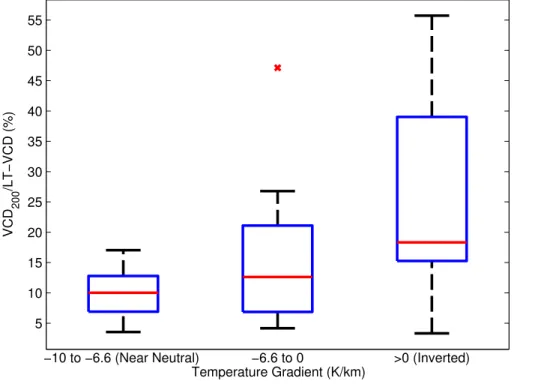
data, we used daily averages of the fraction of near-surface BrO to LT-VCD from each day and examined the relationship between daily averaged ratios and the correspond-ing temperature gradients obtained from the local daytime soundcorrespond-ing. Figure 9 shows the relationship between these two quantities. This box and whisker plot is generated by splitting daily observations into three bins of about 20 days each. The median is
15
given by the red lines and shows the general trend that more stable atmospheres with inverted temperature structures (right bin) have more BrO present in the surface layer, while unstable atmospheres (left bin) tend to have BrO more distributed throughout the lower troposphere. The short diurnal time scales of the temperature gradient do not allow the use of daily sounding data to determine the functional relationship between
20
the temperature gradient and where an event would fall on the spectrum of BrO vertical distributions.
The left panel of Fig. 10 illustrates the relationship between surface temperature and the amount of BrO in the near surface layer. On average, there is a higher frac-tion of BrO in the near surface layer when temperatures are below−25◦C, with more 25
ACPD
14, 23949–23994, 2014Vertical structure of BrO
P. K. Peterson et al.
Title Page
Abstract Introduction
Conclusions References
Tables Figures
◭ ◮
◭ ◮
Back Close
Full Screen / Esc
Printer-friendly Version Interactive Discussion
Discussion
P
a
per
|
Discus
sion
P
a
per
|
Discussion
P
a
per
|
Discussion
P
a
per
|
Additionally, we examine the response of both the total activation as measured by the LT-VCD and the vertical distribution of BrO to changes in wind speed. Figure 11 (left panel) shows LT-VCD values in excess of 2×10¹³molecules cm−2at various wind speeds and, as shown by the red line, there is no obvious relationship between the LT-VCD and wind speed. The observed lack of dependence of the LT-LT-VCD on wind speed
5
and temperature is consistent with the observations of Halfacre et al. (2014). However, the vertical distributon of BrO is influenced by windspeed. The right panel of Fig. 11 shows the majority of shallow layer events occur during times when wind speeds are between 3–6 m s−1. Additionally, events at wind speeds in excess of 8 m s−1tend to be more distributed throughout the column.
10
4 Discussion
4.1 Role of atmospheric stability
The third panel of Fig. 4 shows the vertical structure of BrO was highly variable over the course of this study. Events range from shallow layer events where most of the ob-served BrO is found in the lowest 200 m to distributed column events with BrO present
15
throughout the lower troposphere. Figure 8 shows the highest observed LT-VCDs were observed during distributed column events while shallow layer events, despite their en-hanced near surface mixing ratios, did not result in large amounts of total activation, as measured by the LT-VCD. This points out the difficulty in comparing satellite BrO column retrievals with surface observations (e.g. Sihler et al., 2012). Figure 9 shows
20
the vertical distribution of BrO is clearly influenced by the observed atmospheric stabil-ity. During times of inversion, bromine activation events tend toward the shallow layer end of the spectrum. When the atmosphere is less stable, events tend to be distributed throughout the column. Given that this study only uses daily sounding data, and know-ing that convective mixknow-ing has a strong diurnal variability, it is likely this study represents
25
ACPD
14, 23949–23994, 2014Vertical structure of BrO
P. K. Peterson et al.
Title Page
Abstract Introduction
Conclusions References
Tables Figures
◭ ◮
◭ ◮
Back Close
Full Screen / Esc
Printer-friendly Version Interactive Discussion
Discussion
P
a
per
|
Discus
sion
P
a
per
|
Discussion
P
a
per
|
Discussion
P
a
per
|
Ozone depletion events have been shown to be highly variable in vertical extent (e.g. Bottenheim et al., 2002b; Tarasick and Bottenheim, 2002; Jones et al., 2010; Oltmans et al., 2012; Helmig et al., 2012). More recently, Moore et al. (2014) observed that opening of leads enhanced vertical mixing leading to a recovery of ozone and gaseous elemental mercury in the near surface layer. This mixing potentially impacts the vertical
5
distribution of halogens as well. McElroy et al. (1999) observed high total tropospheric BrO events and interpreted them as arising from convective vertical mixing associated with open leads that brought near-surface BrO to the free troposphere. Therefore, it is reasonable that vertical mixing or hindered mixing due to atmospheric stability affects the vertical structure of BrO.
10
Seasonal and temperature trends are consistent with atmospheric stability’s influ-ence on the BrO vertical structure. Figure 10 shows that at lower temperatures, which are more prevalent early in the season, events tend to be observed in shallow lay-ers and transition to more vertically distributed as the surface temperature increases. These observations are consistent with the idea that the distribution of BrO is primarily
15
influenced by atmospheric stability.
The right panel of Fig. 10 indicates that significant activation events happen at a vari-ety of temperatures. Pöhler et al. (2010) observed there was a linear trend of decreas-ing near surface maximum BrO, observed with LP-DOAS, as temperature increased up to −15◦C. When examining the whole LT-VCD, rather than a near surface con-20
centration, this trend does not appear, however, Fig. 10 (left panel) shows a distinct preference toward near surface distributions of BrO at lower temperatures, which as Fig. 8 shows, often contain higher near surface amounts of BrO, but have a lower over-all LT-VCD. Figure 12 illustrates the diurnal behavior of both the LT-VCD, shown in blue, and the VCD200 mshown in red. The VCD200 mobserved on Fig. 12 is similar to surface
25
ACPD
14, 23949–23994, 2014Vertical structure of BrO
P. K. Peterson et al.
Title Page
Abstract Introduction
Conclusions References
Tables Figures
◭ ◮
◭ ◮
Back Close
Full Screen / Esc
Printer-friendly Version Interactive Discussion
Discussion
P
a
per
|
Discus
sion
P
a
per
|
Discussion
P
a
per
|
Discussion
P
a
per
|
dynamics. The observation of Pöhler et al. (2010) of decreasing surface BrO mixing ra-tio at higher temperatures could therefore reflect increased vertical mixing of surface-sourced BrO that dilutes the surface concentration upon warming rather than being indicative of decreased halogen activation chemistry at higher temperatures.
4.2 Role of wind speed
5
Figure 11 (left panel) shows that activation events with BrO LT-VCDs in the top quar-tile occur across a spectrum of wind speeds, rather than at just the low wind speeds associated with stable boundary layers, or high wind speeds associated with blowing snow events. The right panel of Fig. 11 shows a peak in shallow layer events between 3–6 m s−1suggesting that some ventilation of the snowpack, which has been shown to 10
be an effective source of Br2(Pratt et al., 2013), is required for the release of BrO
dur-ing shallow layer events. For the most part, observed wind speeds exceeddur-ing 8 m s−1, led to vertically distributed events, but beyond that there is little evidence to support the need for high winds or blowing snow to sustain halogen activation aloft, consistent with the conclusions of Halfacre et al. (2014). This suggests that, during the course of
15
this study, high wind events and blowing snow were not required to observe significant halogen activation. Activation events in the top quartile were observed across a range of wind speeds, particularly at more moderate wind speeds, with 66 % of highly acti-vated events occurring at wind speeds between 3 and 8 m s−1. This distribution sug-gests that enhanced ventilation of the snowpack, and subsequent vertical mixing of
20
snowpack-influenced airmasses, is likely responsible for the majority of elevated LT-VCDs observed over the course of this study.
Jones et al. (2009) and Yang et al. (2010) rely on satellite observations of BrO rather than ground-based measurements to draw conclusions about the role of wind in halo-gen activation events. The differing viewing geometry potentially becomes an issue
25
ACPD
14, 23949–23994, 2014Vertical structure of BrO
P. K. Peterson et al.
Title Page
Abstract Introduction
Conclusions References
Tables Figures
◭ ◮
◭ ◮
Back Close
Full Screen / Esc
Printer-friendly Version Interactive Discussion
Discussion
P
a
per
|
Discus
sion
P
a
per
|
Discussion
P
a
per
|
Discussion
P
a
per
|
be detected by ground-based MAX-DOAS, although the profile reduction procedure should minimize these issues. Sihler et al. (2012) observed that satellite measurements could underestimate the amount of BrO during shallow layer events, implying events with distributed column vertical structure are more likely to be satellite detectable. This idea that shallow layer events may not be satellite detectable is also supported by
5
the modeling work of Toyota et al. (2014). Enhanced visibility of the larger in magnitude and more vertically distributed BrO events could potentially explain why satellite remote sensing of BrO may show an apparent relationship to wind speed. These differences should be considered when trying to resolve differences between ground-based and satellite-based measurements.
10
4.3 Relationship between activation and aerosol particles
The near-surface aerosol particle extinction retrieved from our MAX-DOAS measure-ments is a proxy for suspended particulate surface area that enhances recycling of halogens, allowing us to examine the relationship between BrO and aerosol particles. The left panel of Fig. 13 shows an increase in the VCD200 m with increased aerosol
15
particle extinction, while the right panel shows that the relationship between aerosol particles and the LT-VCD is less clear. Laboratory studies (e.g. Huffand Abbatt, 2000; Wren et al., 2013) and field studies (e.g. Pratt et al., 2013) indicate that pH is an im-portant control on heterogeneous recycling of halogens. Although we are unable to determine the pH of these particles by MAX-DOAS, we simply point out that, not only
20
is the presence of suspended surface area important, but also that the chemical com-position of that surface is likely a controlling factor.
Prior to using these data to consider the role of blowing snow in observed halo-gen activation during this study, it is important to point out that the lack of LT-VCD observations at high aerosol optical depth, shown in Fig. 3, could potentially lead to
25
ACPD
14, 23949–23994, 2014Vertical structure of BrO
P. K. Peterson et al.
Title Page
Abstract Introduction
Conclusions References
Tables Figures
◭ ◮
◭ ◮
Back Close
Full Screen / Esc
Printer-friendly Version Interactive Discussion
Discussion
P
a
per
|
Discus
sion
P
a
per
|
Discussion
P
a
per
|
Discussion
P
a
per
|
application of methods described in Sect. 2.4. Of the 147 measurements occurring when wind speeds exceeded 8 m s−1 threshold used for blowing snow in Jones et al. (2009), 86 of those were rejected due to insufficient information content. If one were to presume these were all blowing snow events and belonged in the top quartile of observed activation events, they would represent 9.6 % of LT-VCD observations and
5
29 % of events where the LT-VCD exceeded 2×10¹³molecules cm−2. While we end up discarding a significant amount of data, these filtered data still provide a fair idea of the role of high wind events, blowing snow or otherwise, in halogen activation.
While the increase in VCD200 m during times of high aerosol particle extinction
sup-ports blowing snow as one source of halogens, it is interesting to note that LT-VCD
10
above 2×10¹³molecules cm−2 often occur at wind speeds well below typical thresh-olds for blowing snow (8 m s−1, Jones et al., 2009), as shown in the left panel of Fig. 11. Additionally, examining the dependence of the aerosol particle extinction on wind speed shown by the coloration in the left panel of Fig. 13, there is no apparent increase in extinction at high wind speeds, which we would expect if blowing snow
15
was the only source of particulate surface area for halogen recycling. The observa-tion of aerosol particle extincobserva-tion values in excess of 10−1km−1 across a variety of wind speeds suggests that blowing snow is not the only source of the aerosol particles needed to sustain halogen activation aloft. While blowing snow is not simply a uni-variate function of wind speed (Sturm and Stuefer, 2013), given 9 % of observations
20
occurred when wind speeds exceeded 8 m s−1 and halogen activation events in ex-cess of 2×10¹³molecules cm−2occurred 25 % of the time, immediate activation during blowing snow events is not the sole driver of halogen activation over the course of this study, and likely some other aerosol particle source is required. Frieß et al. (2011) pos-tulated that aerosol particles produced by sublimation of blowing snow could transport
25
ACPD
14, 23949–23994, 2014Vertical structure of BrO
P. K. Peterson et al.
Title Page
Abstract Introduction
Conclusions References
Tables Figures
◭ ◮
◭ ◮
Back Close
Full Screen / Esc
Printer-friendly Version Interactive Discussion
Discussion
P
a
per
|
Discus
sion
P
a
per
|
Discussion
P
a
per
|
Discussion
P
a
per
|
5 Conclusions
The methods described in this paper outline the reduction of vertical profiles retrieved from MAX-DOAS observations using optimal estimation to produce two quantities, the lower tropospheric vertical column density (LT-VCD), and the near surface vertical col-umn density in the lowest 200 m (VCD200 m), that appropriately reflect the information
5
content of ground-based MAX-DOAS measurements for timeseries analysis. Consid-eration of BrO averaging kernels and degrees of freedom resulting from optimal esti-mation validates that these quantities are most appropriate to express the two degrees of freedom observed. This method allows for identification of time periods when MAX-DOAS measurements contain information about BrO beyond the near surface layer,
10
and evaluate how the vertical structure of BrO responds to various environmental fac-tors. Application of these methods shows retrieval of LT-VCDs by ground-based MAX-DOAS is highly dependent on visibility. During this study, we retrieved the LT-VCD 50 % of the time.
The vertical structure of BrO is highly variable, with the fraction of lower-tropospheric
15
BrO in the lowest 200 m varying from near zero to nearly 80 %. The vertical distribution of activation events is clearly influenced by the atmospheric stability. This influence also manifests itself when examining the influence of temperature and seasonality. Later in the season, higher temperatures, and likely enhanced vertical mixing, tend to result in more BrO aloft than early in the season, where activation takes place in shallower
20
layers. LT-VCD values in excess of 2×10¹³molecules cm−2 occur across a variety of temperatures and wind speeds, but they are typically associated with distributed col-umn events, rather than shallow layer events. Events that have larger observed near surface mixing ratios are typically of the shallow layer variety and do not typically have large amounts of BrO spread through the lower troposphere, potentially implying less
25
ACPD
14, 23949–23994, 2014Vertical structure of BrO
P. K. Peterson et al.
Title Page
Abstract Introduction
Conclusions References
Tables Figures
◭ ◮
◭ ◮
Back Close
Full Screen / Esc
Printer-friendly Version Interactive Discussion
Discussion
P
a
per
|
Discus
sion
P
a
per
|
Discussion
P
a
per
|
Discussion
P
a
per
|
the impact of environmental variables on O3 depletion and Hg oxidation rates and ex-tent.
High wind events were not common over the course of this study. While high winds did lead to some of the highest measured columns of BrO, given the low frequency of these events, high wind events, blowing snow or otherwise, are not the sole driver of
5
halogen activation over the course of this study, suggesting that mechanisms requiring only moderate wind speeds (e.g. wind pumping) are important for halogen activation in the Arctic.
The Supplement related to this article is available online at doi:10.5194/acpd-14-23949-2014-supplement.
10
Acknowledgements. The research at the University of Alaska was supported by the National Aeronautics and Space Administration (NASA) Cryospheric Sciences Program (CSP), and par-tial financial support for MAX-DOAS analysis methods was provided by the National Science Foundation under grant ARC-1023118. The Purdue group recognizes NSF support through grant ARC-1107695. K. A. Pratt was supported by a NSF Postdoctoral Fellowship in Polar
Re-15
gions Research. The Purdue group acknowledges field assistance from Kyle Custard (Purdue Univ.), David Tanner (Georgia Tech), and L. Gregory Huey (Georgia Tech). The research at the Jet Propulsion Laboratory, California Institute of Technology, was supported by the NASA CSP. The authors gratefully acknowledge Chris Moore for helpful discussions, as well as Alexei Rozanov from IUP Bremen for providing the SCIATRAN radiative transfer code. The authors
20
also wish to thank UMIAQ for logistical support, and Bristow Air for providing a helicopter for the deployment of IL1.
References
Abbatt, J. P. D., Thomas, J. L., Abrahamsson, K., Boxe, C., Granfors, A., Jones, A. E., King, M. D., Saiz-Lopez, A., Shepson, P. B., Sodeau, J., Toohey, D. W., Toubin, C.,
ACPD
14, 23949–23994, 2014Vertical structure of BrO
P. K. Peterson et al.
Title Page
Abstract Introduction
Conclusions References
Tables Figures
◭ ◮
◭ ◮
Back Close
Full Screen / Esc
Printer-friendly Version Interactive Discussion
Discussion
P
a
per
|
Discus
sion
P
a
per
|
Discussion
P
a
per
|
Discussion
P
a
per
|
von Glasow, R., Wren, S. N., and Yang, X.: Halogen activation via interactions with envi-ronmental ice and snow in the polar lower troposphere and other regions, Atmos. Chem. Phys., 12, 6237–6271, doi:10.5194/acp-12-6237-2012, 2012. 23950
Barrie, L. A., Bottenheim, J. W., Schnell, R. C., Crutzen, P. J., and Rasmussen, R. A.: Ozone destruction and photochemical reactions at polar sunrise in the lower Arctic atmosphere,
5
Nature, 334, 138–141, doi:10.1038/334138a0, 1988. 23951
Bottenheim, J. W., Fuentes, J. D., Tarasick, D. W., and Anlauf, K. G.: Ozone in the Arctic lower troposphere during winter and spring 2000 (ALERT2000), Atmos. Environ., 36, 2535–2544, doi:10.1016/S1352-2310(02)00121-8, 2002. 23951, 23967
Carlson, D., Donohoue, D., Platt, U., and Simpson, W. R.: A low power automated MAX-DOAS
10
instrument for the Arctic and other remote unmanned locations, Atmos. Meas. Tech., 3, 429– 439, doi:10.5194/amt-3-429-2010, 2010. 23954
Chance, K.: Analysis of BrO measurements from the global ozone monitoring experiment, Geo-phys. Res. Lett., 25, 3335–3338, 1998. 23953
Chance, K. V. and Spurr, R. J.: Ring effect studies: Rayleigh scattering, including molecular
15
parameters for rotational Raman scattering, and the Fraunhofer spectrum, Appl. Optics, 36, 5224–5230, 1997. 23981
Deutschmann, T., Beirle, S., Frieß, U., Grzegorski, M., Kern, C., Kritten, L., Platt, U., Prados-Román, C., Puk¸ıte, J., Wagner, T., Werner, B., and Pfeilsticker, K.: The Monte Carlo atmo-spheric radiative transfer model McArtim: Introduction and validation of Jacobians and 3D
20
features, J. Quant. Spectrosc. Ra., 112, 1119–1137, doi:10.1016/j.jqsrt.2010.12.009, 2011. 23956
Fan, S.-M., and Jacob, D. J.: Surface ozone depletion in Arctic spring sustained by bromine reactions on aerosols, Nature, 359, 522–524, doi:10.1038/359522a0, 1992. 23951, 23952 Fayt, C., De Smedt, I., Letocart, V., Merlaud, A., Pinardi, G., Van Roozendael, M., and
Roozen-25
dael, M. V. A. N.: QDOAS Software User Manual, available at: http://uv-vis.aeronomie.be/ software/QDOAS/index.php (last access: 10 March 2014), 2011. 23955
Fickert, S., Adams, J. W., and Crowley, J. N.: Activation of Br2and BrCl via uptake of HOBr onto aqueous salt solutions, J. Geophys. Res., 104, 23719–23727, doi:10.1029/1999JD900359, 1999. 23951
30
ACPD
14, 23949–23994, 2014Vertical structure of BrO
P. K. Peterson et al.
Title Page
Abstract Introduction
Conclusions References
Tables Figures
◭ ◮
◭ ◮
Back Close
Full Screen / Esc
Printer-friendly Version Interactive Discussion
Discussion
P
a
per
|
Discus
sion
P
a
per
|
Discussion
P
a
per
|
Discussion
P
a
per
|
Frieß U., Monks, P. S., Remedios, J. J., Rozanov, A., Sinreich, R., Wagner, T., and Platt, U.: MAX-DOAS O4 measurements: a new technique to derive information on atmospheric aerosols: 2. Modeling studies, J. Geophys. Res., 111, D14203, doi:10.1029/2005JD006618, 2006. 23955, 23956
Frieß U., Sihler, H., Sander, R., Pöhler, D., Yilmaz, S., and Platt, U.: The vertical distribution of
5
BrO and aerosols in the Arctic: measurements by active and passive differential optical ab-sorption spectroscopy, J. Geophys. Res., 116, D00R04, doi:10.1029/2011JD015938, 2011. 23952, 23953, 23956, 23960, 23964, 23970
Halfacre, J. W., Knepp, T. N., Shepson, P. B., Thompson, C. R., Pratt, K. A., Li, B., Peter-son, P. K., Walsh, S. J., SimpPeter-son, W. R., Matrai, P. A., Bottenheim, J. W., Netcheva, S.,
Per-10
ovich, D. K., and Richter, A.: Temporal and spatial characteristics of ozone depletion events from measurements in the Arctic, Atmos. Chem. Phys., 14, 4875–4894, doi:10.5194/acp-14-4875-2014, 2014. 23952, 23966, 23968
Hara, K., Osada, K., Matsunaga, K., Iwasaka, Y., Shibata, T., and Furuya, K.: Atmospheric inor-ganic chlorine and bromine species in Arctic boundary layer of the winter/spring, J. Geophys.
15
Res., 107, 4361, doi:10.1029/2001JD001008, 2002. 23970
Helmig, D., Boylan, P., Johnson, B., Oltmans, S., Fairall, C., Staebler, R., Weinheimer, A., Or-lando, J., Knapp, D. J., Montzka, D. D., Flocke, F., Frieß, U., Sihler, H., and Shepson, P. B.: Ozone dynamics and snow-atmosphere exchanges during ozone depletion events at Barrow, Alaska, J. Geophys. Res.-Atmos., 117, D20303, doi:10.1029/2012JD017531, 2012. 23951,
20
23962, 23967
Hermans, C., Vandaele, A., Coquart, B., Jenouvrier, A., Merienne, M. F., Fally, S., Carleer, M., and Colin, R.: Absorption bands of O2 and its collision-induced bands in the 30 000– 7500 cm−1 wavenumber region, in: IRS 2000: Current Problems in Atmospheric Radiation, edited by: Smith, W. L. and Timofeyev, Y. M., Hampton, VA, Deepak, 639–642, 2001. 23981
25
Hönninger, G., von Friedeburg, C., and Platt, U.: Multi axis differential optical absorption spectroscopy (MAX-DOAS), Atmos. Chem. Phys., 4, 231–254, doi:10.5194/acp-4-231-2004, 2004. 23954
Huff, A. K. and Abbatt, J. P. D.: Gas-phase Br2 production in heterogeneous reactions of Cl2, HOCl, and BrCl with halide-ice surfaces, J. Phys. Chem. A, 104, 7284–7293,
30
doi:10.1021/jp001155w, 2000. 23951, 23969
ACPD
14, 23949–23994, 2014Vertical structure of BrO
P. K. Peterson et al.
Title Page
Abstract Introduction
Conclusions References
Tables Figures
◭ ◮
◭ ◮
Back Close
Full Screen / Esc
Printer-friendly Version Interactive Discussion
Discussion
P
a
per
|
Discus
sion
P
a
per
|
Discussion
P
a
per
|
Discussion
P
a
per
|
depletion events, Atmos. Chem. Phys., 9, 4639–4652, doi:10.5194/acp-9-4639-2009, 2009. 23952, 23968, 23970
Jones, A. E., Anderson, P. S., Wolff, E. W., Roscoe, H. K., Marshall, G. J., Richter, A., Brough, N., and Colwell, S. R.: Vertical structure of Antarctic tropospheric ozone deple-tion events: characteristics and broader implicadeple-tions, Atmos. Chem. Phys., 10, 7775–7794,
5
doi:10.5194/acp-10-7775-2010, 2010. 23951, 23952, 23967
Koo, J.-H., Wang, Y., Kurosu, T. P., Chance, K., Rozanov, A., Richter, A., Oltmans, S. J., Thomp-son, A. M., Hair, J. W., Fenn, M. A., Weinheimer, A. J., RyerThomp-son, T. B., Solberg, S., Huey, L. G., Liao, J., Dibb, J. E., Neuman, J. A., Nowak, J. B., Pierce, R. B., Natarajan, M., and Al-Saadi, J.: Characteristics of tropospheric ozone depletion events in the Arctic spring: analysis
10
of the ARCTAS, ARCPAC, and ARCIONS measurements and satellite BrO observations, At-mos. Chem. Phys., 12, 9909–9922, doi:10.5194/acp-12-9909-2012, 2012. 23953
Krnavek, L., Simpson, W. R., Carlson, D., Domine, F., Douglas, T. A., and Sturm, M.: The chemical composition of surface snow in the Arctic: examining marine, terrestrial, and at-mospheric influences, Atmos. Environ., 50, 349–359, doi:10.1016/j.atmosenv.2011.11.033,
15
2012. 23951
Lehrer, E., Hönninger, G., and Platt, U.: A one dimensional model study of the mechanism of halogen liberation and vertical transport in the polar troposphere, Atmos. Chem. Phys., 4, 2427–2440, doi:10.5194/acp-4-2427-2004, 2004. 23951
Liao, J., Sihler, H., Huey, L. G., Neuman, J. A., Tanner, D. J., Friess, U., Platt, U., Flocke, F. M.,
20
Orlando, J. J., Shepson, P. B., Beine, H. J., Weinheimer, A. J., Sjostedt, S. J., Nowak, J. B., Knapp, D. J., Staebler, R. M., Zheng, W., Sander, R., Hall, S. R., and Ullmann, K.: A comparison of Arctic BrO measurements by chemical ionization mass spectrometry and long path-differential optical absorption spectroscopy, J. Geophys. Res., 116, 1–14, doi:10.1029/2010JD014788, 2011. 23953, 23961, 23964
25
Liao, J., Huey, L. G., Tanner, D. J., Flocke, F. M., Orlando, J. J., Neuman, J. A., Nowak, J. B., Weinheimer, A. J., Hall, S. R., Smith, J. N., Fried, A., Staebler, R. M., Wang, Y., Koo, J.-H., Cantrell, C. A., Weibring, P., Walega, J., Knapp, D. J., Shepson, P. B., and Stephens, C. R.: Observations of inorganic bromine (HOBr, BrO, and Br2) speciation at Barrow, Alaska, in spring 2009, J. Geophys. Res., 117, D00R16, doi:10.1029/2011JD016641, 2012. 23953
30