International Journal for Quality Research 10(3) 547–558 ISSN 1800-6450
Tarun Soota
1Article info: Received 06.01.2016 Accepted 20.07.2016 UDC – 54.061 DOI – 10.18421/IJQR10.03-07
INTEGRATED METHODOLOGY FOR
PRODUCT PLANNING USING MULTI
CRITERIA ANALYSIS
Abstract: Integrated approach to multi-criteria decision problems is proposed using quality function deployment and analytical network process. The objective of the work is to rationalize and improve the method of analyzing and interpreting customer needs and technical requirements. The methodology is used to determine, prioritize engineering requirements based on customer needs for development of best product. Framework allows decision maker to decompose a complex problem in a hierarchical structure to show relationship between objective and criteria. Multi-criteria decision modeling is used for extending the hierarchy process to both dependence and feedback. A case study on bikes is presented for the proposed model.
Keywords: Multi criteria analysis, product planning, AHP, ANP, QFD
1.
Introduction
1While developing new products or improving existing products companies can choose any one or more of the design methods such as robust design, modular design, computer aided design (CAD), value analysis, quality function deployment (QFD) (Wang and Chen, 2012), conjoint analysis (Chaudhuri and Bhattacharyya, 2009), multi-criteria decision making (MCDM) (Soota, 2014). Most companies use a variety of methods to determine the customer requirements and their rating including Conjoint analysis (Chaudhuri and Bhattacharyya, 2009), analytic hierarchy process (AHP), (Rehman and Ahamri, 2013) fuzzy AHP, analytic network process (ANP) (Karsak et al., 2003), fuzzy ANP, fuzzy
1
Corresponding author: Tarun Soota email: tarunsoota@rediffmail.com
weighted average, grey model, PROMETHEE (Ilangkumaran et al., 2013), TOPSIS (Shahroudi and Rouydel, 2012), DEMATEL (Buyukozkan and Cifci, 2012), Vikor, group decision-making approach, etc. Multi criteria methods are commonly in literature for conflicting requirements. Multi-criteria analysis methods have been applied in various ways including AHP, ANP (Ayag and Ozddemir, 2011), TOPSIS (Rao and Patel, 2010), Elimination and choice translating reality (ELECTRE) (Chatterjee et al., 2011; Rehman and Ahamri, 2013), PROMETHEE (Ilangkumaran et al., 2013), TOPSIS (Shahroudi and Rouydel, 2012), Goal programming (Karsak et al., 2003),
requirements.
MCDM may be used for improving customer satisfaction, improving production of reliable and quality products, optimizing design specifications, decreasing costs, increasing efficiency, reducing development time and improving revenues (Zaim et al., 2014). QFD may be used for design of complex systems, investment portfolios and management of services. (Chan and Wu, 2004) After identifying the customer demands about product or service, it is required to determine which technical specifications need to be developed further. A prevalent way to determine what customers want and how to channel their wants into a product design is through the QFD. The House of Quality (HOQ) is a tool used by QFD to define the relationships between customer desires and the product features (Smith, 2011). QFD has been used extensively for helping decision-makers (DMs) in product planning and improvement. The process of traditional quality deployment involving conversion of the customer requirements into technical requirements. Further stages involve part design, process planning and production planning. House of quality (HOQ) is involved in each stage as it tries to form a interrelationship matrix betweens the whats and the hows.
Integrating some of the recent applications with QFD include robot selection (Bhattacharya et al., 2005), robust QFD (Kim et al., 2007), weighted ANP approach for concept development (Zaim et al., 2014),
collaborative product design and optimal selection of module mix (Wang and Chen, 2012), conjoint analysis for concept development (Chaudhuri and Bhattacharyya, 2009), product development methodology (Soota, 2014; Zaim et al., 2014), extensions of QFD (Mehrjerdi, 2010), etc.
ANP involves a broader approach as it overcomes the deficiencies of the AHP and its linear structure.ANP uses the feedbacks and interactions by considering the
super-matrix approach. ANP has been used as the tool to supplement QFD. For instance, Karsak et al. (2003) combined goal programming approach with ANP for product planning in QFD.
An integrated QFD–AHP approach can be successfully used in identifying and prioritizing customer requirements, dealing with conflicting situations, and rank ordering product features (Soota et al., 2014). Some of the recent applications of ANP include product planning with goal programming (Karsak et al., 2003), machine tool selection (Ayag and Ozddemir, 2011), flexible manufacturing system (FMS) selection (Chatterjee and Chakraborty, 2014; Maniya and Bhatt, 2011), product development (Soota et al., 2011; Zaim et al., 2014), optimum material evaluation for manufacturing of automobile bumper (Ilangkumaran et al., 2013), multi-criteria inventory classification (Kabir and Hasin, 2013), operations management review (Subramanian and Ramanathan, 2012), supplier selection (Chatterjee and Chakraborty, 2014; Yazdani, 2014), sustainable energy planning (Pohekar and Ramachandran, 2004), material handling equipment selection (Onut et al., 2009), evaluation of alternative industrial robots (Rehman and Ahamri, 2013), material selection (Rao and Patel, 2010), etc.
2.
MCDM Methodology and
Techniques
ANP is a generic form of AHP. It is more comprehensive, as apart from hierarchical relationships, it also uses feedbacks, interdependencies for evaluation. All the interactions and feedbacks within clusters are called interdependencies where as interactions and feedbacks between clusters are called outer dependencies (Soota et al., 2011). The ANP is a more accurate method
than many other complicated models which use criteria feedback and interrelationship. The method provides a tool to evaluate all the relationships systematically by adding all interactions, interdependences, and feedbacks in Decision Making (DM) system. Relationships between goals, factors, sub factors and alternatives have been represented along with feedbacks as applicable for comparison of AHP and ANP in figure 1.
Figure 1. Comparison of AHP and ANP
The calculation need to be performed to evaluate interdependencies within clusters and outer dependencies between clusters A complicated analysis is necessary to figure out the weights of all components in following circumstances. The model defines all components and relationships which are then determined as two way interactions. ANP approach is capable of capturing and representing the interrelationship between and within QFD components. To enhance the design process, this study takes in to account the ANP in the process of QFD in developing a product.
3.
Proposed Methodology
Representation of ANP in QFD using House of Quality has been shown in figure 2, showing the respective priorities of various dependence and without dependence criteria of customer needs and technical requirements and their respective places.
[ ]
Where w1 is a vector of the CNs that represent the impact of the goal that satisfies a customer. W2 is a matrix that denotes the impact of the CNs on each TRs. W3 and W4 are the matrices that represent the inner dependencies of CNs and inner dependencies of TRs respectively.
2.1.Integrated decision framework
This model works upon to develop comprehensive framework using ANP and quality function deployment. House of Quality (HOQ) which is a planning matrix is used to prioritizing the customer needs against a set of product attributes using QFD and ANP. Initial step involves identification of the customer needs (CNs) and technical requirements (TRs). CNs corresponds to the alternatives which have inner dependence
within themselves.
The decision methodology involves the following procedure: Identification of the customer needs (CNs) and the technical requirements (TRs), determination of the priorities of CNs by assuming that there is no dependence among the CNs (w1), determination of the priorities of TRs with respect to each CN by assuming that there is no dependence among the TRs (W2), determination of the inner dependency matrix of the CNs with respect to each CNs (W3), determination of the inner dependency matrix of the TRs with respect to each TR (W4), determination of the interdependent priorities of the CNs ( Wc = W3 × w1), determination of the interdependent priorities of the TRs (WA=W4 × W2), evaluate overall priorities of TR’s (WANP = WA* WC)
It is used for selection of set of TRs to produce a promising product. It finds the priorities of criteria. It weighs interdependencies in TRs to evaluate the modified HOQ. A case study was carried out on bikes for illustration of the above approach.
4.
Case study
Table 1. Pairwise comparison of customer needs
Customer
requirements W1
Milea ge C om fo rt Han dlin g An d C on tr ol Saf ety Aesth etic R eliab ilit y Sp ee d Prio rities (W 1 )
Mileage 1 3 3 4 3 3 2 0.29
Comfort 1/3 1 1/2 1/4 1/2 1/4 2 0.07
Handling and control 1/3 2 1 1/3 1 1/3 1 0.08
Safety 1/4 4 3 1 4 3 3 0.22
Aesthetics 1/3 2 1 1/4 1 1/3 1/2 0.07
Reliability 1/3 4 3 1/3 3 1 1/3 0.14
Speed 1/2 1/2 1 1/3 2 3 1 0.12
After finding the priorities of customer needs and TRs need to be found considering that they are likely to affect these needs. They are identified as Power, Suspension, Brakes, Tyres, Low weight, Auto-choke, LED Lamps and lights, Electric start, Alloy wheels, Battery.
Matrix W2 evaluation It determines the degree of importance with respect to each Customer Needs by assuming that there is no dependence among the Technical
Requirements. The Technical Requirements are compared with respect to each customer requirements assuming no dependence yielding the eigenvectors regarding each customer need (Soota et al., 2011).
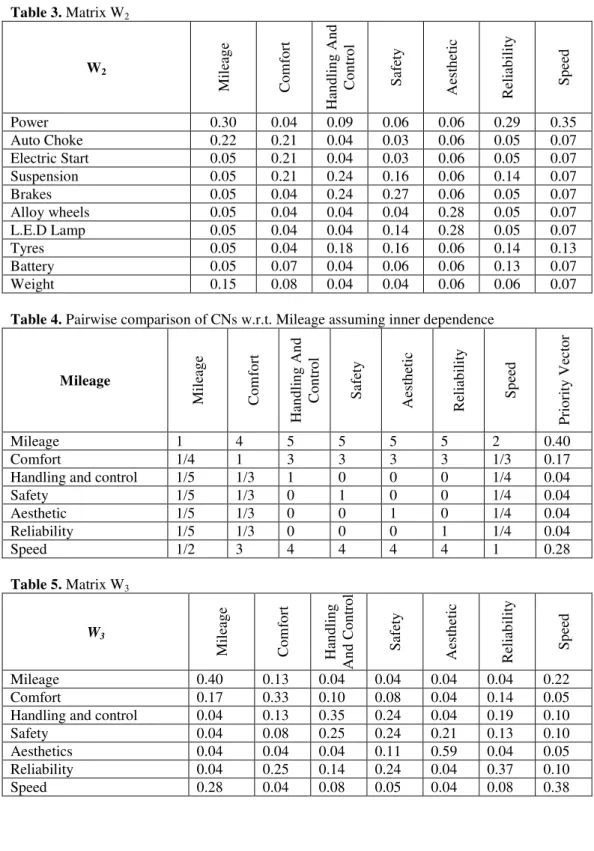
Such a matrix w.r.t. C.N. Mileage is illustrated in Table 2. The process is repeated for each C.N. and final matrix W2 obtained after the process is shown in Table 3.
Table 2. Pairwise comparison of technical requirements w.r.t. Mileage
MIileage Po wer Au to C ho ke E lectr ic star t Su sp en sio n B rak es Allo y W hee ls L .E .D L am p T yr es B atter y W eig ht Prio rity Vec to r
Power 1 3 5 5 5 5 5 5 5 3 0.30
Auto Choke 1/3 1 5 5 5 5 5 5 5 1 0.22
Electric Start 1/5 1/5 1 1 1 1 1 1 1 1/3 0.05
Suspension 1/5 1/5 1 1 1 1 1 1 1 1/3 0.05
Brakes 1/5 1/5 1 1 1 1 1 1 1 1/3 0.05
Alloy wheels 1/5 1/5 1 1 1 1 1 1 1 1/3 0.05
L.E.D Lamp 1/5 1/5 1 1 1 1 1 1 1 1/3 0.05
Tyres 1/5 1/5 1 1 1 1 1 1 1 1/3 0.05
Battery 1/5 1/5 1 1 1 1 1 1 1 1/3 0.05
Table 3. Matrix W2 W2 Milea ge C om fo rt Han dlin g An d C on tr ol Saf ety Aesth etic R eliab ilit y Sp ee d
Power 0.30 0.04 0.09 0.06 0.06 0.29 0.35
Auto Choke 0.22 0.21 0.04 0.03 0.06 0.05 0.07
Electric Start 0.05 0.21 0.04 0.03 0.06 0.05 0.07
Suspension 0.05 0.21 0.24 0.16 0.06 0.14 0.07
Brakes 0.05 0.04 0.24 0.27 0.06 0.05 0.07
Alloy wheels 0.05 0.04 0.04 0.04 0.28 0.05 0.07
L.E.D Lamp 0.05 0.04 0.04 0.14 0.28 0.05 0.07
Tyres 0.05 0.04 0.18 0.16 0.06 0.14 0.13
Battery 0.05 0.07 0.04 0.06 0.06 0.13 0.07
Weight 0.15 0.08 0.04 0.04 0.06 0.06 0.07
Table 4. Pairwise comparison of CNs w.r.t. Mileage assuming inner dependence
Mileage Milea ge C om fo rt Han dlin g An d C on tr ol Saf ety Aesth etic R eliab ilit y Sp ee d Prio rity Vec to r
Mileage 1 4 5 5 5 5 2 0.40
Comfort 1/4 1 3 3 3 3 1/3 0.17
Handling and control 1/5 1/3 1 0 0 0 1/4 0.04
Safety 1/5 1/3 0 1 0 0 1/4 0.04
Aesthetic 1/5 1/3 0 0 1 0 1/4 0.04
Reliability 1/5 1/3 0 0 0 1 1/4 0.04
Speed 1/2 3 4 4 4 4 1 0.28
Table 5. Matrix W3
W3 Milea ge C om fo rt Han dlin g An d C on tr ol Saf ety Aesth etic R eliab ilit y Sp ee d
Mileage 0.40 0.13 0.04 0.04 0.04 0.04 0.22
Comfort 0.17 0.33 0.10 0.08 0.04 0.14 0.05
Handling and control 0.04 0.13 0.35 0.24 0.04 0.19 0.10
Safety 0.04 0.08 0.25 0.24 0.21 0.13 0.10
Aesthetics 0.04 0.04 0.04 0.11 0.59 0.04 0.05
Reliability 0.04 0.25 0.14 0.24 0.04 0.37 0.10
Matrix W3 evaluation : It is the matrix
between the customer needs and the customer needs assuming the inner dependency among the customer needs. The inner dependence among the technical requirements is determined through analyzing the impact of each technical requirement on other technical requirements by using pairwise comparisons (soota et al 2011). One such pairwise comparison w.r.t. CN Mileage is shown below in table 4. The process is repeated for each C.N. The resulting eigenvectors obtained from pairwise comparisons are presented in table 5 i.e. final matrix W3
Matrix W4 evaluation It is the matrix
between technical requirements and technical requirements assuming inner dependency among the technical requirements. The inner dependence among the technical requirements is determined through analyzing the impact of each technical requirement on other technical requirements by using pairwise comparisons. One such pairwise comparison w.r.t. T.R. power is shown below in table 6. The process is repeated for each C.N. The resulting eigenvectors obtained from pairwise comparisons are presented in table 7 i.e. final matrix W4 .
Table 6. Pairwise comparison of TRs w.r.t. power assuming inner dependenc
e
Power Po wer Au to C ho ke E lectr ic star t Su sp en sio n B rak es Allo y W hee ls E .D L am p T yr es B atter y W eig ht Prio rity Vec to r
Power 1 5 5 5 5 5 5 5 5 4 0.58
Auto Choke 1/5 1 0 0 0 0 0 0 0 1/2 0.03
Electric Start 1/5 0 1 0 0 0 0 0 0 1/2 0.03
Suspension 1/5 0 0 1 0 0 0 0 0 1/2 0.03
Brakes 1/5 0 0 0 1 0 0 0 0 1/2 0.03
Alloy wheels 1/5 0 0 0 0 1 0 0 0 1/2 0.03
L.E.D Lamp 1/5 0 0 0 0 0 1 0 0 1/2 0.03
Tyres 1/5 0 0 0 0 0 0 1 0 1/2 0.03
Battery 1/5 0 0 0 0 0 0 0 1 1/2 0.03
Weight 1/4 2 2 2 2 2 2 2 2 1 0.22
Table 7. Matrix W4
W4 Po wer Au to C ho ke E lectr ic star t Su sp en sio n B rak es Allo y W hee ls L .E .D L am p T yr es B atter y W eig ht
Power 0.58 0.02 0.02 0.03 0.03 0.03 0.02 0.03 0.02 0.10
Alloy wheels 0.03 0.02 0.03 0.03 0.03 0.58 0.02 0.03 0.03 0.10 L.E.D Lamp 0.03 0.14 0.14 0.03 0.03 0.02 0.27 0.02 0.15 0.10
Tyres 0.03 0.02 0.02 0.03 0.03 0.03 0.02 0.58 0.02 0.10
Battery 0.03 0.27 0.29 0.03 0.03 0.02 0.27 0.02 0.32 0.10 Weight 0.22 0.02 0.02 0.22 0.22 0.22 0.02 0.22 0.02 0.10
Matrix Wc evaluation: Calculated by multiplying W3 and W1.i.e. WC = W3*W1 Wc T = 0.171 0.155 0.142 0.141
0.076 0.160 0.148
Calculation of Matrix WA: Calculated by
multiplying W4 and W2, i.e. WA= W4*W2, as shown below in table 8.
Table 8. Matrix WA
0.2241 0.0666 0.0868 0.0703 0.0756 0.2012 0.2370
0.1024 0.1301 0.0514 0.0642 0.0946 0.0797 0.0761
0.0798 0.1252 0.0510 0.0645 0.0940 0.0808 0.0754
0.0866 0.1601 0.1693 0.1253 0.0756 0.1187 0.0830
0.0866 0.0666 0.1693 0.1858 0.0756 0.0692 0.0830
0.0866 0.0666 0.0593 0.0593 0.1966 0.0692 0.0830
0.0781 0.1059 0.0510 0.0782 0.1226 0.0792 0.0754
0.0866 0.0666 0.1363 0.1253 0.0756 0.1187 0.1160
0.0810 0.1172 0.0506 0.0662 0.0956 0.0827 0.0747
0.1020 0.0980 0.0990 00990 0.1040 0.1010 0.1040
Calculation of Matrix WANP : Calculated by
multiplying WA and WC. WANP=WA*WC
WANP T = 0.144 0.085 0.080 0.118 0.104 0.080 0.081 0.104 0.080 0.100 The respective weights of TRs as determined from WANP are shown in Table 9 below.
Table 9. Respective weights of TRs as determined from WANP
Power 0.144
Auto Choke 0.085
Electric Start 0.080
Suspension 0.118
Brakes 0.104
Alloy Wheels 0.080
LeD lamps 0.081
Tyres 0.104
Battery 0.080
Weight 0.100
The various columns in the House Of Quality are filled by the various matrices that were calculated with the help of A.N.P. This
Table 10. HOQ between CNs and TRs HOQ Tec hn ica l Re qu irem en ts P rio rit ies P owe r Au to c ho ke El ec tri c sta rt S usp en si on Bra ke s Allo y w he els LE D t ail Lam ps Ty re s Ba tt ery Lo w we ig ht Cu sto m er Re qu irem en
ts Mileage 0.29 0.3 0.22 0.05 0.05 0.05 0.05 0.05 0.05 0.05 0.15
Comfort 0.07 0.04 0.21 0.21 0.21 0.04 0.04 0.04 0.04 0.07 0.08 Handling
& Control 0.08 0.09 0.04 0.04 0.24 0.24 0.04 0.04 0.18 0.04 0.04 Safety 0.22 0.06 0.03 0.04 0.16 0.27 0.04 0.14 0.16 0.06 0.04 Aesthetics 0.07 0.06 0.06 0.06 0.06 0.06 0.28 0.28 0.06 0.06 0.06 Reliability 0.14 0.29 0.05 0.05 0.14 0.05 0.05 0.05 0.14 0.13 0.06 Speed 0.12 0.35 0.07 0.07 0.07 0.07 0.07 0.07 0.13 0.07 0.07
WANP 0.14
4 0.08
5 0.08 0.11
8 0.10
47 0.08 0.08
1 0.10
4 0.08 0.1
5.
Conclusions
The proposed method illustrates the use of decision tools to evaluate product attributes and requirements. It is used to identify the essential product features and determine the design targets qualitatively and objectively through a series of proven multi criteria decision methodologies. This approach incorporates the Voice of Customer (VOC) in order to interpret the customer requirements and translate it using the demands to desirable design features of product.
The ANP process not only evaluates the outer independence (among different elements) but also finds inner dependence (within a set of elements).
It enables incorporating several matrices into an integrated super matrix involving
four-level hierarchy structure and dealing with inner dependences without independence assumptions. It involves refinement of requirement using matrices and charts based on group decided priorities. The customer requirement mileage is most preferred with a weight of 0.29. In order to provide good mileage to the customers power is the TR that influences it the most with a weight of 0.30. The second requirement is safety with 0.22 weight which can be fulfilled by awesome suspension system with 0.16 weight, advanced braking systems like A.B.S anti-lock braking systems with 0.27 weight as well as good road gripping tyres with 0.16 weight. The proposed method is comprehensive and suitable to solve multi-criteria issues to for better decisions in planning or evaluation problems.
References
:
Ayağ, Z. & Özdemir, R. (2009). An intelligent approach to machine tool selection through fuzzy analytic network process. J Intell Manuf, 22(2), 163-177.
http://dx.doi.org/10.1007/s10845-009-0269-7
Bhattacharya, A., Sarkar *, B., & Mukherjee, S. (2005). Integrating AHP with QFD for robot selection under requirement perspective. International Journal Of Production Research,
Büyüközkan, G. & Çifçi, G. (2012). A novel hybrid MCDM approach based on fuzzy DEMATEL, fuzzy ANP and fuzzy TOPSIS to evaluate green suppliers. Expert Systems With Applications, 39(3), 3000-3011. http://dx.doi.org/10.1016/j.eswa.2011.08.162
Chan, L. (2005). A systematic approach to quality function deployment with a full illustrative example. Omega, 33(2), 119-139. http://dx.doi.org/10.1016/j.omega.2004.03.010
Chatterjee, P., & Chakraborty, S. (2014). Investigating the effect of normalization norms in Flexible manufacturing system selection using multi criteria decision making methods,
Journal of Engineering Science and Technology Review, 7(3), 141–150.
Chatterjee, P., Manikrao Athawale, V., & Chakraborty, S. (2010). Selection of industrial robots using compromise ranking and outranking methods. Robotics And Computer-Integrated Manufacturing, 26(5), 483-489. http://dx.doi.org/10.1016/j.rcim.2010.03.007
Chaudhuri A., & Bhattacharyya M. (2009). A combined QFD and integer programming framework to determine attribute levels for conjoint study, International Journal of Production Research, 47(23), 6633–6649.
Ilangkumaran, M., Avenash, A., Balakrishnan, V., Kumar, S., & Raja, M. (2013). Material selection using hybrid MCDM approach for automobile bumper. IJISE, 14(1), 20. http://dx.doi.org/10.1504/ijise.2013.052919
Karsak, E., Sozer, S., & Alptekin, S. (2003). Product planning in quality function deployment using a combined analytic network process and goal programming approach. Computers & Industrial Engineering, 44(1), 171-190. http://dx.doi.org/10.1016/s0360-8352(02)00191-2 Kim, K., Kim, D., & Min, D. (2007). Robust QFD: framework and a case study. Qual. Reliab.
Engng. Int., 23(1), 31-44. http://dx.doi.org/10.1002/qre.821
Maniya, K. & Bhatt, M. (2011). The selection of flexible manufacturing system using
preference selection index method. IJISE, 9(3), 330.
http://dx.doi.org/10.1504/ijise.2011.043142
Zare Mehrjerdi, Y. (2010). Quality function deployment and its extensions. Int J Qual & Reliability Mgmt, 27(6), 616-640. http://dx.doi.org/10.1108/02656711011054524
Onut, S., Kara, S., & Mert, S. (2009). Selecting the suitable material handling equipment in the presence of vagueness. The International Journal Of Advanced Manufacturing Technology,
44(7-8), 818-828. http://dx.doi.org/10.1007/s00170-008-1897-3
Pohekar, S. & Ramachandran, M. (2004). Application of multi-criteria decision making to sustainable energy planning—A review. Renewable And Sustainable Energy Reviews, 8(4), 365-381. http://dx.doi.org/10.1016/j.rser.2003.12.007
Rao, R. (2006). Machine group selection in a flexible manufacturing cell using digraph and matrix methods. IJISE, 1(4), 502. http://dx.doi.org/10.1504/ijise.2006.010389
Rao, R. & Patel, B. (2010). A subjective and objective integrated multiple attribute decision making method for material selection. Materials & Design, 31(10), 4738-4747. http://dx.doi.org/10.1016/j.matdes.2010.05.014
Rehman, A. & Ahamri, A. (2013). Evaluation of alternative industrial robots using AHP and
ELECTRE: a comparative study. IJISE, 14(1), 58.
http://dx.doi.org/10.1504/ijise.2013.052921
Shahroudi, K., & Rouydel, H. (2012). Using a multi criteria decision making approach (ANP-
Smith, A. (2011). Competitive approaches to new product development. Team Performance Management, 17(3/4), 124-145. http://dx.doi.org/10.1108/13527591111143682
Soota T., (2014) Integrated approach to multi criteria decision making for sustainable product development, International Journal for Quality Research, 8(4), 543–556.
Soota, T., Singh, H., & Mishra, R. (2008). Defining Characteristics for Product Development Using Quality Function Deployment: A Case Study on Indian Bikes. Quality Engineering,
20(2), 195-208. http://dx.doi.org/10.1080/08982110701672463
Soota, T., Singh, H., & Mishra, R., (2011). Fostering product development using combination of QFD and ANP: a case study, J. Ind. Eng. Int., 7(14), 29–40.
Subramanian, N. & Ramanathan, R. (2012). A review of applications of Analytic Hierarchy Process in operations management. International Journal Of Production Economics, 138(2), 215-241. http://dx.doi.org/10.1016/j.ijpe.2012.03.036
Wang, C. & Chen, J. (2012). Using quality function deployment for collaborative product design and optimal selection of module mix. Computers & Industrial Engineering, 63(4), 1030-1037. http://dx.doi.org/10.1016/j.cie.2012.06.014
Yazdani, M. (2014). An integrated MCDM approach to green supplier selection. International
Journal Of Industrial Engineering Computations, 5(3), 443-458.
http://dx.doi.org/10.5267/j.ijiec.2014.3.003
Zaim, S., Sevkli, M., Camgöz-Akdağ, H., Demirel, O., Yesim Yayla, A., & Delen, D. (2014). Use of ANP weighted crisp and fuzzy QFD for product development. Expert Systems With Applications, 41(9), 4464-4474. http://dx.doi.org/10.1016/j.eswa.2014.01.008
Tarun Soota
Bundelkhand Institute of Engineering & Technology, Department of mechanical engineering Jhansi 284128 India