Transcriptome analysis and gene expression profiling of abortive and developing ovules during fruit development in hazelnut.
Texto
Imagem


Documentos relacionados
O marketing por e-mail é classificado como uma estratégia de marketing direto já que as empresas enviam mensagens aos potenciais clientes, dando conhecer os seus
Dialypetalanthus is a monospecifi c genus that occurs in the Amazon Basin of Brazil, Bolivia and Peru and occupies a controversial position among the Rubiaceae. We continue
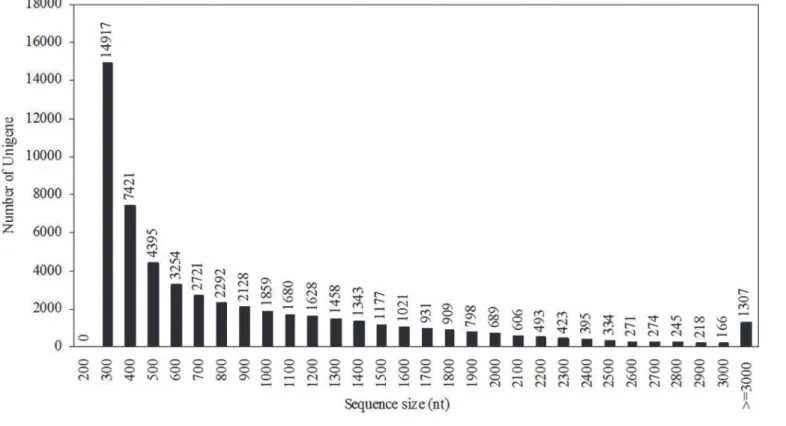
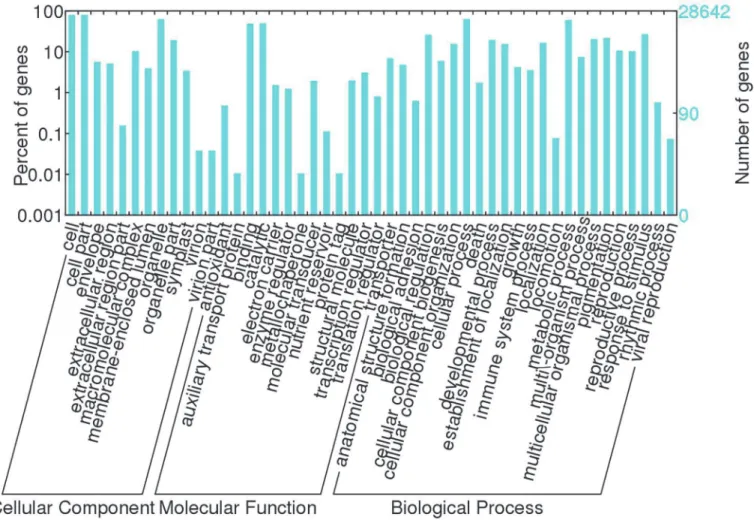
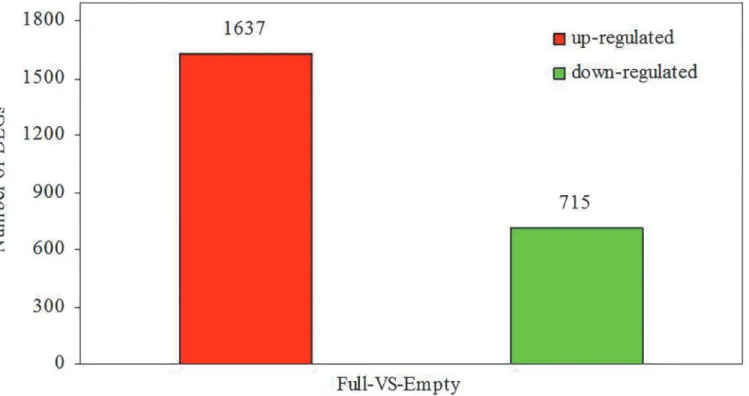
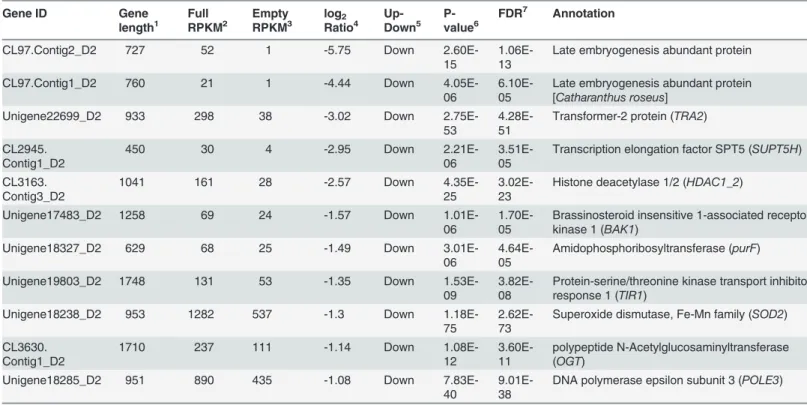
Results: A prerequisite for differential gene expression analysis was the generation of a reference hybrid transcriptome atlas by assembly of Sanger, 454 and Illumina sequence data.
In order to explore the sex-biased gene expression in crab, we per- formed the whole-body transcriptome analysis in male and female juveniles of the Chinese mitten crab
We performed transcriptome analysis of pre-tumorous retina and retinal tumor tissue and found changes in gene expression signatures of radial glia and astrocytes ( slc1a3 ),
Our systematic analysis utilized a combination of comparative genomic scanning, functional pathway analysis and gene expression profiling to uncover previously unidentified
In order to further characterize the differences in aging patterns between cortex and cerebellum, we calculated the average expression levels in one representative region of
Cufflinks analysis of gene isoform expression levels, alternative splicing and alternative promoter usage revealed significant differences in transcriptome profiles between frontal
