The Effects of Season of Birth on the
Inflammatory Response to Psychological
Stress in Hainan Island, China
Aki Yazawa1☯
*, Yosuke Inoue1☯, Andrew Stickley1,2, Dandan Li3, Jianwei Du3,
Chiho Watanabe1
1Department of Human Ecology, Graduate School of Medicine, the University of Tokyo, Bunkyo, Tokyo, Japan,2The Stockholm Center for Health and Social Change (Scohost), Södertörn University, Huddinge, Stockholm, Sweden,3Hainan Center for Disease Control and Prevention, Haikou, Hainan, China
☯These authors contributed equally to this work. *aki-y@humeco.m.u-tokyo.ac.jp
Abstract
Season of birth (SOB) has been investigated as one of the environmental factors that might epigenetically determine the physiology of individuals. This study investigated the role of SOB in the association between Quality of Life (QOL), a proxy of psychological stress sta-tus, and C-reactive protein (CRP) concentration (i.e., inflammatory status) among 1,085 adults (aged 20–57 years old) in Hainan Island, China. High sensitivity CRP concentration was measured in dried blood spot samples, while the abbreviated version of the World Health Organization’s QOL questionnaire was used to gather information on six QOL domains. Analysis stratified by three historically distinct age groups revealed a significant association between CRP concentration, SOB, QOL and an interaction between SOB and QOL among the youngest and oldest groups. In the oldest group, those born in the dry sea-son had a higher CRP concentration with worse QOL whereas in the youngest group, there was a higher CRP concentration with better QOL. Annual per capita rice production, a proxy of population nutritional status in the year of birth, was found to predict CRP concentration only among the second oldest group. These findings suggest that the early environment might affect the immune response to psychological stress in adulthood and that its effect may differ by the time period in which people were born.
Introduction
Research has shown that the early life environment (i.e., in the fetal period, infancy and child-hood) can epigenetically determine the physiology of individuals and have a life-long effect on health [1]. Season of birth (SOB) is one of the environmental factors that has been previously investigated as it can reflect ecological differences in conditions in early life, such as tempera-ture, precipitation and humidity, and thus, pathogen exposure or experience of food shortage that can have a substantial effect on human physiological development [2].
OPEN ACCESS
Citation:Yazawa A, Inoue Y, Stickley A, Li D, Du J, Watanabe C (2015) The Effects of Season of Birth on the Inflammatory Response to Psychological Stress in Hainan Island, China. PLoS ONE 10(10): e0139602. doi:10.1371/journal.pone.0139602
Editor:Amanda Bruce, The University of Kansas Medical Center, UNITED STATES
Received:March 20, 2015
Accepted:September 14, 2015
Published:October 8, 2015
Copyright:© 2015 Yazawa et al. This is an open access article distributed under the terms of the
Creative Commons Attribution License, which permits unrestricted use, distribution, and reproduction in any medium, provided the original author and source are credited.
Data Availability Statement:All relevant data are within the paper and its Supporting Information files.
Evidence suggests that the effects of SOB can manifest themselves across the life course. In a recent review of epidemiological evidence on seasonality of birth outcomes and the impact of climate, Strand et al. [3] identified 20 studies that reported seasonality in birth outcomes, namely preterm birth, stillbirth and low birth weight, and reported that extreme temperature (both low and high temperature) was associated with these undesirable birth outcomes, which have themselves been linked with future chronic diseases like hypertension, diabetes and obe-sity [4]. Among adults, differences in SOB have been linked to variations in both health behav-iors (e.g., smoking) [5] and health outcomes (body mass index [BMI], chronic diseases, suicide, mortality and longevity) [6–9].
Although the physiological mechanisms underlying the association between SOB and health are uncertain, research by McDade et al. [10] has focused on differences in C-reactive protein (CRP) concentration, which is a plasma protein involved in the systemic response to inflamma-tion, and regarded as a risk marker for future chronic diseases [11,12], as a possible factor linking SOB and health outcomes. In a study of young adults aged 20–22 years old in the Phil-ippines, they showed that CRP concentration was influenced by SOB. More specifically, the association between psychological stress (as indexed by the Perceived Stress Scale) and CRP concentration was positive among those who were born in the‘not dry season’, whereas no such association was observed among those born in the dry season. This led them to highlight the importance of nutritional and microbial exposure in infancy as potential factors that differ-entiate physiological development by SOB [10]. Their findings also suggest that the effects of SOB might be manifested in the form of a physiological response to psychological stressors.
The current study was designed to build on and extend the earlier study by McDade and colleagues in several ways. First, the current study was undertaken in China—a country which experienced especially dramatic societal changes during the second half of the twentieth cen-tury. Given the unique social, economic and political events that occurred during that period, and the possibility that they may have impacted on the early life environment in different ways (e.g., through improvement in agricultural technology [13]), we examined the SOB—CRP asso-ciation for participants born in three distinct historical epochs: (i) after World War II to the end of the Great Leap Forward (1953–1962), (ii) the Cultural Revolution (1963–1977) and (iii) the period of early economic reforms (1978–1990) [14,15]. Second, it is also possible that inter-year variation in population nutritional status within each epoch further affected the SOB— CRP association. Indeed, there is evidence that food production and availability fluctuated greatly across the period [16], to the point where there was even famine (in 1958 to 1962) [14]. Thus, to examine the effects of early life nutritional status on inflammatory response in adult-hood we used data on per capita annual rice production (available from 1953 to 1990 [16]) as a proxy measure for population nutritional status in the year when people were born. Third, this historical focus enabled us to use data from participants with a much broader age range than had been previously examined.
The specific aims of this study were therefore to determine whether SOB affects the inflam-matory reaction (indexed as CRP concentration) to psychological stressors (as measured by the Quality of Life [QOL] score) among adults and whether there are differences in these relations between different age groups, or in relation to the availability of food during the participants’ formative years.
Methods
Study location
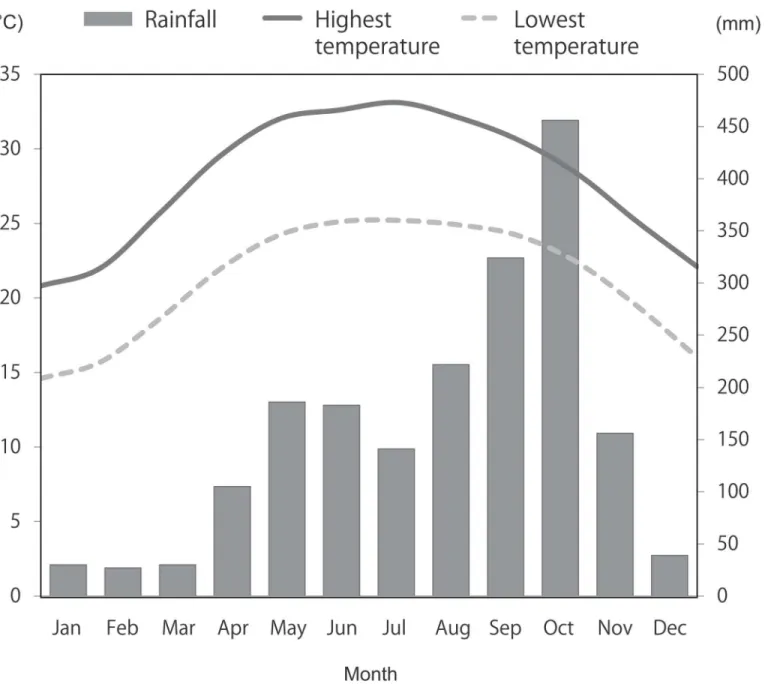
This study used data from Hainan Island, China, which is located to the south of mainland China. It has a land area of 33,210 km2with a subtropical monsoon climate with two distinct Competing Interests:The authors have declared
seasons (i.e., a rainy season and a dry season), an annual average temperature ranging from 18°C to 25°C and annual precipitation ranging from 1,500 mm to 2,000 mm. For statistical purposes, in this study the period between May to October was defined as the rainy season and the other six months of the year as the dry season. This division was based on monthly precipi-tation data: the average monthly precipiprecipi-tation was 252.0 mm for the rainy season and 64.5 mm for the dry season [17] (seeFig 1).
In 1949, the People’s Republic of China was established after the Chinese Civil War. From that point until the beginning of the 1990s, there were 3 distinct historical periods. The‘Great Leap Forward’, which lasted until the early 1960s was marked by land reform and ongoing rev-olution and culminated in a severe famine (the Great Famine) [14]. This was followed by the period of‘Cultural Revolution’which was notable for political confusion, unrest and repres-sion. At the end of the 1970s a new and distinct historical phase began with the introduction of a market economy (economic reform) in 1978 [15]. Although the economy in Hainan Island remained comparatively underdeveloped for a longer period of time when compared with other parts of the country, residents also experienced pronounced changes in their living envi-ronment which gathered pace after 1990 [18,19].
Field survey and biomarker data collection
This study was undertaken as part of a collaborative research project between the University of Tokyo and Hainan Provincial Center for Disease Control and Prevention, China. To recruit participants, convenience sampling was conducted in 21 communities in 6 different regions, which encompassed the range of economic development across the island. Questionnaire data and dried blood spot (DBS) samples were collected in November to December, 2010. All of the people residing in the selected study communities were invited to participate in the study. Interviews were conducted by trained fieldworkers with information being obtained on a vari-ety of demographic and socioeconomic indicators including age (in years), date of birth, sex, BMI, educational attainment (schooling of less than 9 years; equivalent to 9 years; and more than 9 years) and marital status (currently married; and not currently married). The current study involved participants who were born in the period between 1953 and 1990 when China experienced rapid, large-scale change in all aspects of life (e.g., income levels, hygienic condi-tions, energy intake, dietary composition and so on [13]), i.e., those who were aged 20–57 years old as of 2010. Those who did not provide information on their month of birth (n = 336) were excluded from the analysis.
The abbreviated version of the World Health Organization’s Quality of Life questionnaire (WHOQOL-BREF) (Chinese version) [20] was used to evaluate subjective QOL of the respon-dents. The WHOQOL-BREF comprises 26 items that encompass a number of different aspects of life, all of which are scored using a five-point Likert scale, with higher scores indicating a bet-ter QOL. The first two items evaluate overall QOL and general health, whereas the remaining 24 items are divided into four QOL domains:physicaldomain,psychologicaldomain,social relationshipdomain andenvironmentdomain. The six subscale scores were dichotomized at the median in the statistical analysis in order to make our results more comparable with those from McDade et al. [10] where Perceived Stress Scale scores were dichotomized when assessing psychological stress.
judged as experiencing inflammation due to acute infection [22], and were excluded from the analysis.
Statistical analysis
A least-squares regression analysis was used to investigate the association between log-trans-formed CRP concentration and each QOL domain score. As the WHOQOL-BREF provides a profile of scores across six different aspects of QOL we followed the lead of several previous studies that have focused separately on the individual domains [23–25]. Statistical analyses were initially undertaken including all participants. Subsequent analyses were then performed separately for the three historical age groups (20–32, 33–47, 48–57 years old) to examine Fig 1. Average monthly temperature and rainfall in Hainan Island, China (2000–2012).Data source: World Weater Online.
whether any observed associations differed between them. Each model included an interaction term for the QOL score and SOB to examine whether the association between the QOL scores and CRP concentration might be modified by SOB, that is, the early life environment. In addi-tion, data on annual per capita rice production were also included in each statistical model. The rice production data was obtained from a (Chinese) publication entitled,‘A History of Hainan Province—Food History’[16] and reported in terms of yearly gross production (kg). The annual population of the island was used as the denominator when calculating yearly per capita production. Other covariates included in all analyses were age (a continuous variable in years), sex, BMI (kg/m2), educational attainment (schooling of less than 9 years; equivalent to 9 years; and more than 9 years), and marital status (currently married; and not currently married).
All statistical analyses were conducted using Stata version 13.1 (StataCorp, College Station, TX). The level of statistical significance was set atp<0.05. The data used in the analyses is
pro-vided in Supporting Information (S1 Dataset).
Ethical approval
The study protocol was approved by the Research Ethics Committee at the Graduate School of Medicine, University of Tokyo (ethnical approval No. 3406) and Hainan Provincial Center for Disease Control and Prevention. Written informed consent was obtained from all study partic-ipants before they were enrolled into the study.
Results
Characteristics of the study participants
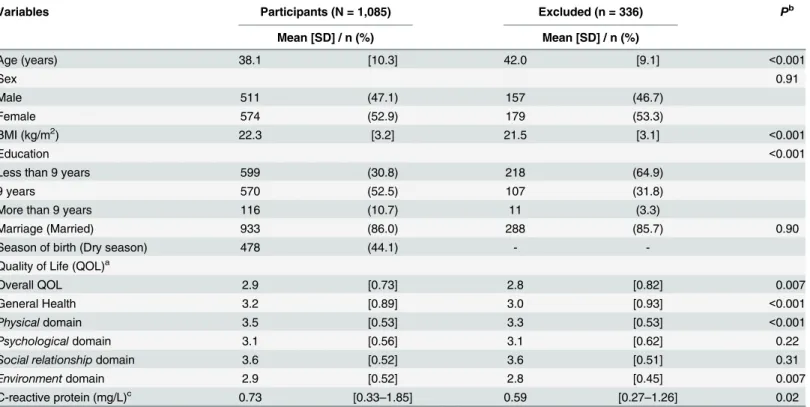
Characteristics of the study participants are shown inTable 1. Among the 1,085 participants included in the analysis, 47.1% were male. The mean age of the participants was 38.1 years (standard deviation [SD] 10.3), while they had a mean BMI of 22.3 (SD 3.2). Forty-four percent of the study subjects were born in the dry season. The median CRP concentration (inter-quar-tile range) was 0.73 (0.33–1.85) mg/L. The mean overall QOL score was 2.9 (SD 0.7), while the scores in the other domains were: general health 3.2 (SD 0.9),physicaldomain 3.5 (SD 0.5), psychologicaldomain 3.1 (SD 0.6),social relationshipdomain 3.6 (SD 0.5) andenvironment domain 2.9 (SD 0.5).
Relationship between CRP concentration, QOL scores, SOB and annual
per capita rice production
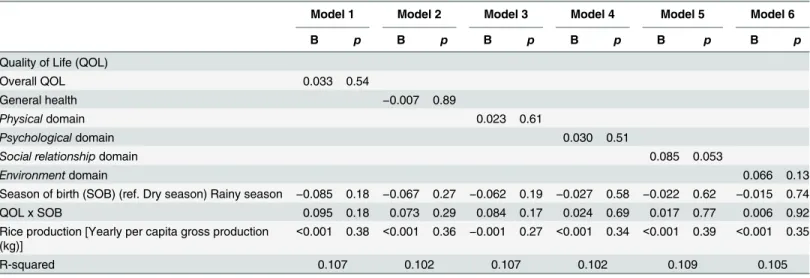
Table 2shows the results of a least-squares regression analysis investigating the association between CRP concentration, the QOL score for each domain, SOB and annual per capita rice production among all of the participants. None of the QOL domain scores were associated with CRP concentration. Similarly, SOB was not associated with CRP concentration in any of the models. Further examination of these variables using an interaction term for QOL and SOB also produced no significant associations, while annual per capita rice production was also not associated with CRP concentration in any model. In terms of the control variables age (a continuous variable in years) was not associated with CRP concentration, while BMI was posi-tively associated with CRP concentration in all models, as was being male (data not shown). Neither educational attainment nor marital status associated with CRP concentration (data not shown).
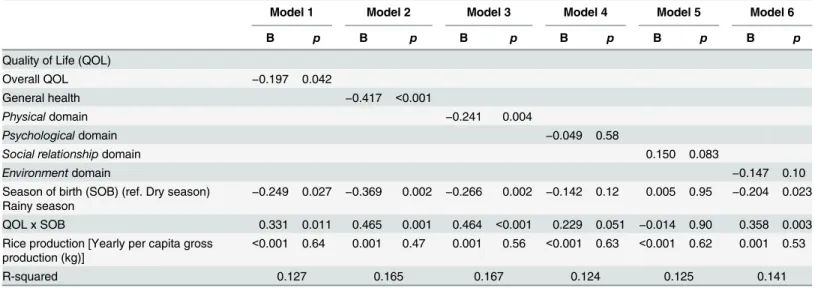
20–32 year old for theenvironmentdomain (coefficient = 0.200,p= .013) (Table 3) and among those aged 33–47 years old for thephysicaldomain (coefficient = 0.163,p= .018) (Table 4). There were significant negative associations among participants aged 48–57 years old for overall QOL (coefficient =−0.197,p= .042), for general health (coefficient =−0.417,p<.001) and for thephysicaldomain (coefficient =−0.241,p= .004) (Table 5). For those who were born in the rainy season among the oldest age group (48–57), overall QOL (coefficient =−0.249,p= .027), general health (coefficient =−0.369,p= .002),physicaldomain (coefficient =−0.266,p= .002) andenvironmentdomain (coefficient =−0.204,p= .023) were all associated with a lower CRP concentration (Table 5). There was no statistically significant association between CRP concen-tration and the interaction between each QOL score and SOB among participants aged 20–32 and 33–47 years old, except for the model withenvironmentdomain among participants aged 20–32 (coefficient =−0.227,p= .035) (Table 3). A statistically significant interaction between QOL and SOB was observed among participants aged 48–57 years old for overall QOL (coeffi-cient = 0.331,p= .011), general health (coefficient = 0.465,p= .001),physicaldomain (coeffi-cient = 0.464,p<.001), andenvironmentdomain (coefficient = 0.358,p= .003) (Table 5).
Rice production was significantly inversely associated with CRP concentration in all of the models among participants aged 33–47 years old (Table 4), while it was not associated with CRP concentration in any models among the other two age groups.
Fig 2A–2Eillustrates predicted CRP concentration for SOB and QOL after adjusting for var-iables included in the models where a statistically significant interaction was detected between Table 1. Characteristics of included and excluded participants (aged 20–57 years old).
Variables Participants (N = 1,085) Excluded (n = 336) Pb
Mean [SD] / n (%) Mean [SD] / n (%)
Age (years) 38.1 [10.3] 42.0 [9.1] <0.001
Sex 0.91
Male 511 (47.1) 157 (46.7)
Female 574 (52.9) 179 (53.3)
BMI (kg/m2) 22.3 [3.2] 21.5 [3.1] <0.001
Education <0.001
Less than 9 years 599 (30.8) 218 (64.9)
9 years 570 (52.5) 107 (31.8)
More than 9 years 116 (10.7) 11 (3.3)
Marriage (Married) 933 (86.0) 288 (85.7) 0.90
Season of birth (Dry season) 478 (44.1) -
-Quality of Life (QOL)a
Overall QOL 2.9 [0.73] 2.8 [0.82] 0.007
General Health 3.2 [0.89] 3.0 [0.93] <0.001
Physicaldomain 3.5 [0.53] 3.3 [0.53] <0.001
Psychologicaldomain 3.1 [0.56] 3.1 [0.62] 0.22
Social relationshipdomain 3.6 [0.52] 3.6 [0.51] 0.31
Environmentdomain 2.9 [0.52] 2.8 [0.45] 0.007
C-reactive protein (mg/L)c 0.73 [0.33
–1.85] 0.59 [0.27–1.26] 0.02
a: Quality of Life was scored by WHOQOL-BREF. b
: Student’s t-test for continuous values and Pearson’s chi-square test for categorical values were conducted to examine if there were differences for variable scores between the participants and those who were excluded.
c: Median and inter-quartile range is shown for C-reactive protein concentration.
QOL and SOB. Among the oldest age group, people who were born in the dry season had increased CRP concentration with a higher level of stress (i.e., as indicated by a lower QOL in terms of overall QOL, general health, and in thephysicaldomain) (Fig 2B–2D), while people who were born in the rainy season had decreased CRP concentration when their stress level Table 2. The association between log-transformed CRP concentration and QOL scores, SOB and rice production among participants aged 20–57
in Hainan Island, China in 2010 (N = 1,085).
Model 1 Model 2 Model 3 Model 4 Model 5 Model 6
B p B p B p B p B p B p
Quality of Life (QOL)
Overall QOL 0.033 0.54
General health −0.007 0.89
Physicaldomain 0.023 0.61
Psychologicaldomain 0.030 0.51
Social relationshipdomain 0.085 0.053
Environmentdomain 0.066 0.13
Season of birth (SOB) (ref. Dry season) Rainy season −0.085 0.18 −0.067 0.27 −0.062 0.19 −0.027 0.58 −0.022 0.62 −0.015 0.74
QOL x SOB 0.095 0.18 0.073 0.29 0.084 0.17 0.024 0.69 0.017 0.77 0.006 0.92
Rice production [Yearly per capita gross production (kg)]
<0.001 0.38 <0.001 0.36 −0.001 0.27 <0.001 0.34 <0.001 0.39 <0.001 0.35
R-squared 0.107 0.102 0.107 0.102 0.109 0.105
The least-squares regression models were adjusted for age (a continuous variable in years), sex, body mass index (kg/m2), education level (less than 9 years; 9 years; and more than 9 years) and marital status (currently married; and not currently married). Models 1–6 include the following QOL scores, respectively: Overall QOL (Model 1), General health (Model 2),Physicaldomain (Model 3),Psychologicaldomain (Model 4),Social relationshipdomain (Model 5), andEnvironmentdomain (Model 6). Rice production is shown as yearly per capita gross production (kg).
doi:10.1371/journal.pone.0139602.t002
Table 3. The association between log-transformed CRP concentration and QOL scores, SOB and rice production among participants aged 20–32
years old in Hainan Island, China in 2010 (n = 378).
Model 1 Model 2 Model 3 Model 4 Model 5 Model 6
B p B p B p B p B p B p
Quality of Life (QOL)
Overall QOL 0.213 0.052
General health 0.147 0.15
Physicaldomain 0.071 0.38
Psychologicaldomain 0.036 0.69
Social relationshipdomain 0.087 0.28
Environmentdomain 0.200 0.013
Season of birth (SOB) (ref. Dry season) Rainy season
0.088 0.50 0.125 0.30 <0.001 0.99 −0.032 0.74 −0.038 0.62 0.072 0.37
QOL x SOB −0.164 0.25 −0.220 0.10 −0.099 0.36 −0.027 0.82 −0.019 0.86 −0.227 0.035
Rice production [Yearly per capita gross production (kg)]
<0.001 0.89 <0.001 0.99 <0.001 0.90 <0.001 0.93 <0.001 0.91 <0.001 0.86
R-squared 0.108 0.105 0.101 0.099 0.103 0.114
The least-squares regression models were adjusted for age (a continuous variable in years), sex, body mass index (kg/m2), education level (less than 9 years; 9 years; and more than 9 years) and marital status (currently married; and not currently married). Models 1–6 include the following QOL scores, respectively: Overall QOL (Model 1), General health (Model 2),Physicaldomain (Model 3),Psychologicaldomain (Model 4),Social relationshipdomain (Model 5), andEnvironmentdomain (Model 6). Rice production is shown as yearly per capita gross production (kg).
Table 4. The association between log-transformed CRP concentration and QOL scores, SOB and rice production among the participants aged 33–
47 years old in Hainan Island, China in 2010 (n = 477).
Model 1 Model 2 Model 3 Model 4 Model 5 Model 6
B p B p B p B p B p B p
Quality of Life (QOL)
Overall QOL 0.056 0.48
General health 0.059 0.44
Physicaldomain 0.163 0.018
Psychologicaldomain 0.069 0.31
Social relationshipdomain 0.086 0.19
Environmentdomain 0.076 0.25
Season of birth (SOB) (ref. Dry season) Rainy
season −
0.061 0.50 −0.059 0.50 0.043 0.55 0.040 0.57 <0.001 >0.99 0.016 0.81
QOL x SOB 0.116 0.26 0.114 0.26 −0.018 0.84 −0.025 0.78 0.039 0.66 0.015 0.86
Rice production [Yearly per capita gross production (kg)]
−0.003 0.049 −0.003 0.038 −0.003 0.021 −0.003 0.032 −0.003 0.045 −0.003 0.033
R-squared 0.128 0.129 0.136 0.118 0.127 0.123
The least-squares regression models were adjusted for age (a continuous variable in years), sex, body mass index (kg/m2), education level (less than 9 years; 9 years; and more than 9 years) and marital status (currently married; and not currently married). Models 1–6 include the following QOL scores, respectively: Overall QOL (Model 1), General health (Model 2),Physicaldomain (Model 3),Psychologicaldomain (Model 4),Social relationshipdomain (Model 5), andEnvironmentdomain (Model 6). Rice production is shown as yearly per capita gross production (kg).
doi:10.1371/journal.pone.0139602.t004
Table 5. The association between log-transformed CRP concentration and QOL scores, SOB and rice production among participants aged 48–57
years old in Hainan Island, China in 2010 (n = 230).
Model 1 Model 2 Model 3 Model 4 Model 5 Model 6
B p B p B p B p B p B p
Quality of Life (QOL)
Overall QOL −0.197 0.042
General health −0.417 <0.001
Physicaldomain −0.241 0.004
Psychologicaldomain −0.049 0.58
Social relationshipdomain 0.150 0.083
Environmentdomain −0.147 0.10
Season of birth (SOB) (ref. Dry season)
Rainy season −
0.249 0.027 −0.369 0.002 −0.266 0.002 −0.142 0.12 0.005 0.95 −0.204 0.023
QOL x SOB 0.331 0.011 0.465 0.001 0.464 <0.001 0.229 0.051
−0.014 0.90 0.358 0.003
Rice production [Yearly per capita gross production (kg)]
<0.001 0.64 0.001 0.47 0.001 0.56 <0.001 0.63 <0.001 0.62 0.001 0.53
R-squared 0.127 0.165 0.167 0.124 0.125 0.141
The least-squares regression models were adjusted for age (a continuous variable in years), sex, body mass index (kg/m2), education level (less than 9 years; 9 years; and more than 9 years) and marital status (currently married; and not currently married). Models 1–6 include the following QOL scores, respectively: Overall QOL (Model 1), General health (Model 2),Physicaldomain (Model 3),Psychologicaldomain (Model 4),Social relationshipdomain (Model 5), andEnvironmentdomain (Model 6). Rice production is shown as yearly per capita gross production (kg).
Fig 2. The association between season of birth (SOB), Quality of Life (QOL) and C-reactive protein (CRP) concentration.
was higher (i.e., they had a lower QOL inphysicalandenvironmentdomains) (Fig 2D and 2E). On the other hand, among the youngest age group, people who were born in the dry season had decreased CRP concentration when having lowerenvironmentdomain QOL (Fig 2A).
Discussion
Summary of findings
Analyses conducted separately by age group revealed that the inflammatory reaction (indexed as CRP concentration) to psychological stress (as indicated by a lower QOL score) in adulthood differed by SOB. Specifically, we showed that SOB modified the inflammatory response to psy-chological stress among people aged 48–57 years old (four QOL subscale scores) and people aged 20–32 years old (one QOL subscale score). Annual per capita rice production modified adult inflammatory reaction only among people aged 33–47 years old. These associations were masked when analyzing all ages combined.
Mechanisms linking SOB and CRP concentration in adulthood
Studies have suggested that two mechanisms might help explain the role of SOB in determining adult inflammatory response to psychological stress: microbial exposure in infancy and nutri-tional status in utero. For the former, research has highlighted the important role that seasonal-ity can have in relation to the spread of pathogens. This might be related in part, to seasonal differences in weather conditions. In particular, it seems that pathogens often become more widespread after heavy rain or flooding [26]. Moe et al. [27] and VanDerslice et al. [28] have both shown the important effect that rainfall has on the spread of pathogens in the Philippines. Other research has highlighted the role of temperature. Xu et al. [29] for example, examined the seasonal pattern of childhood diarrhea in Brisbane, Australia, and concluded that both low and high temperatures increased its incidence. Chen et al. [30] also demonstrated the seasonal-ity of common respiratory virus activities in a subtropical area in China when investigating the association between these viruses and temperature, humidity and rainfall. As pathogen expo-sure during early childhood has been linked to the development of anti-pathogen defenses in adulthood [31], this research suggests that differences in seasonal-mediated pathogen exposure might play a role in determining variations in the physiology of individuals.
Regarding in utero nutritional status, in a recent review study, Chodick et al. [32] showed that in several developing countries with a tropical / subtropical climate (e.g., Zaire, India and Taiwan), birth weight tends to be highest in the beginning of the dry season and lowest in the beginning of the rainy season. They interpreted this pattern as a result of maximal fetal growth in the third trimester during the harvesting season which is towards the end of the rainy season. As low birth weight has been associated with immature development of the immune system, which can lead to higher CRP in children and adults [10,33], the better nutritional status in utero of those who were born in the end of the rainy season might have resulted in a lower CRP concentration in adulthood.
When trying to understand the seasonal difference in the development of immune function (i.e., inflammatory response in adulthood) between McDade’s study and this study, it should be borne in mind that there are important differences between the study locations (i.e., Hainan and Cebu). First, in Hainan, the Lunar New Year is an important event. This is a period associ-ated with food-intensive celebrations lasting for two weeks during the period from the end of January to the beginning of February. In terms of our results, it can be speculated that during the time of the Great Leap Forward, the impact of such an occasion might have been especially large, particularly in contrast to the lack of food possibly consumed at other times in the year. Therefore, those who were born in the rainy season may have had a richer nutritional intake in utero. Sufficient nutritional intake in utero contributes to higher birth weight which, in turn, might result in lower CRP production in the presence of stressors [34]. This might explain why among those who were older, immune function was regulated for those born in the rainy sea-son even when stressed but why CRP concentration was higher for those born in the dry seasea-son when similarly stressed.
Second, the seasonal variation in temperature is larger in Hainan than in Cebu: the mean monthly maximum temperatures during the dry and rainy season are 22.8°C and 28.3°C in Hainan but 31.0°C and 31.4°C in Cebu, respectively [17,35]. Temperature change can stimulate the immune system [36]. It is possible therefore that Hainan’s larger temperature range between seasons might put those who are born in the early dry season at greater risk of devel-oping a phenotype with a higher immunological reaction to psychological stress, which again might help explain why those who were born in the dry season among the oldest age group had a higher CRP concentration when psychologically stressed.
Third, the duration of the dry season is longer in Hainan. In their study, McDade et al. [10] suggested that early infant experience may be critical for the development of the immune sys-tem and that compared to people who were born outside of the dry season, individuals who were born in the dry season, that lasts from February to April, might be at higher risk of early post-natal exposure to pathogens during the rainy season. However, as the duration of the dry season is longer in Hainan than in Cebu, those who were born in the early dry season may not experience the same risk of post-natal exposure to pathogens during the rainy season. This might have led to smaller differences in pathogen exposure between those who were born in the rainy season and the dry season in Hainan, compared to Cebu. If this supposition is correct, the SOB effect in terms of pathogen exposure and its subsequent effects might have differed between the two locations.
Change in the ecological determinants of immune development across
time
Rice production was significantly inversely associated with CRP concentration in all of the models among participants aged 33–47 years old, who were born during the period of the Cul-tural Revolution, although it was not associated with CRP concentration in any of the QOL domains among the other two age groups. It is possible that this difference might be related to the changing availability of rice and its importance in the Hainan diet across time. In particular, in contrast to the time of the Great Leap Forward where rice production was much lower and there was comparatively little inter-individual variation in its consumption, the years of the Cultural Revolution were marked by a greater production of rice and thus, greater potential for differences in consumption—especially in an environment marked by social instability and political persecution. Although rice production continued to expand in the latter half of the twentieth century, it is possible that its role in the Chinese diet became comparatively less important as lifestyles (and food consumption patterns) became increasingly diversified against a backdrop of economic growth [18,42,43]. If this is the case, it might explain why there was no ‘rice effect’observed for the youngest participants.
Study limitations
This study has several limitations. First, we did not have information on several covariates which were previously tested (e.g., socioeconomic status both at birth and at the time of sam-pling) [10]. This might have impacted on our ability to examine the effects of SOB on the inflammatory response to psychological stress later in life. Second, we used QOL to measure psychological stress status, while in McDade et al. [10] the Perceived Stress Scale [44] was used. These questionnaires may capture different aspects of psychological stress. However, a negative association between the WHOQOL-BREF scores (physicalandpsychologicaldomains) and Epstein-Barr virus antibody titer, which is a well-established biomarker for psychological stress status, has previously been observed in Hainan [45], therefore, it is probable that QOL scores adequately reflect psychological stress status in this location. Third, we used a single measure-ment of CRP concentration to assess baseline inflammation levels. However, previous studies [21] have also justified the use of single measurements of CRP concentration due to the lack of intra-individual variation. Moreover, omitting those with obvious signs of acute inflammation (i.e., serum-equivalent CRP concentrations of>10 mg/L) meant that we were able to evaluate
Conclusion
The findings from this study suggest that inflammatory response to psychological stress in adulthood may differ by season of birth among adults from different age groups in Hainan, China. In addition, population nutritional status (as indexed by per capita annual rice produc-tion) was negatively associated with bodily inflammation among the second oldest age group (i.e., 33–47 years). These results seem to accord with those from earlier studies which have shown that the early life environment plays a significant role in determining inflammatory response to psychological stress in adulthood. However, they also highlight the important find-ing that the ecological factors associated with population physiological development may differ markedly according to the specific context and time period in which people were born.
Supporting Information
S1 Dataset. The data used in the analyses. (CSV)
Acknowledgments
The authors extend their sincere thanks to all the participants in Hainan for their participation and friendly cooperation.
Author Contributions
Conceived and designed the experiments: AS CW. Performed the experiments: YI DL. Ana-lyzed the data: AY. Contributed reagents/materials/analysis tools: JD. Wrote the paper: AY YI AS.
References
1. Finch CE, Crimmins EM. Inflammatory exposure and historical changes in human life-spans. Science. 2004; 305(5691):1736–9. PMID:15375259
2. Nelson RJ, Demas GE. Seasonal changes in immune function. The Quarterly review of biology. 1996; 71(4):511–48. Epub 1996/12/01. PMID:8987173.
3. Strand LB, Barnett AG, Tong S. The influence of season and ambient temperature on birth outcomes: a review of the epidemiological literature. Environ Res. 2011; 111(3):451–62. doi:10.1016/j.envres.2011. 01.023PMID:21333980.
4. Curhan GC, Willett WC, Rimm EB, Spiegelman D, Ascherio AL, Stampfer MJ. Birth weight and adult hypertension, diabetes mellitus, and obesity in US men. Circulation. 1996; 94(12):3246–50. PMID: 8989136
5. Riala K, Hakko H, Taanila A, Rasanen P. Season of birth and smoking: findings from the Northern Fin-land 1966 Birth Cohort. Chronobiology international. 2009; 26(8):1660–72. Epub 2009/12/25. doi:10. 3109/07420520903534484PMID:20030548.
6. Wattie N, Ardern CI, Baker J. Season of birth and prevalence of overweight and obesity in Canada. Early human development. 2008; 84(8):539–47. doi:10.1016/j.earlhumdev.2007.12.010PMID: 18280062.
7. Schreier N, Moltchanova E, Forsen T, Kajantie E, Eriksson JG. Seasonality and ambient temperature at time of conception in term-born individuals—influences on cardiovascular disease and obesity in adult life. Int J Circumpolar Health. 2013; 72:21466. doi:10.3402/ijch.v72i0.21466PMID:24137570; PubMed Central PMCID: PMC3797918.
8. Abel EL, Kruger ML. Birth month affects longevity. Death Stud. 2010; 34(8):757–63. Epub 2010/09/01. PMID:24482849.
10. McDade TW, Hoke M, Borja JB, Adair LS, Kuzawa C. Do environments in infancy moderate the associ-ation between stress and inflammassoci-ation in adulthood? Initial evidence from a birth cohort in the Philip-pines. Brain Behav Immun. 2013; 31:23–30. PubMed Central PMCID: PMC3541465.
11. Ridker PM, Buring JE, Shih J, Matias M, Hennekens CH. Prospective study of C-reactive protein and the risk of future cardiovascular events among apparently healthy women. Circulation. 1998; 98 (8):731–3. Epub 1998/09/04. PMID:9727541.
12. Pradhan AD, Manson JE, Rifai N, Buring JE, Ridker PM. C-reactive protein, interleukin 6, and risk of developing type 2 diabetes mellitus. JAMA: the journal of the American Medical Association. 2001; 286 (3):327–34. PMID:11466099.
13. Blumenthal D, Hsiao W. Privatization and Its Discontents—The Evolving Chinese Health Care System. New Engl J Med. 2005; 353(11):1165–70. doi:10.1056/NEJMhpr051133PMID:16162889.
14. Bianco L, Jayaram N. Mao's great famine, the history of China's most devastating catastrophe, 1958– 62 [Book Review]. China Perspectives. 2011;( 2):74.
15. Shirk SL. The political logic of economic reform in China: Univ of California Press; 1993.
16. Hainan Provincial Office of Gazetters. A History of Hainan Province—Food History: Hainan Press; 2003.
17. World Weater Online. [Jan. 16, 2015]. Available from: http://www.worldweatheronline.com/Hainan-weather-averages/Hainan/CN.aspx.
18. Jiang HW, Umezaki M, Ohtsuka R. Inter-household variation in adoption of cash cropping and its effects on labor and dietary patterns: a study in a Li hamlet in Hainan island, China. Anthropol Sci. 2006; 114(2):165–73.
19. Umezaki M, Jiang H. Changing Adaptive Strategies of Two Li Ethnic Minority Villages in a Mountainous Region of Hainan Island, China. Southeast Asian Studies. 2009; 47(3):348–62.
20. World Health Organization. WHOQOL User Manual 1998 [Jan 16, 2015]. Available from:http://www. who.int/mental_health/evidence/who_qol_user_manual_98.pdf.
21. Brindle E, Fujita M, Shofer J, O'Connor KA. Serum, plasma, and dried blood spot high-sensitivity C-reactive protein enzyme immunoassay for population research. J Immunol Methods. 2010; 362(1– 2):112–20. doi:10.1016/j.jim.2010.09.014PMID:20850446; PubMed Central PMCID: PMC2964394.
22. Pearson TA, Mensah GA, Alexander RW, Anderson JL, Cannon RO 3rd, Criqui M, et al. Markers of inflammation and cardiovascular disease: application to clinical and public health practice: A statement for healthcare professionals from the Centers for Disease Control and Prevention and the American Heart Association. Circulation. 2003; 107(3):499–511. Epub 2003/01/29. PMID:12551878.
23. Blay SL, Marchesoni MSM. Association among physical, psychiatric and socioeconomic conditions and WHOQOL-Bref scores. Cad Saude Publica. 2011; 27(4):677–86. PMID:21603751
24. Skevington SM. Qualities of life, educational level and human development: an international investiga-tion of health. Soc Psych Psych Epid. 2010; 45(10):999–1009. doi:10.1007/s00127-009-0138-x WOS:000281741100008.
25. Chang Y, Yao G, Hu S, Wang J. Depression Affects the Scores of All Facets of the WHOQOL-BREF and May Mediate the Effects of Physical Disability among Community-Dwelling Older Adults. Plos One. 2014; 10(5):e0128356-e.
26. Curriero FC, Patz JA, Rose JB, Lele S. The association between extreme precipitation and waterborne disease outbreaks in the United States, 1948–1994. Am J Public Health. 2001; 91(8):1194–9. Epub 2001/08/14. PMID:11499103; PubMed Central PMCID: PMC1446745.
27. Moe CL, Sobsey MD, Samsa GP, Mesolo V. Bacterial indicators of risk of diarrhoeal disease from drink-ing-water in the Philippines. Bull World Health Organ. 1991; 69(3):305–17. Epub 1991/01/01. PMID: 1893505; PubMed Central PMCID: PMC2393099.
28. VanDerslice J, Popkin B, Briscoe J. Drinking-water quality, sanitation, and breast-feeding: their interac-tive effects on infant health. Bull World Health Organ. 1994; 72(4):589–601. Epub 1994/01/01. PMID: 7923538; PubMed Central PMCID: PMC2486614.
29. Xu Z, Liu Y, Ma Z, Toloo GS, Hu W, Tong S. Assessment of the temperature effect on childhood diar-rhea using satellite imagery. Scientific reports. 2014; 4.
30. Chen Z, Zhu Y, Wang Y, Zhou W, Yan Y, Zhu C, et al. Association of meteorological factors with child-hood viral acute respiratory infections in subtropical China: an analysis over 11 years. Arch Virol. 2014; 159(4):631–9. doi:10.1007/s00705-013-1863-8PMID:24114148.
32. Chodick G, Flash S, Deoitch Y, Shalev V. Seasonality in birth weight: review of global patterns and potential causes. Hum Biol. 2009; 81(4):463–77. Epub 2010/01/14. doi:10.3378/027.081.0405PMID: 20067370.
33. Jousilahti P, Salomaa V, Rasi V, Vahtera E, Palosuo T. Association of markers of systemic inflamma-tion, C reactive protein, serum amyloid A, and fibrinogen, with socioeconomic status. J Epidemiol Com-munity Health. 2003; 57(9):730–3. Epub 2003/08/23. PMID:12933781; PubMed Central PMCID: PMC1732590.
34. Sattar N, McConnachie A, O'Reilly D, Upton MN, Greer IA, Davey Smith G, et al. Inverse association between birth weight and C-reactive protein concentrations in the MIDSPAN Family Study. Arterioscle-rosis, thrombosis, and vascular biology. 2004; 24(3):583–7. Epub 2004/01/24. doi:10.1161/01.atv. 0000118277.41584.63PMID:14739124.
35. World Weater Online. [Feb. 14, 2015]. Available from: http://www.worldweatheronline.com/Cebu-weather-averages/Cebu-City/PH.aspx.
36. Xirasagar S, Lin HC, Liu TC. Seasonality in pediatric asthma admissions: the role of climate and envi-ronmental factors. Eur J Pediatr. 2006; 165(11):747–52. Epub 2006/05/24. doi: 10.1007/s00431-006-0164-6PMID:16718474.
37. Thompson AL, Houck KM, Adair L, Gordon-Larsen P, Du S, Zhang B, et al. Pathogenic and obesogenic factors associated with inflammation in Chinese children, adolescents and adults. Am J Hum Biol. 2014; 26(1):18–28. doi:10.1002/ajhb.22462PMID:24123588; PubMed Central PMCID: PMC3932143.
38. Esmaillzadeh A, Kimiagar M, Mehrabi Y, Azadbakht L, Hu FB, Willett WC. Dietary patterns and markers of systemic inflammation among Iranian women. J Nutr. 2007; 137(4):992–8. WOS:000245230700023. PMID:17374666
39. Malik VS, Popkin BM, Bray GA, Després J-P, Hu FB. Sugar-sweetened beverages, obesity, type 2 dia-betes mellitus, and cardiovascular disease risk. Circulation. 2010; 121(11):1356–64. doi:10.1161/ CIRCULATIONAHA.109.876185PMID:20308626
40. Villegas R, Xiang YB, Cai H, Elasy T, Cai Q, Zhang X, et al. Lifestyle determinants of C-reactive protein in middle-aged, urban Chinese men. Nutr Metab Cardiovas. 2012; 22(3):223–30. doi:10.1016/j. numecd.2010.07.007WOS:000301288800009.
41. Geffken DF, Cushman M, Burke GL, Polak JF, Sakkinen PA, Tracy RP. Association between physical activity and markers of inflammation in a healthy elderly population. Am J Epidemiol. 2001; 153(3):242– 50. doi:10.1093/aje/153.3.242WOS:000166718300007. PMID:11157411
42. Inoue Y, Umezaki M, Watanabe C. Emergence of income inequality and its impact on subjective quality of life in an ethnic minority community in Hainan Island, China. Anthropol Sci. 2012; 120(1):51–60. doi: 10.1537/Ase.110523WOS:000305305500006.
43. Yazawa A, Inoue Y, Li D, Du J, Jin Y, Chen Y, et al. Impact of lifestyle changes on stress in a moderniz-ing rural population in Hainan Island, China. Am J Hum Biol. 2014; 26(1):36–42. doi:10.1002/ajhb. 22467PMID:24142479.
44. Cohen S, Kamarck T, Mermelstein R. A global measure of perceived stress. J Health Soc Behav. 1983; 24(4):385–96. Epub 1983/12/01. PMID:6668417.
45. Inoue Y, Yazawa A, Li D, Du J, Jin Y, Chen Y, et al. Epstein-Barr virus antibody titer and its association with the domain scores from the World Health Organization's Quality of Life questionnaire: Findings from Rural Hainan Province, China. Am J Hum Biol. 2014; 26(1):51–5. Epub 2013/12/12. doi:10.1002/ ajhb.22478PMID:24327424.
46. Fewell Z, Davey Smith G, Sterne JA. The impact of residual and unmeasured confounding in epidemio-logic studies: a simulation study. Am J Epidemiol. 2007; 166(6):646–55. Epub 2007/07/07. doi:10. 1093/aje/kwm165PMID:17615092.