Its Effect on Renal Phosphate Handling and Vitamin D
Metabolism
Hirokazu Sakan1, Kimihiko Nakatani1,2*, Osamu Asai1, Akihiro Imura3, Tomohiro Tanaka3,
Shuhei Yoshimoto1, Noriyuki Iwamoto4, Norio Kurumatani5, Masayuki Iwano1,6, Yo-ichi Nabeshima3, Noboru Konishi2, Yoshihiko Saito1,7
1First Department of Internal Medicine, Nara Medical University, Kashihara, Nara, Japan,2Department of Pathology, Nara Medical University, Kashihara, Nara, Japan,
3Department of Pathology and Tumor Biology, Kyoto University Graduate School of Medicine, Kyoto, Japan,4Department of Urology, Tojinkai Hospital, Kyoto, Japan,
5Departments of Community Health and Epidemiology, Nara Medical University, Kashihara, Nara, Japan,6Division of Nephrology, Department of General Medicine, Faculty of Medical Sciences, University of Fukui, Yoshida-gun, Fukui, Japan,7Department of Regulatory Medicine for Blood Pressure, Nara Medical University, Kashihara, Nara, Japan
Abstract
Renala-Klotho (a-KL) plays a fundamental role as a co-receptor for fibroblast growth factor 23 (FGF23), a phosphaturic hormone and regulator of 1,25(OH)2vitamin D3(1,25VitD3). Disruption of FGF23-a-KL signaling is thought to be an early hallmark of chronic kidney disease (CKD) involving reduced renala-KL expression and a reciprocal rise in serum FGF23. It remains unclear, however, whether the rise in FGF23 is related to the loss of renala-KL. We evaluateda-KL expression in renal biopsy samples and measured levels of several parameters of mineral metabolism, as well as solublea-KL (sKL), in serum and urinary samples from CKD patients (n = 236). We found that although renala-KL levels were significantly reduced and serum FGF23 levels were significantly elevated in early and intermediate CKD, serum phosphate levels remained within the normal range. Multiple regression analysis showed that the increases in FGF23 were significantly associated with reduced renal function and elevated serum phosphate, but were not associated with loss of renala-KL. Moreover, despite falling renal a-KL levels, the increase in FGF23 enhanced urinary fractional excretion of phosphate and reduced serum 1,25VitD3levels in early and intermediate CKD, though not in advanced CKD. Serum sKL levels also fell significantly over the course of CKD, and renala-KL was a significant independent determinant of sKL. These results demonstrate that FGF23 levels rise to compensate for renal failure-related phosphate retention in early and intermediate CKD. This enables FGF23-a -KL signaling and a neutral phosphate balance to be maintained despite the reduction ina-KL. In advanced CKD, however, renala-KL declines further. This disrupts FGF23 signaling, and serum phosphate levels significantly increase, stimulating greater FGF23 secretion. Our results also suggest the serum sKL concentration may be a useful marker of renal a-KL expression levels.
Citation:Sakan H, Nakatani K, Asai O, Imura A, Tanaka T, et al. (2014) Reduced Renala-Klotho Expression in CKD Patients and Its Effect on Renal Phosphate Handling and Vitamin D Metabolism. PLoS ONE 9(1): e86301. doi:10.1371/journal.pone.0086301
Editor:Christos Chatziantoniou, Institut National de la Sante´ et de la Recherche Me´dicale, France
ReceivedJune 21, 2013;AcceptedDecember 6, 2013;PublishedJanuary 23, 2014
Copyright:ß2014 Sakan et al. This is an open-access article distributed under the terms of the Creative Commons Attribution License, which permits unrestricted use, distribution, and reproduction in any medium, provided the original author and source are credited.
Funding:This work was supported in part by a research grant from the Ministry of Education and Science of Japan, by a grant from The Kidney Foundation of Japan (JKFB12-42), and by a Grant-in-Aid for Progressive Renal Diseases Research, Research on Intractable Disease, and Diabetic Nephropathy and Nephrosclerosis Research from the Ministry of Health, Labour and Welfare of Japan. The funders had no role in study design, data collection and analysis, decision to publish, or preparation of the manuscript.
Competing Interests:The authors have declared that no competing interests exist. * E-mail: [email protected]
Introduction
a-Klotho (a-KL) is a single-pass transmembrane protein [1,2] expressed in multiple tissues, but present at particularly high levels in the kidney. It was originally described as a senescence-related protein because mice lacking functional a-KL protein develop a syndrome resembling human aging [1]. Recently, however,a-KL was shown to act as a co-receptor that forms a complex with fibroblast growth factor receptor 1 (FGFR1) to mediate signaling by the circulating hormone fibroblast growth factor 23 (FGF23), which is an important regulator of mineral metabolism [3,4]. Within the kidney, FGF23 activity leads to phosphaturia and down-regulation of renal 1,25-dihydroxy vitamin D3 (1,25VitD3) production [5,6]. The importance ofa-KL for FGF23 signaling in
the kidney is apparent inKlotho- andFg23-null mice, which share nearly identical biochemical phenotypes that are consistent with the dismantling of FGF23 signaling, including hyperphosphatemia and elevated 1,25VitD3[1,7].
resultanta-KL deficiency could make the kidney resistant to the action of FGF23. To date, however, there have been no studies characterizing the relation between serum FGF23 levels and renal a-KL levels in CKD patients
In addition to the membrane-anchored form ofa-KL, a soluble form produced through alternative splicing of thea-KL transcript [15,16] or ectodomain shedding catalyzed by desintegrin and metalloproteinase [17,18] was recently detected in cerebrospinal fluid, blood, and urine [19]. Solublea-KL (sKL) is a pleiotropic protein functioning as an endocrine factor with multiple renal and extrarenal effects. Previous studies have suggested that circulating sKL may represent a useful biomarker for diagnosis of CKD [10]. However, the relation between circulating sKL and renala-KL in CKD patients has not yet been characterized.
The purpose of the present study was to determine whether renala-KL levels modulate serum levels of FGF23 and sKL, and to assess the potential role of renala-KL in the mineral and bone disorders seen in CKD patients. To that end, we analyzed the association between renala-KL expression and several parameters of mineral metabolism, including FGF23 and sKL levels in serum collected from CKD patients, who also provided renal biopsy samples. In addition, we examined the effects ofa-KL deficiency on FGF23 signaling in cultured human embryonic kidney 293 (HEK293) cells.
Materials and Methods
Study population
This study evaluated 236 patients who had undergone renal biopsy for CKD. Measured in all patients were serum levels of total protein, albumin, creatinine, calcium and inorganic phos-phate (Pi), as well as urinary levels of creatinine and Pi. eGFR was calculated using the creatinine-based Modification of Diet in Renal Disease Study equation [20]. Urinary fractional excretion of phosphate (FEPi) was calculated using the formula: FEPi = (urine phosphate6serum creatinine)/(serum phosphate6urine creati-nine)6100. Serum 1,25VitD3 levels were measured using a radioimmunoassay, and serum intact parathyroid hormone (PTH) levels were measured using an electrochemiluminescence immunoassay (SRL, Tokyo, Japan). Serum FGF23 and sKL concentrations were measured using enzyme-linked immunosor-bent assay (ELISA) kits, as described previously [21]. Levels of renal a-KL expression were evaluated using the renal biopsy samples. The patient characteristics are listed in Table 1. Included in this study were 14 pre-hemodialysis (HD) patients with stage 5 CKD and 43 patients undergoing maintenance HD. Serum samples were collected from the HD patients before HD. All clinical study protocols were approved by the Nara Medical University Ethics Committee (No. 2002-2009). Written informed consent was obtained in all cases, either from the patient or his/ her family.
Immunohistochemical studies
a-KL was immunohistochemically labeled in sections from human renal biopsies and samples of parathyroid gland using KM2076 antibody [22] (1:50 dilution; a kind gift from Kyowa Hakko Kirin). The labeled protein was visualized using a Dako Envison Kit (Dako, Glostrup, Denmark).
Recombinant human FGF23
Recombinant human FGF23 harboring two mutations (R176Q and R179Q) found in patients with autosomal dominant hypophosphatemic rickets was used for these studies [23]. A pcDNA3.1 expression vector containing cDNA encoding the
FGF23 mutant with a C-terminal His tag was stably expressed in CHO-1 cells and then purified from the conditioned medium using HisTrapTM HP column chromatography (GE Healthcare Japan Corporation, Tokyo, Japan).
Cell transfection and treatment with FGF23
HEK293 cells plated in 6-well plates were cultured in Dulbecco’s modified Eagle’s medium containing 10% fetal bovine serum and infected with adeno-a-KL or adeno-Lac Z control vector, as described previously [24]. Two days after transfection, the cells were treated for 30 min with FGF23 (50 ng/ml, 200 ng/ml).
RNA Extraction, Reverse Transcription and Real-Time RT-PCR
Total cellular RNA was extracted from frozen human renal biopsy specimens or HEK293 cells, after which first-strand cDNA was generated as previously described [25,26]. For real-time polymerase chain reaction (PCR), 1mL of each first-strand
reaction product was amplified using appropriate primers and the corresponding fluorescent probes for human and murinea-KL (assay IDs: Hs00183100_m1, Mm00502002_m1), human early growth-responsive 1 (Egr-1) (assay ID: Hs 00152928_m1) and human b-actin (assay ID: Hs 00242273_m1). The probes were designed by the Applied Biosystems ‘‘Assay-on-Demand’’ service (Forster City, CA). Humana-KL/b-actin mRNA and Egr-1/b -actin mRNA ratios were calculated for each sample.
Western blotting
Lysates were prepared from HEK293 cells in lysis buffer, after which western blot analysis was performed as described previously [22] using monoclonal rat anti-a-KL antibody (KM2076)27 (1:500 dilution).
Statistical analysis
Statistical analyses were performed using Stat View 5.0 software. Numerical results are expressed as means 6 S.D. Student’st-test was used for normally distributed variables with two unpaired groups. To compare groups, we used a one-way analysis of variance followed by a post-hoc t-test with Fisher’s Protected Least Significant Difference adjustment. For variables with a skewed distribution, we used Tukey’s Honestly Significant
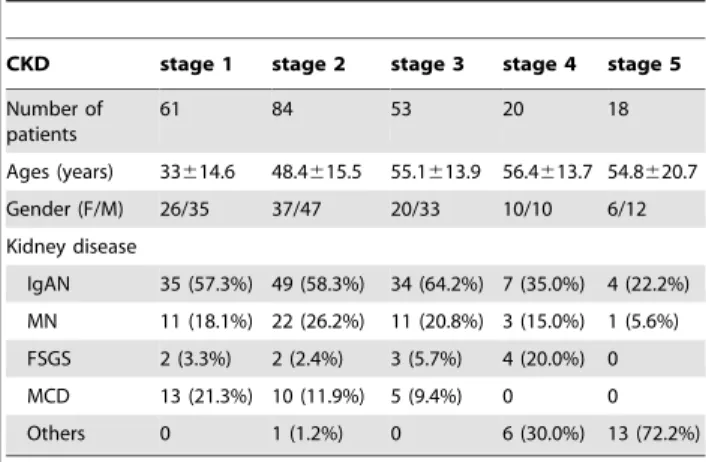
Table 1.Clinical characteristics of the study population.
CKD stage 1 stage 2 stage 3 stage 4 stage 5
Number of patients
61 84 53 20 18
Ages (years) 33614.6 48.4615.5 55.1613.9 56.4613.7 54.8620.7
Gender (F/M) 26/35 37/47 20/33 10/10 6/12
Kidney disease
IgAN 35 (57.3%) 49 (58.3%) 34 (64.2%) 7 (35.0%) 4 (22.2%)
MN 11 (18.1%) 22 (26.2%) 11 (20.8%) 3 (15.0%) 1 (5.6%)
FSGS 2 (3.3%) 2 (2.4%) 3 (5.7%) 4 (20.0%) 0
MCD 13 (21.3%) 10 (11.9%) 5 (9.4%) 0 0
Others 0 1 (1.2%) 0 6 (30.0%) 13 (72.2%)
Abbreviations: CKD, chronic kidney disease; IgAN, IgA nephropathy; MN, membranous glomerulonephritis;
FSGS, focal segmental glomerulosclerosis; MCD, minimal change disease. Clinical parameters are presented as means6S.D.
Difference (HSD) post hoc test with Bonferroni’s adjustment. Pearson’s correlation coefficient was used to assess the relation-ships between renal a-KL mRNA levels and clinical mineral metabolism parameters and sKL levels. Multiple regression analyses were performed to assess the influence of eGFR, PTH, FGF23, 1,25VitD3, corrected calcium, Pi and age on renala-KL levels; eGFR, renala-KL, PTH and Pi on serum FGF23 levels; eGFR, FGF23, PTH and Pi on FEPi; eGFR, FGF23, PTH and corrected calcium on serum 1,25VitD3 levels; and renal a-KL, eGFR, PTH, FGF23, 1,25VitD3, corrected calcium, Pi and age on sKL levels. The null hypothesis was rejected when the P value was less than 0.05.
Results
Reductions in renala-KL correspond to progression of CKD
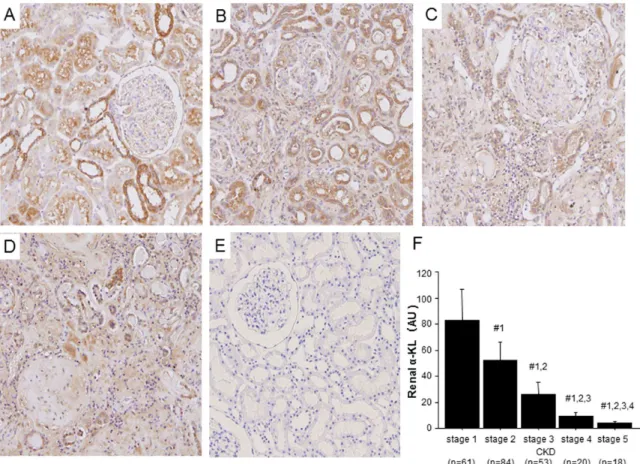
a-KL was detected immunohistologically in the kidneys of stage 1 CKD patients, mainly in the distal convoluted tubules (Figure 1A), but a-KL reactivity fell significantly as CKD progressed (Figure 1B–D). Correspondingly, renala-KL mRNA levels, quantified using real-time PCR, also declined significantly with the progression of renal dysfunction in CKD (Figure 1F).
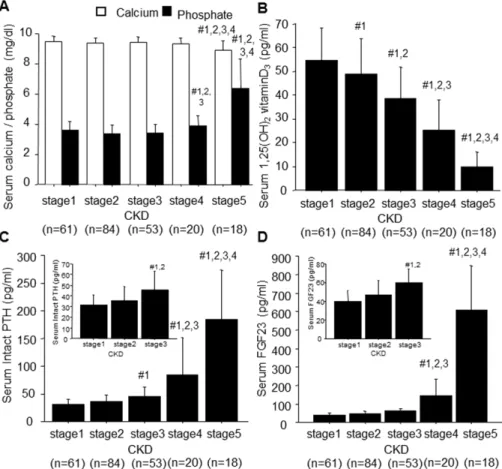
During the progression of CKD, the decline in renal a-KL levels was followed by reductions in 1,25VitD3 and increases in serum FGF23 and intact PTH, which became significant in stage 3
CKD (Figure 2B–D). On the other hand, serum Pi levels remained within the normal range until stage 4, and serum calcium levels remained within the normal range until stage 5 (Figure 2A).
Examination of several clinical mineral metabolism parameters showed significant correlations between the renal levels a-KL mRNA and serum levels of calcium (r = 0.198, P = 0.0022), Pi (r =20.283, P,0.0001), 1,25VitD3(r = 0.549, P,0.0001), FGF23 (r =20.461, P,0.0001) and intact PTH (r =20.469, P,0.0001) across all patients (Figure S1A–E). There was also a significant correlation between renala-KL expression and eGFR (r = 0.889, P,0.001) (Figure S1F). Multiple regression analysis revealed renal a-KL levels to significantly and positively correlate with only eGFR (b= 0.928, P,0.001) as an independent contributing factor across all patients (R2= 0.792, P,0.0001) (Table 2).
Association between serum FGF23 and urinary fractional excretion ratio of phosphate (FEPi) and serum 1,25VitD3 in CKD patients
We next studied whether, as CKD progresses, the kidney becomes increasingly resistant to FGF23-induced urinary phos-phate excretion and 1,25VitD3 production is suppressed, and whether there is a related loss of renala-KL. We analyzed the associations between serum FGF23 and FEPi and serum 1,25VitD3in CKD patients at all stages of the disease. Univariate analysis showed that there is a significant positive correlation between serum FGF23 levels and FEPi in CKD patients at stages 1
Figure 1. Reduction of renal a-Klotho (a-KL) expression with progression of CKD. (A–D) Representative images showing immunoperoxidase staining ofa-KL in renal biopsy sections from CKD patients at (A) stage 1, (B) stage 3, (C) stage 5 and (D) stage 5 HD. (E) Negative control (stage 1 CKD patient treated with rat immunoglobulin instead of rat anti-a-KL antibody). Original magnification, 1006. (F) Renala-KL mRNA levels. Tukey’s Honestly Significant Difference (HSD) post hoc test with Bonferroni’s adjustment was used to compare groups:#1,P,0.005 vs. stage 1;#2,P,0.005 vs. stage 2;#3,P,0.005 vs. stage 3;#4,P,0.005 vs. stage 4.
(r = 0.611, P,0.0001), 2 (r = 0.711, P,0.0001) and 3 (r = 0.613, P,0.0001), but not at stages 4–5 (r = 0.319, P = 0.0504) (Figure 3A–D). Then to further explore the influence of FGF23 on FEPi in early CKD, we performed a multiple regression analysis of FEPi using eGFR and serum FGF23, intact PTH and
Pi levels as explanatory factors across CKD patients at stages 1, 2 and 3. FEPi was significantly and positively correlated with FGF23 (b= 0.401, P,0.0001) and inversely correlated with eGFR (b=20.679, P,0.0001) as independent contributing factors (R2= 0.830, P,0.0001) (Table S1).
On the other hand, univariate analyses showed that serum FGF23 levels significantly and inversely correlate with serum 1,25VitD3 levels in CKD patients at stages 1 (r =20.542, P,0.0001), 2 (r =20.533, P,0.0001), 3(r =20.344, P = 0.0112) and 4–5 (r =20.525, P = 0.0006) (Fig. 4A–D). In addition, when we focused on patients with stage 1, 2 or 3 CKD, we found that the association between serum FGF23 and 1,25VitD3 gradually weakened with disease progression. Multiple regression analysis of 1,25VitD3 using eGFR and serum FGF23, intact PTH and calcium as explanatory factors across CKD patients at stages 1, 2 and 3 revealed 1,25VitD3levels to be significantly and inversely correlated with FGF23 (b=20.493, P,0.0001) and positively correlated with eGFR (b= 0.213, P = 0.0028) as independent contributing factors (R2= 0.310, P,0.0001) (Table S2). These results indicate that FGF23 can induce both elevations in FEPi and reductions in serum 1,25VitD3in early CKD patients, despite a gradual decline in renala-KL levels.
Association between serum FGF23 with renala-KL in CKD patients
To determine whether the reduction in renala-KL is a primary factor contributing to the increase in FGF23 secretion seen in early Figure 2. Clinical mineral metabolism parameters in patients with CKD.(A) Serum corrected calcium concentrations (white bars) and inorganic phosphate concentrations (black bars). (B) Serum 1,25VitD3 concentrations. (C) Serum intact PTH concentrations. (D) Serum FGF23 concentrations. Data are shown as means6S.D. Tukey’s Honestly Significant Difference (HSD) post hoc test with Bonferroni’s adjustment was used to compare groups:#1,P,0.005 vs. stage 1;#2,P,0.005 vs. stage 2;#3,P,0.005 vs. stage 3;#4,P,0.005 vs. stage 4.
doi:10.1371/journal.pone.0086301.g002
Table 2.Multiple regression analysisAof renala-KL in CKD patients.
Independent variables bB Pvalue
1,25(OH)2vitamin D3 20.014 0.7503
Intact PTH 0.024 0.6313
FGF23 0.045 0.4908
Serum corrscted calcium 0.002 0.9496
Serum inorganic phosphate 20.002 0.9715
Age 20.015 0.6822
eGFRa 0.928
,0.0001
AAdjusted coefficient of determination (R2); R2= 0.792 ,P
,0.0001. BStandard partial regression coefficient.
Abbreviations:a-KL,a-klotho; PTH, parathyroid hormone; FGF23, fibroblast growth factor 23;
eGFR, estimated glomerular filtration rate.
aeGFR was calculated using the creatinine-based Modification of Diet in Renal
Disease Study Equation.
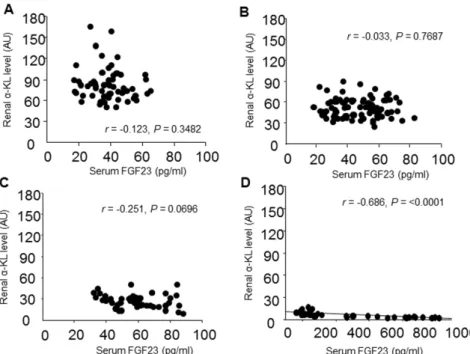
CKD patients, we assessed the association between serum FGF23 and renala-KL levels. Univariate analysis showed that there is not a significant correlation between serum FGF23 and renal a-KL levels in CKD patients at stage 1 (r =20.123, P = 0.3482), 2
(r =20.033, P = 0.7687) or 3 (r =20.251, P = 0.0696), but there is a significant inverse correlation at stages 4–5 (r =20.686, P,0.0001) (Figure 5A–D). Then to examine the affects of increasing serum FGF23 levels in early CKD, multiple regression Figure 3. Correlations between serum FGF23 and urinary fractional excretion of phosphate (FEPi) in CKD patients.(A–D) Serum FGF23 concentration plotted against FEPi in CKD patients at stage 1 (A), 2 (B), 3 (C) and 4–5 (D). Correlations were evaluated using Pearson’s correlation coefficient.
doi:10.1371/journal.pone.0086301.g003
analysis of FGF23 was performed using eGFR, renala-KL, serum intact PTH and Pi as explanatory factors across early CKD patients (stages 1–3). In these patients, serum FGF23 levels correlated significantly and inversely with eGFR (b=20.382, P = 0.0013) and correlated positively with Pi levels (b= 0.168, P = 0.0085) as independent contributing factors (R2= 0.256, P,0.0001) (Table 3). Similarly, in advanced CKD patients (stages 4–5), multiple regression analysis showed serum FGF23 levels to correlate significantly and inversely with eGFR (b=20.574, P = 0.0156) and to correlate positively with Pi levels (b= 0.381, P = 0.0051) as independent contributing factors (R2= 0.813, P,0.0001), but not with renal a-KL levels (Table 4). These results suggest that loss of renal a-KL is not a primary factor enhancing FGF23 secretion in CKD patients.
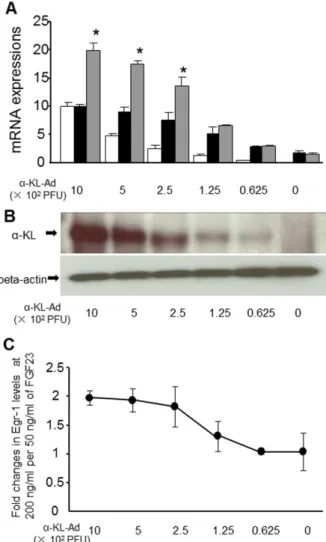
The effect ofa-KLexpression on FGF23-induced up-regulation ofEgr-1expression in HEK293 cells
To further clarify whether a gradual decline in renala-KL leads to resistance to FGF23 signaling, we transfected HEK293 cells with different amounts of adenoviral vector encodinga-KL, and then analyzed FGF23-induced Egr-1 expression in the transfec-tants. FGF23 reportedly up-regulates Egr-1 gene expression in cultured cells expressinga-KLat different levels [3]. We found that
FGF23-inducedEgr-1expression gradually declined in proportion toa-KLexpression (Figure 6A, B). In addition, when we increased
FGF23 by about 46in HEK293 cells transfected witha-KL,Egr-1
expression increased about 26, but the increase in Egr-1 expression was dramatically and dose-dependently attenuated when a-KL expression was reduced by approximately 80%
(Figure 6C). We also found that Egr-1 expression did not significantly increase in HEK293 cells in the absence of a-KL, even when FGF23 was increased (Figure 6A, B). In this experiment, HEK293 cells transfected with Lac Z gene served as the control.
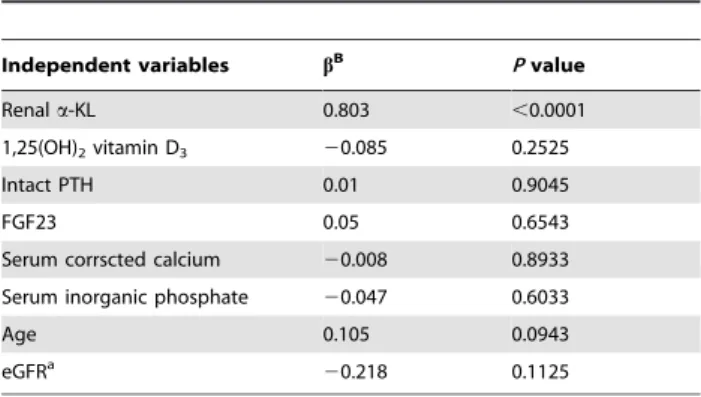
Association between serum sKL and renala-KL in CKD patients
To determine whether the gradually developing renal a-KL deficiency affects serum sKL levels in CKD patients, we assessed the association between serum sKL and renala-KL levels. We found that serum sKL declined significantly with falling renala -KL in CKD patients (r = 0.594, P,0.0001) (Figure 7A). Moreover, multiple regression analysis of sKL using age, eGFR, renala-KL, FGF23, intact PTH, 1,25VitD3, calcium and Pi levels as explanatory factors showed that serum sKL levels significantly correlate with renala-KL (b= 0.803, P,0.001) as an independent contributing factor (R2= 0.382, P,0.0001) across all CKD patients (Table 5). In addition, when we analyzed sKL levels in patients on maintenance HD, who expressed very little renala-KL (Figure 1D), we found their serum sKL levels to be significantly lower than in pre-HD patients with stage 5 CKD (HD,
Figure 5. Correlation between serum FGF23 and renala-Klotho (a-KL) in CKD patients.(A–D) Serum FGF23 concentration plotted against renala-KL level in CKD patients at stage 1 (A), 2 (B), 3 (C) and 4–5 (D). Correlations were evaluated using Pearson’s correlation coefficient. doi:10.1371/journal.pone.0086301.g005
Table 3.Multiple regression analysisAof serum FGF23 levels in early CKD patients (stages 1–3).
Independent
variables bB Pvalue
Intact PTH 0.103 0.1382
eGFRa
20.382 0.0013
Serum Pi 0.168 0.0085
Renala-KL 20.083 0.4582
A
Adjusted coefficient of determination (R2); R2= 0.256 ,P,0.0001. BStandard partial regression coefficient.
Abbreviations:a-KL,a-klotho; PTH, parathyroid hormone; eGFR, estimated glomerular filtration rate,
FGF23, fibroblast growth factor 23; Pi, inorganic phosphate.
aeGFR was calculated using the creatinine-based Modification of Diet in Renal
Disease Study Equation.
383.16179.9 pg/ml; pre-HD, 495.66181.9 pg/ml, P,0.05) (Figure 7B). These results suggest sKL levels could be a useful marker of renala-KL levels.
Discussion
Our findings in the present study show that renal a-KL expression declines with declining eGFR and that it correlates significantly with mineral metabolite levels. This suggests mineral metabolism disorders are associated with renala-KL deficiency in CKD. In addition, multiple regression analysis clearly showed that renal dysfunction is the most important factor contributing to the reduction in renala-KL expression in CKD patients. On the other hand, we also found that FGF23 begins to increase early during the progression of CKD, and that FGF23 levels were high when renala-KL expression was low. We therefore speculate that within the kidneys of CKD patients, thea-KL deficiency leads to FGF23 resistance, which drives compensatory increases in FGF23 secretion. Consistent with that idea, a-KL+/2 mice showed significantly higher plasma FGF23 levels thana-KL+/+mice [3]. Unexpectedly, when we focused on early CKD patients (stages 1, 2 and 3), univariate analysis indicated that serum FGF23 levels did not correlate significantly with renal a-KL levels, and multiple regression analysis clearly showed that eGFR and serum Pi were significant independent determinants of serum FGF23 levels, but renala-KL was not. In short, the increase in FGF23 seen in early CKD is probably induced by phosphate hoarding due to impaired urinary phosphorus excretion related to nephron loss, not to FGF23 resistance related toa-KL deficiency.
We then investigated the effect of renal a-KL deficiency on FGF23-induced phosphaturia and suppression of renal 1,25VitD3 production. We confirmed that FGF23 was a significant determi-nate reducing serum 1,25VitD3levels and enhancing FEPi in early CKD patients, even though renal a-KL was falling. This is consistent with a scenario in which an increase in FGF23 can mitigate phosphate retention and suppress 1,25VitD3production, thereby normalizing serum Pi levels in early CKD. In addition, the suppression of 1,25VitD3would lead to a secondary increase in PTH. Thus early CKD patients do not exhibit FGF23 resistance, despite a fall in renala-KL levels.
When we focused on advanced CKD patients (stages 4–5), multiple regression analysis showed that FGF23 was not a significant independent determinant of FEPi or serum 1,25VitD3. Indeed, FEPi was not significantly affected by increases in serum FGF23, which led to higher serum Pi levels. We therefore
speculate that resistance of the remaining functional nephrons to FGF23, induced by the decline in a-KL expression, may contribute to a reduction in urinary phosphate excretion. Notably, when we focused on patients with serum FGF23 levels greater than 500 pg/ml (n = 12), we found that FEPi values plateaued or declined slightly, despite marked increases in serum FGF23 (Figure 3D). This suggests the observed increases in FGF23 cannot sufficiently suppress the reabsorption of urinary phosphate by the remaining functional nephrons. Moreover, we found that there was a significant association between FEPi and renala-KL (r = 0.614, P = 0.0319), but not eGFR (r = 0.238, P = 0.4664). Indeed, we found that in advanced CKD patients, renal a-KL levels fell significantly to about 20% of the levels seen in stage 1 CKD patients. This suggests that with an approximately 80% reduction in a-KL, renal FGF23 resistance may develop. Consistent with that idea, when a-KL expression was reduced by approximately 80% in HEK293 cells, we detected a marked
Table 4.Multiple regression analysisAof serum FGF23 levels in advanced CKD patients (stages 4–5).
Independent
variables bB Pvalue
Intact PTH 0.061 0.5424
eGFRa
20.574 0.0156
Serum Pi 0.381 0.0051
Renala-KL 0.044 0.8012
A
Adjusted coefficient of determination (R2); R2= 0.813,P,0.0001. BStandard partial regression coefficient.
Abbreviations:a-KL,a-klotho; PTH, parathyroid hormone; eGFR, estimated glomerular filtration rate,
FGF23, fibroblast growth factor 23; Pi, inorganic phosphate.
aeGFR was calculated using the creatinine-based Modification of Diet in Renal
Disease Study Equation.
doi:10.1371/journal.pone.0086301.t004
Figure 6. Effect of a-KL expression on FGF23-induced up-regulation ofEgr-1expression in HEK293 cells.HEK293 cells were transfected with the indicated dose of adenovirus carrying thea-KL(a -KL-Ad) orLac Zgene (control). (A) Expression of Egr-1 (black and gray bars) anda-KL (white bars) mRNA. The transfectant cells were incubated for 30 min with FGF23 at 50 ng/ml (black bars) or 200 ng/ml (gray bars). (B) Western blotting ofa-KL. (C) Fold changes in Egr-1 mRNA levels induced by FGF23 at 200 ng/ml, as compared to 50 ng/ml. Data are shown as means6S.D. Student’s t-test was used to compare groups. *P,0.05 vs. HEK293 cells co-cultured with 50 ng/ml FGF23.
threshold effect on FGF23, leading to significant attenuation in FGF23-induced Egr-1 expression. In other words, when CKD advances to a point where renal a-KL levels are insufficient to support FGF23 signaling, FGF23-mediated increases in FEPi are impaired with resultant increases in serum Pi. Moreover, multiple regression analysis showed serum Pi to be a significant indepen-dent determinant of FGF23 levels in patients with advanced CKD. sKL is thought to be produced through alternative splicing of thea-KL transcript or through release of the extracellular domain of membrane-anchored a-KL [15,16,17,18]. RT-PCR analyses have shown thata-KL is expressed in a variety of tissues, but the highest expression is in the kidney [1,27]. We therefore predicted that serum sKL levels would gradually decline in proportion to renala-KL expression as CKD progressed. As expected, multiple regression analysis clearly showed renal a-KL to be the most important factor contributing to the reduction in serum sKL levels in CKD patients. In addition, serum sKL was significantly diminished in HD patients, whose kidneys express much lessa -KL than stage 5 CKD patients. These results indicate that the serum sKL level could be a useful biomarker of renal a-KL expression.
In summary, we found that renal dysfunction initially induces a reduction in renal a-KL expression, which in turn reduces circulating sKL levels. This suggests the serum sKL concentration may be a useful marker of the renala-KL level. We also found that secretion of FGF23 into the circulation is enhanced by renal failure-related Pi hoarding at early stages of CKD. The resultant rise in FGF23 increased FEPi and reduced 1,25VitD3 levels via FGF23-a-KL signaling. This would in turn lead to normalization of serum Pi levels, despite falling renal a-KL expression. In advanced CKD, by contrast, levels of a-KL are not sufficient to support renal FGF23-a-KL signaling, so FGF23 cannot compen-sate for the renal failure-induced Pi retention. Consequently, serum Pi is elevated, which would stimulate further increases in FGF23 secretion. It is thus important to assess renal a-KL
expression in CKD patients for appropriate management of serum FGF23 levels.
Supporting Information
Table S1 Multiple regression analysisA of urinary fractional excretion of phosphate (FEPi) in CKD patients at stages 1, 2 and 3.
(DOCX)
Table S2 Multiple regression analysisA of serum 1,25(OH) 2 vitamin D3 levels in CKD patients at stages 1, 2 and 3. (DOCX)
Figure S1 Correlation between renala-KL mRNA levels and clinical mineral metabolism parameters and eGFR in CKD patients. (A) Renal a-KL mRNA levels are plotted against serum concentrations of corrected calcium, (B) inorganic phosphate, (C) 1,25(OH)2 vitaminD3, (D) FGF23 and (E) intact PTH, as well as (F) eGFR in CKD patients. Correlations were evaluated using Pearson’s correlation coefficient.
(TIF)
Acknowledgments
We are indebted to Mss. Aya Asano and Miyako Sakaida of Nara Medical University for their excellent technical assistance.
Author Contributions
Conceived and designed the experiments: KN. Performed the experiments: HS KN OA SY. Analyzed the data: HS KN N. Kurumatani MI N. Konishi YS. Contributed reagents/materials/analysis tools: AI TT NI YN. Wrote the paper: HS KN MI.
References
1. Kuro-o M, Matsumura Y, Aizawa H, Kawaguchi H, Suga T, et al. (1997) Mutation of the mouse klotho gene leads to a syndrome resembling ageing. Nature 390: 45–51.
2. Tohyama O, Imura A, Iwano A, Freund JN, Henrissat B, et al. (2004) Klotho is a novel beta-glucuronidase capable of hydrolyzing steroid beta-glucuronides. J Biol Chem 279: 9777–9784.
3. Urakawa I, Yamazaki Y, Shimada T, Iijima K, Hasegawa H, et al. (2006) Klotho converts canonical FGF receptor into a specific receptor for FGF23. Nature 444: 770–774.
4. Kurosu H, Ogawa Y, Miyoshi M, Yamamoto M, Nandi A, et al. (2006) Regulation of fibroblast growth factor-23 signaling by klotho. J Biol Chem 281: 6120–6123.
Figure 7. Serum solublea-Klotho (a-KL) levels in CKD patients. (A) Correlation between the serum solublea-KL concentration and renal
a-KL mRNA level in CKD patients. (B) Serum solublea-KL concentration in pre-HD stage 5 CKD patients and hemodialysis (HD) patients. Correlations were evaluated using the Pearson’s correlation coefficient. Data are shown as means6S.D. Student’st-test was used to compare two unpaired groups. *P,0.01.
doi:10.1371/journal.pone.0086301.g007
Table 5.Multiple regression analysisAof serum solublea-KL in CKD patients.
Independent variables bB Pvalue
Renala-KL 0.803 ,0.0001
1,25(OH)2vitamin D3 20.085 0.2525
Intact PTH 0.01 0.9045
FGF23 0.05 0.6543
Serum corrscted calcium 20.008 0.8933
Serum inorganic phosphate 20.047 0.6033
Age 0.105 0.0943
eGFRa
20.218 0.1125
AAdjusted coefficient of determination (R2); R2= 0.382 ,P
,0.0001. BStandard partial regression coefficient.
Abbreviations:a-KL,a-klotho; PTH, parathyroid hormone; FGF23, fibroblast growth factor 23;
eGFR, estimated glomerular filtration rate.
aeGFR was calculated using the creatinine-based Modification of Diet in Renal
Disease Study Equation.
5. Shimada T, Hasegawa H, Yamazaki Y, Muto T, Hino R, et al. (2004) FGF-23 is a potent regulator of vitamin D metabolism and phosphate homeostasis. J Bone Miner Res 19: 429–435.
6. Perwad F, Zhang MY, Tenenhouse HS, Portale AA (2007) Fibroblast growth factor 23 impairs phosphorus and vitamin D metabolism in vivo and suppresses 25-hydroxyvitamin D-1alpha-hydroxylase expression in vitro. Am J Physiol Renal Physiol 293: F1577–1583.
7. Razzaque MS, Sitara D, Taguchi T, St-Arnaud R, Lanske B (2006) Premature aging-like phenotype in fibroblast growth factor 23 null mice is a vitamin D-mediated process. FASEB J 20: 720–722.
8. Nakatani T, Sarraj B, Ohnishi M, Densmore MJ, Taguchi T, et al. (2009) In vivo genetic evidence for klothodependent, fibroblast growth factor 23 (Fgf23) -mediated regulation of systemic phosphate homeostasis. FASEB J 23: 433–441. 9. Razzaque MS, Lanske B (2007) The emerging role of the fibroblast growth factor-23-klotho axis in renal regulation of phosphate homeostasis. J Endocrinol 194: 1–10.
10. Shimamura Y, Hamada K, Inoue K, Ogata K, Ishihara M, et al. (2012) Serum levels of soluble secreted alpha-Klotho are decreased in the early stages of chronic kidney disease, making it a probable novel biomarker for early diagnosis. Clin Exp Nephrol 16: 722–729.
11. Seiler S, Reichart B, Roth D, Seibert E, Fliser D, et al. (2010) FGF-23 and future cardiovascular events in patients with chronic kidney disease before initiation of dialysis treatment. Nephrol Dial Transplant 25: 3983–3989.
12. Gutierrez OM, Mannstadt M, Isakova T, Rauh-Hain JA, Tamez H, et al. (2008) Fibroblast growth factor 23 and mortality among patients undergoing hemodialysis. N Engl J Med 359: 584–592.
13. Isakova T, Xie H, Yang W, Xie D, Anderson AH, et al. (2011) Fibroblast growth factor 23 and risks of mortality and end-stage renal disease in patients with chronic kidney disease. JAMA 305: 2432–2439.
14. Faul C, Amaral AP, Oskouei B, Hu MC, Sloan A, et al. (2011) FGF23 induces left ventricular hypertrophy. J Clin Invest 121: 4393–4408.
15. Matsumura Y, Aizawa H, Shiraki-Iida T, Nagai R, Kuro-o M, et al. (1998) Identification of the human klotho gene and its two transcripts encoding membrane and secreted klotho protein. Biochem Biophys Res Commun 242: 626–630.
16. Shiraki-Iida T, Aizawa H, Matsumura Y, Sekine S, Iida A, et al. (1998) Structure of the mouse klotho gene and its two transcripts encoding membrane and secreted protein. FEBS Lett 424: 6–10.
17. Chen CD, Podvin S, Gillespie E, Leeman SE, Abraham CR (2007) Insulin stimulates the cleavage and release of the extracellular domain of Klotho by ADAM10 and ADAM17. Proc Natl Acad Sci U S A 104: 19796–19801. 18. Bloch L, Sineshchekova O, Reichenbach D, Reiss K, Saftig P, et al. (2009)
Klotho is a substrate for alpha-, beta- and gamma-secretase. FEBS Lett 583: 3221–3224.
19. Imura A, Iwano A, Tohyama O, Tsuji Y, Nozaki K, et al. (2004) Secreted Klotho protein in sera and CSF: implication for post-translational cleavage in release of Klotho protein from cell membrane. FEBS Lett 565: 143–147. 20. Imai E, Horio M, Nitta K, Yamagata K, Iseki K, et al. (2007) Modification of
the Modification of Diet in Renal Disease (MDRD) Study equation for Japan. Am J Kidney Dis 50: 927–937.
21. Yamazaki Y, Imura A, Urakawa I, Shimada T, Murakami J, et al. (2010) Establishment of sandwich ELISA for soluble alpha-Klotho measurement: Age-dependent change of soluble alpha-Klotho levels in healthy subjects. Biochem Biophys Res Commun 398: 513–518.
22. Kato Y, Arakawa E, Kinoshita S, Shirai A, Furuya A, et al. (2000) Establishment of the anti-Klotho monoclonal antibodies and detection of Klotho protein in kidneys. Biochem Biophys Res Commun 267: 597–602.
23. Gattineni J, Twombley K, Goetz R, Mohammadi M, Baum M (2011) Regulation of serum 1,25(OH)2 vitamin D3 levels by fibroblast growth factor 23 is mediated by FGF receptors 3 and 4. Am J Physiol Renal Physiol 301: F371–377.
24. Asai O, Nakatani K, Tanaka T, Sakan H, Imura A, et al. (2012) Decreased renal a-Klotho expression in early diabetic nephropathy in humans and mice and its possible role in urinary calcium excretion. Kidney Int 81 : 539–547. 25. Yoshimoto S, Nakatani K, Iwano M, Asai O, Samejima K, et al. (2007) Elevated
levels of fractalkine expression and accumulation of CD16+monocytes in glomeruli of active lupus nephritis. Am J Kidney Dis 50: 47–58.
26. Nakatani K, Fujii H, Hasegawa H, Terada M, Arita N, et al. (2004) Endothelial adhesion molecules in glomerular lesions: association with their severity and diversity in lupus models. Kidney Int 65: 1290–1300.